
Belgium Data Center Networking Market Size and Share
Market Overview
| Study Period | 2020 - 2031 |
|---|---|
| Forecast Data Period | 2026 - 2031 |
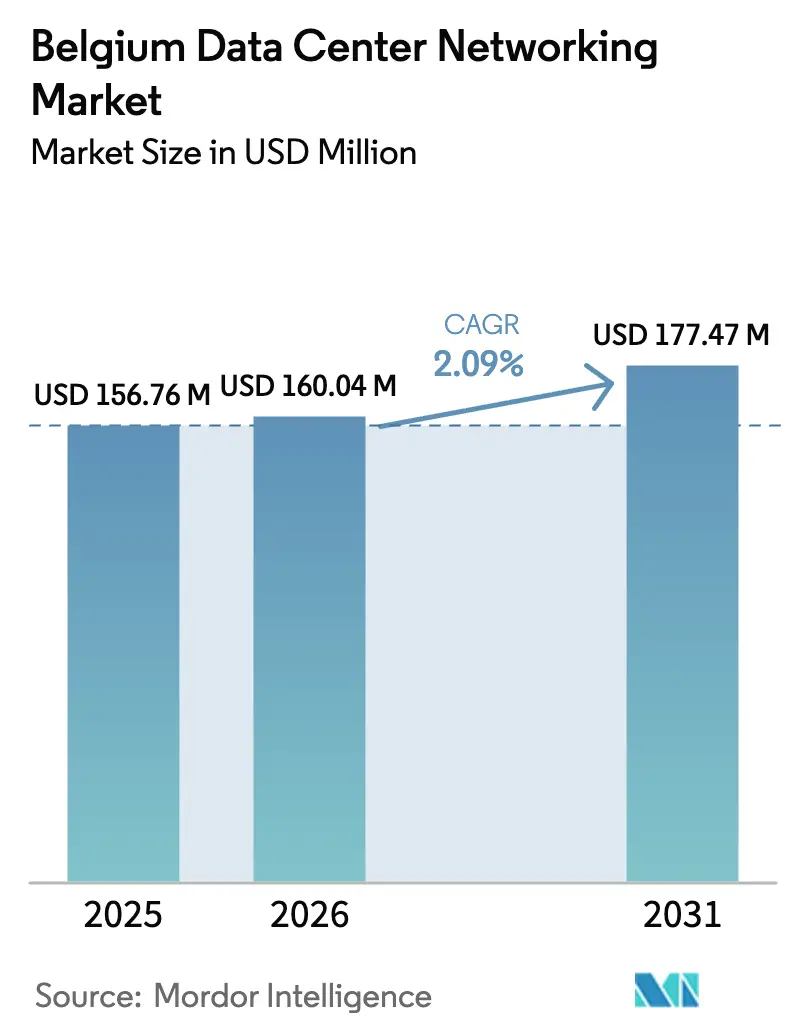
| Base Year Market Size (2025) | USD 156.76 Million |
| Market Size (2026) | USD 160.04 Million |
| Market Size (2031) | USD 177.47 Million |
| Growth Rate (2026 - 2031) | 2.09 % |
| Market Concentration | Medium |
Major Players *Disclaimer: Major Players sorted in no particular order Image © Mordor Intelligence. Reuse requires attribution under CC BY 4.0. | |
Belgium Data Center Networking Market Analysis by Mordor Intelligence
Belgium data center networking market size in 2026 is estimated at USD 160.04 million, growing from 2025 value of USD 156.76 million with 2031 projections showing USD 177.47 million, growing at 2.09% CAGR over 2026-2031. This steady trajectory mirrors the market’s gradual maturation as Belgian operators upgrade for AI-optimized traffic flows, sovereign data-routing mandates, and power-efficient designs. Heightened demand is reinforced by Google’s EUR 1 billion expansion pledge at St. Ghislain and by EU Digital Decade funds that earmark EUR 205 billion for regional digital transformation. Grid-connection bottlenecks and talent shortages temper momentum, yet policy-driven investments in climate-neutral edge nodes, offshore-wind PPAs, and 400 GbE switching sustain a stable growth outlook for the Belgium data center networking market. Vendors capable of combining hardware, software, and services around AI, security, and sustainability enjoy a strategic advantage as enterprises pursue cloud-first strategies and hyperscalers race to deploy capacity ahead of neighboring Netherlands and Germany.
Key Report Takeaways
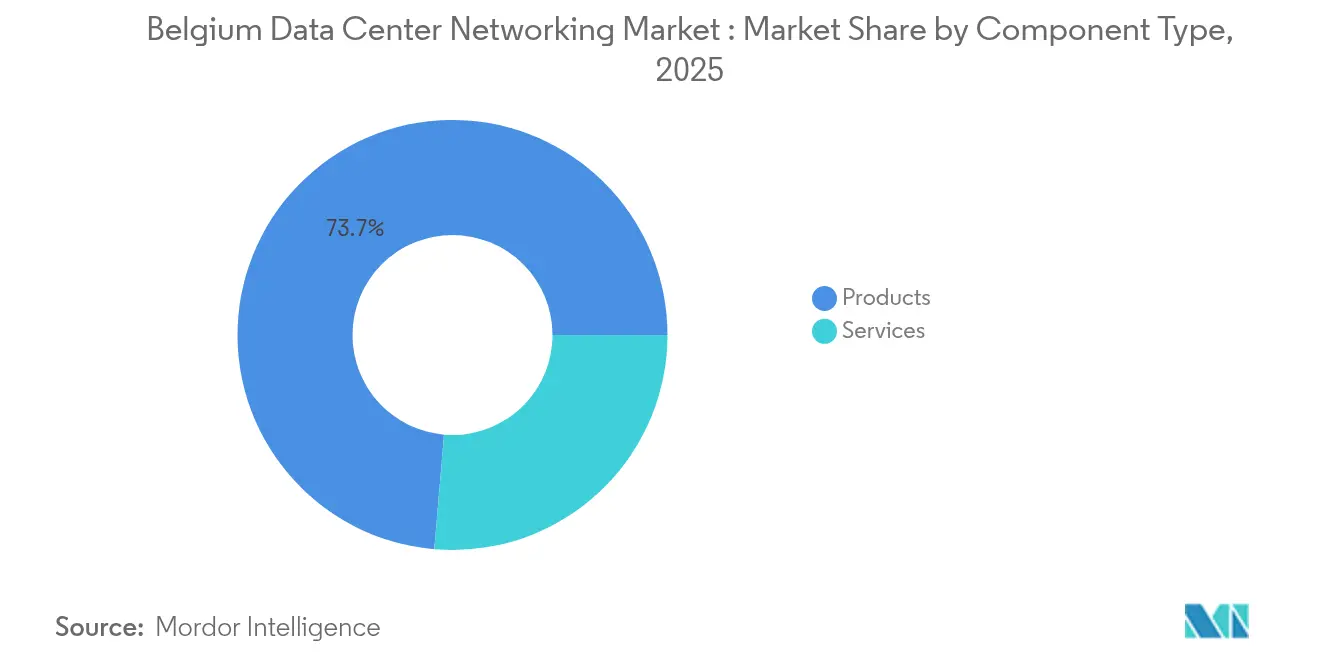
- By component, Products accounted for 73.65% of Belgium's data center networking market share in 2025, while Services are projected to expand at a 5.12% CAGR through 2031.
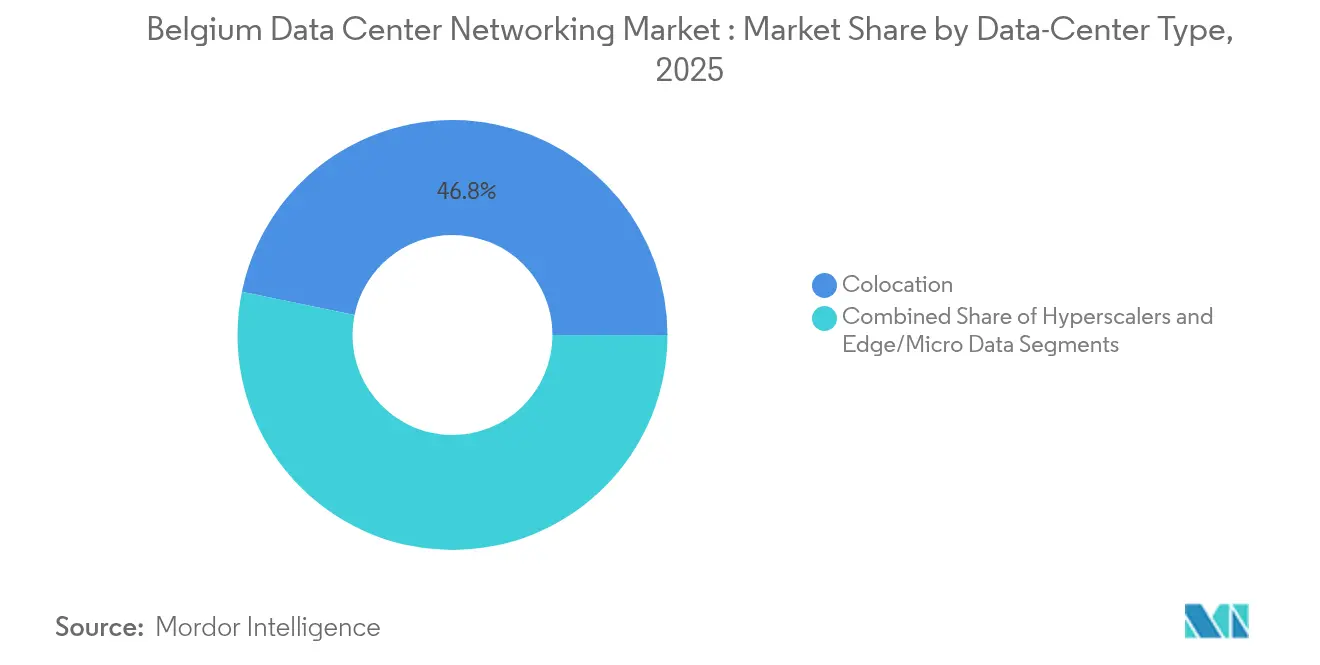
- By data-center type, Colocation held 46.78% of the Belgium data center networking market size in 2025; Hyperscalers and Cloud Service Providers post the fastest CAGR at 7.05% to 2031.
- By end-user, IT & Telecommunications captured 31.95% of 2025 revenue, whereas Healthcare & Life Sciences is forecast to grow at a 6.05% CAGR over 2026-2031.
- By bandwidth, the 50-100 GbE category commanded 32.85% of Belgium data center networking market share in 2025, yet >100 GbE bandwidth is rising at a 6.38% CAGR through 2031.
Note: Market size and forecast figures in this report are generated using Mordor Intelligence’s proprietary estimation framework, updated with the latest available data and insights as of 2026.
Belgium Data Center Networking Market Trends and Insights
Drivers Impact Analysis*
| Driver | (~) % Impact on CAGR Forecast | Geographic Relevance | Impact Timeline |
|---|---|---|---|
| Rising cloud-storage workloads | +0.8% | Global, concentrated in Brussels-Antwerp corridor | Medium term (2-4 years) |
| Surge in AI/ML traffic requiring 400 GbE+ switching | +0.6% | National, early adoption in hyperscaler facilities | Short term (≤ 2 years) |
| Edge-data-center roll-outs along Belgium’s 5G corridors | +0.4% | National, focused on TEN-T transport networks | Medium term (2-4 years) |
| EU Digital Decade funds for sovereign data-routing | +0.3% | EU-wide, Belgium benefits from strategic location | Long term (≥ 4 years) |
| Green-PPA incentives tied to North Sea offshore wind | +0.2% | Coastal Belgium, extending to inland facilities | Long term (≥ 4 years) |
| Brussels-based financial-sector data-localization mandates | +0.1% | Brussels Capital Region, spillover to Flanders | Medium term (2-4 years) |
| Source: Mordor Intelligence | |||
Rising Cloud-Storage Workloads
Enterprise cloud adoption is recasting network-design priorities as hybrid and multi-cloud architectures become standard. Workload mobility between private racks and global hyperscale fabrics forces Belgian operators to deploy higher-bandwidth links, embrace SDN for policy-driven routing, and adopt zero-trust segmentation. Financial institutions such as Euroclear signed seven-year cloud deals with Microsoft to boost AI analytics, exemplifying the sector’s appetite for burstable traffic corridors. Cloud-first roadmaps compel upgrades from 25 GbE leaf-spine to 100 GbE or 400 GbE trunks, fueling sustained hardware refresh cycles and managed-service demand. Belgian managed service providers profit by bundling connectivity, observability, and compliance into outcome-based contracts that offset talent shortages. As more workloads shift into SaaS and PaaS offerings, latency-sensitive storage replication across regionally diverse availability zones cements long-term demand for the Belgium data center networking market.
Surge in AI/ML Traffic Requiring 400 GbE+ Switching
Large language models and computer-vision pipelines create elephant flows that saturate legacy 100 GbE fabrics. Operators respond by adopting 400 GbE leaf-spine designs, RDMA over Converged Ethernet, and congestion-avoidance algorithms that minimize head-of-line blocking. The Ultra Ethernet Consortium’s protocol work accelerates adoption paths toward 800 GbE and 1.6 TbE. Cisco Nexus HyperFabric AI, co-engineered with NVIDIA, bundles telemetry, liquid-cooling-ready optics, and trust-domain isolation, enabling Belgian facilities to deliver deterministic bandwidth for training clusters.[1]Cisco Systems, “Introducing Cisco Secure AI Factory,” Cisco, cisco.com Early movers report double-digit efficiency gains in GPU utilization, strengthening the business case for capex-heavy optical upgrades. The competitive race among hyperscalers to scale AI drives front-loaded demand, keeping the Belgium data center networking market on a hardware-refresh cycle shorter than the historical five-year average.
Edge-Data-Center Roll-Outs Along Belgium’s 5G Corridors
EU TEN-T logistics routes intersect Belgium’s ports, airports, and rail hubs, creating fertile ground for low-latency edge nodes that support connected mobility, warehouse automation, and smart-city analytics. The 5 G-Blueprint pilot between Antwerp and Vlissingen showcases cross-border teleoperations that depend on under-10-ms round-trip latency. Edge nodes require ruggedized 100 GbE switches, timing accuracy below 50 ns, and automated service chaining that can scale across hundreds of micro-locations. Municipalities partner with operators to host curbside micro-datacenters that backhaul into larger colocation campuses via dark-fiber rings. Vendors supplying hardened optics and simplified zero-touch provisioning gain an early foothold before volume deployments ramp after 2026. As private 5 G licenses proliferate, campus-edge convergence blurs the line between telco and enterprise networks, expanding total addressable demand for the Belgian data center networking market.
EU Digital Decade Funds for Sovereign Data-Routing
The Digital Decade policy earmarks climate-neutral edge nodes and cross-border corridors that keep EU-citizen data within sovereign routes.[2]European Commission, “Digital Decade Policy Programme 2030,” European Commission, ec.europa.eu Belgium’s junction between London-Amsterdam-Frankfurt traffic and subsea cables positions it as a preferred hand-off point for regulated industries. To win grants, operators must demonstrate compliance with ENISA conformity assessments and the upcoming Cyber-Resilience Act. That drives uptake of European-developed routers featuring crypto-agile hardware, deterministic telemetry, and data-sovereign path selection. Belgium-based integrators package AAA, lawful-intercept, and quantum-safe key-exchange into their managed WAN services, capturing incremental revenue and lifting service CAGR above hardware growth. Over the long term, these policy funds embed digital-sovereignty compliance as a baseline feature in every new build, anchoring growth for the Belgian data center networking market.
Restraints Impact Analysis*
| Restraint | (~) % Impact on CAGR Forecast | Geographic Relevance | Impact Timeline |
|---|---|---|---|
| Shortage of certified DC-network engineers | -0.4% | National, acute in Brussels and Antwerp | Short term (≤ 2 years) |
| Grid-connection queues delaying new halls | -0.3% | National, severe in high-demand areas | Medium term (2-4 years) |
| Escalating capex for 400 GbE optics and liquid cooling | -0.2% | Global, affecting all market segments | Short term (≤ 2 years) |
| EU Eco-design directive raising compliance costs | -0.1% | EU-wide, Belgium implementing by September 2024 | Medium term (2-4 years) |
| Source: Mordor Intelligence | |||
Shortage of Certified DC-Network Engineers
Recruitment pipelines lag the pace of facility expansion, with half of Belgian operators reporting unfilled vacancies for network architects, automation engineers, and security specialists. Competition from fintech and cybersecurity firms drives turnover, while remote-work flexibility lures talent toward global roles. Although the Flemish regional government funds micro-credential programs for SDN, only a minority of graduates gain hands-on exposure to 400 GbE optics or liquid-cooling deployments. Projects, therefore, lean on high-cost contractors, lengthening integration timelines and trimming margins. Some operators postpone refresh cycles, depressing near-term hardware revenue inside the Belgium data center networking market. Managed-service providers capture share by offering outcome-based SLAs, but overall CAGR softens until reskilling initiatives bear fruit.
Grid-Connection Queues Delaying New Halls
European transmission operators face thousands of megawatts in queue backlogs, and Belgium’s grid-access approvals have stretched beyond five years for new megawatt-scale halls. Without guaranteed power, developers defer fibre-pull and networking procurements, slowing addressable demand. Operators pivot to on-site batteries and diesel-gensets to shorten timelines, yet those interim solutions raise opex and carbon intensity, conflicting with EU taxonomy rules. A national task force is exploring shared-grid upgrades around port zones, but relief is unlikely before 2027. The drag on facility-go-live schedules translates directly into fewer switch and router shipments in the near term, tempering growth for the Belgium data center networking market.
*Our forecasts treat driver/restraint impacts as directional, not additive. The impact forecasts reflect baseline growth, mix effects, and variable interactions.
Segment Analysis
By Component: Services Gain Momentum Despite Product Dominance
The Services segment is projected to grow at a 5.12% CAGR, even though Products still delivered 73.65% of 2025 revenue. Managed network services, driven by AI workload complexity and scarce engineering talent, underpin this outperformance. Training, integration, and lifecycle automation are in high demand as enterprises outsource to specialists instead of building in-house skills. Large public-sector contracts, such as the Belgian Ministry of Defense hiring Legrand Data Center Solutions for turnkey deployments, signal longer multi-year service engagements. Meanwhile, product sales mature because switch-replacement cycles lengthen once 400 GbE fabrics are deployed. Nevertheless, AI cluster roll-outs ensure a premium tier of optics and DPUs sustains core hardware revenue in the Belgium data center networking market.
Operators increasingly procure bundled hardware-plus-services to guarantee SLA compliance around jitter, packet loss, and energy efficiency. Installation projects now incorporate liquid-cooling loops, structured cabling rated for 1.6 TbE, and digital-twin modelling for predictive maintenance. This hybrid procurement style blurs the boundary between capex and opex, providing steady annuity income to integrators. Consequently, while Products remain the largest slice of the Belgium data center networking market size, Services’ rising contribution signals a shift toward outcome-based economics that aligns with AI-driven continuous deployment cycles.



By End-User: Healthcare Digitization Accelerates Networking Demand
Healthcare & Life Sciences registers the fastest CAGR at 6.05% through 2031, despite IT & Telecommunications retaining the largest 2025 share. Digitally transforming hospitals deploy telemedicine, AI diagnostics, and real-time monitoring, pushing up bandwidth and latency requirements. To meet GDPR and NIS2 directives, operators integrate in-line encryption and micro-segmentation into healthcare networks. Electronic Health Record sync and imaging archiving demand east-west traffic patterns that reward spine-leaf architectures. In contrast, financial services networks stabilise after early cloud migrations, though data-localization statutes still necessitate high-resilience, low-latency circuits in the Brussels cluster.
Pharmaceutical research parks adopt edge analytics for lab automation and genomic sequencing, creating micro-data-center opportunities in Wallonia. Manufacturing adds demand by wiring predictive-maintenance sensors to on-prem edge stacks, but growth lags healthcare due to more conservative capex cycles. Cumulatively, these vertical shifts diversify the Belgium data center networking market and promote specialized service offerings around sector-specific compliance frameworks.
By Data-Center Type: Hyperscalers Drive Infrastructure Evolution
Hyperscalers and cloud service providers are forecast to expand at a 7.05% CAGR, outpacing colocation, although the latter retains 46.78% of 2025 revenue. Google’s EUR 1 billion expansion exemplifies hyperscalers’ appetite for renewable-powered, AI-ready Belgian capacity. These builds standardize on high-density racks, phased-array optics and fabric automation, lifting average network spend per megawatt. Colocation operators counter by adding high-speed cross-connect ecosystems that mimic cloud on-ramps, prolonging their relevance and preserving the Belgium data center networking market share associated with multi-tenant models.
Edge and micro-data-centers, while still a small slice, surge in port cities and along 5G corridors. Their needs differ: compact form factors, temp-hardened equipment, and autonomous orchestration. Vendors that modularize switch-OS stacks and supply line-card options for harsh environments gain a first-mover edge. This heterogeneity across facility types expands the solution mix and cushions the Belgium data center networking market against single-segment volatility.
By Bandwidth: High-Speed Adoption Accelerates AI Readiness
The greater than 100 GbE tier is rising at a 6.38% CAGR as GPU clusters demand wider pipes, whereas 50-100 GbE still held 32.85% of 2025 spend. Operators leapfrog intermediate speeds, retiring less than or equal 10 GbE and 25-40 GbE links to curb operational complexity. Linear pluggable optic transceivers at 800 GbE reduce heat to help facilities meet EU Eco-design power targets. Standard-setting bodies advance 1.6 TbE roadmaps, signaling another upgrade wave inside the forecast window, which will reinforce high-end revenue inside the Belgium data center networking market size for bandwidth-intensive applications.
Adoption barriers remain: steeper optic prices and the need for liquid-cooling retrofits. Yet AI training efficiency gains outweigh capex premiums for hyperscalers. Enterprises follow suit in smaller increments, adopting 100 GbE Top-of-Rack and 400 GbE spines, keeping the sales funnel healthy across product classes.
Geography Analysis
Belgium’s central location and multilingual workforce help it capture spillover demand from grid-saturated Netherlands and compliance-restricted United Kingdom. Brussels anchors government and finance workloads, enjoying sovereign-cloud mandates that insist on in-country routing. Flanders attracts greenfield hyperscale builds thanks to available land parcels near offshore-wind interconnects, aligning with corporate carbon-neutral pledges and EU taxonomy requirements. Wallonia, traditionally manufacturing-oriented, now promotes defense-cloud and aerospace analytics, prompting specialized edge facilities.
Cross-border fibre with France and Germany accelerates data-localization adherence, requiring encrypted, telemetry-rich routers capable of auditing path compliance. Subsequent demand filters into the Belgium data center networking market through high-capacity DWDM gear and intent-based WAN controllers. The Princess Elisabeth Island power hub will feed 3.5 GW of wind into the grid, freeing new megawatts for data centers while obliging operators to implement grid-interactive networking gear for power-modulation telemetry. Dutch congestion yields near-term migration of projects to Ghent or Liège campuses, mitigating queue risks and granting Belgium an interim capacity advantage.
Regional 5G and edge initiatives foster distributed micro-facilities along transport corridors. Antwerp’s port rolls out private 5G to enable autonomous cranes, necessitating local packet-core and compute nodes with sub-5 ms latency. These nodes cascade incremental switch and firewall sales into the Belgium data center networking market. Collaboration with Luxembourg on financial clearing houses spurs resilient backbone builds that traverse both countries, underlining Belgium’s role as an inter-EU data hub.
Regulatory Landscape
Belgium's data center development and networking roll-outs operate within a fragmented permitting and compliance structure, with environmental and building permits handled by regional authorities in Flanders, Wallonia, and the Brussels-Capital Region, rather than one federal zoning category. On the infrastructure side, grid access and connection conditions have become a more explicit policy lever: Elia introduced a dedicated data center category in its network capacity framework that supports flexible connections that can be curtailed during peak demand, shaping how operators plan resilient network topologies and distributed architectures.
For connectivity and digital infrastructure, the Belgian Institute for Postal Services and Telecommunications (BIPT) regulates electronic communications networks and functions as a central body for implementing the EU Gigabit Infrastructure Act, influencing fiber access, civil works coordination, and deployment processes that underpin data center interconnection. In early 2026, the Commission for Electricity and Gas Regulation amended the connection code of conduct (January 29, 2026) to add binding deadlines and a use-it-or-lose-it mechanism for grid capacity, reinforcing the need for power-procurement certainty in data hall timelines and related networking procurement cycles. In parallel, FOD BOSA is advancing a national digitalization strategy under the 2025-2029 federal government agreement using a comply-or-explain approach, which increases scrutiny on cybersecurity and sovereign-routing controls for public sector and regulated workloads.
Value Chain Analysis
Belgium's data center networking value chain begins with global silicon, optics, and systems vendors supplying switches, routers, security appliances, SDN platforms, and optical interconnects, then moves through local and regional distributors, systems integrators, and managed service providers that deliver design, deployment, and lifecycle operations. On the demand side, carrier-neutral colocation and multi-operator facilities act as key aggregation points for interconnection-led network spend, with operators such as LCL Data Centers (carrier-neutral, Tier III), Datacenter United (carrier-neutral, Tier IV), and Wallonie Data Center (multi-operator, Tier III+) supporting enterprise, cloud on-ramp, and cross-connect ecosystems.
Implementation and assurance are closely tied to certification and audit requirements that affect product selection and supplier qualification, including ISO 9001, ISO 14001, ISO 27001, ISO 45001, PCI DSS, and facility-oriented standards such as TIA-942 Rated 3 or 4. The Belgian Digital Infrastructure Association (BDIA) coordinates activities across operators, suppliers, and service partners. Hyperscaler-led procurement also influences upstream and downstream demand: Google has highlighted a localized supply chain footprint in Belgium, working with around 150 Belgian suppliers (including 80 in Wallonia), which expands the base of contractors and specialized network deployment partners around major campus expansions.
Competitive Landscape
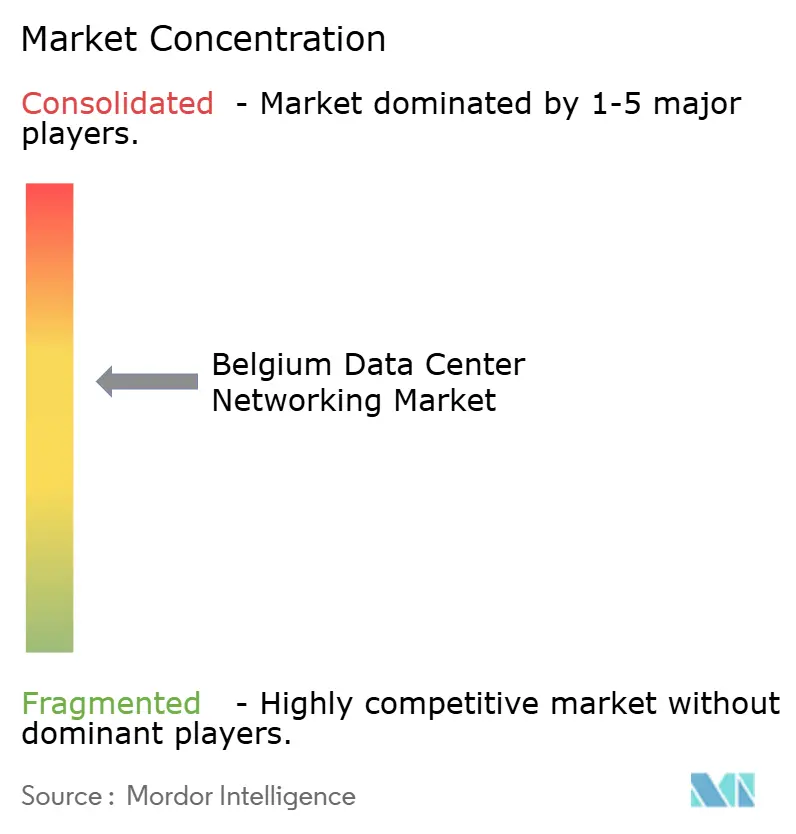
Industry consolidation produces a moderately concentrated field, led by Cisco, VMware, NVIDIA, and a cadre of optical component specialists. Cisco’s Nexus platform continues to dominate spine-leaf architectures, and its Secure AI Factory demonstrates a deep pivot toward vertically integrated AI fabrics. VMware leverages its vSphere heritage to lock in existing enterprises despite uncertainty after Broadcom’s acquisition. NVIDIA’s integration of Mellanox technology propels it from accelerator vendor to end-to-end network infrastructure supplier, especially for AI fabric deployments. Arista Networks registers outsized growth in 400 GbE shipments, signalling intensifying competition in the high-performance segment.
Strategic partnerships cluster around AI and sustainability: Dell-Equinix supply private AI stacks; Nutanix allies with Pure Storage, NVIDIA, and Cisco to present an alternative to VMware; and Nokia’s O-RAN contract with Deutsche Telekom widens its credibility in open networking. Belgian procurement remains relationship-driven, advantaging incumbents proficient in local compliance regimes and bilingual support. White-box and software-only challengers struggle with certification cycles and channel coverage, limiting disruption in the Belgium data center networking market.
Key vendor tactics include co-designing photonic roadmaps with optic makers, embedding telemetry ASICs for energy accounting, and offering consumption-based pricing that syncs with enterprise cloud budgets. Sustainability badges tied to Eco-design compliance and Scope 3 reporting move from marketing differentiators to RFP gatekeepers. Overall, competitive positioning now hinges on breadth of AI readiness, sustainability roadmaps and managed-service overlay.
Belgium Data Center Networking Industry Leaders
Cisco Systems Inc.
Dell Technologies Inc.
Hewlett Packard Enterprise Co.
Broadcom Inc. (incl. Brocade)
Juniper Networks, Inc.
- *Disclaimer: Major Players sorted in no particular order

Market Opportunities and Future Outlook
AI- and cloud-driven capacity additions are creating room for higher-bandwidth fabrics, optical transport, and managed network services that reduce operational burden in an environment constrained by talent. A clear catalyst is Google's announcement of a EUR 5 billion investment in Belgium for 2026-2027 to expand its data center campus in Saint-Ghislain, with a scale of spend that lifts demand for AI-ready leaf-spine switching, high-capacity optical interconnects, and security segmentation inside and between facilities. In Brussels, regulated and latency-sensitive workloads keep requirements focused on sovereign routing, telemetry, and compliance-aligned architectures, supporting demand for SDN-driven policy control and encrypted east-west traffic handling.
National and EU digitalization programs also support networking refresh opportunities across enterprise and public-sector accounts. Belgium earmarked 27% of its recovery and resilience plan (EUR 1.3 billion) to digital technologies, and the 2026 federal SME Plan introduced measures to facilitate business digitalisation and support innovative companies, widening the base of mid-market adopters moving workloads into colocation and cloud-connected environments. With grid-connection uncertainty ongoing, operators and customers are evaluating distributed designs, including edge and micro-data-center footprints along transport and 5G corridors, which increases demand for standardized, remotely operated network stacks, zero-trust segmentation, and service-based operating models that can scale across many smaller sites rather than only a few hyperscale halls.
Recent Industry Developments
- July 2026: Proximus selected Ekinops to modernize its nationwide optical network (NEURON project), replacing about 700 network nodes over four years, with the first deployment planned in Q4 2026. The modernization supports higher-capacity optical transport and strengthens Belgian wholesale and enterprise transport capabilities alongside AI-ready bandwidth capacity.
- July 2026: Nokia was chosen by Orange Belgium as the sole supplier to unify fixed and mobile transport infrastructure into a single converged optical transport network across Belgium. The upgrade strengthens the nationwide optical backbone and creates cross-portfolio monetization opportunities for Nokia and Orange Belgium.
- May 2026: Ekinops launched a new generation of Network-as-a-Service solutions in Belgium, integrating Proximus Wholesale infrastructure with Ekinops software. The offering enables software defined, wholesale integrated optical networking and supports service agility and AI-ready connectivity for the Belgian data-center networking market.


Research Methodology Framework and Report Scope
Market Definition and Coverage
This market covers networking equipment and related services used inside data centers in Belgium to move, route, and secure data traffic between servers, storage, and external networks. The market sizing is captured as vendor revenues earned from data center operators and enterprise data center owners.
Scope exclusions: We exclude general telecom access networks outside the data center, end-user devices, and pure building construction works that do not directly deliver networking capability.
Segmentation Overview
- By Component
- Products
- Ethernet Switches
- Routers
- Storage Area Network (SAN)
- Application Delivery Controllers (ADC)
- Network Security Appliances
- Software-Defined Networking (SDN) Controllers
- Optical Interconnects
- Services
- Installation and Integration
- Training and Consulting
- Support and Maintenance
- Managed Network Services
- Products
- By End-User
- IT and Telecommunications
- Banking, Financial Services and Insurance (BFSI)
- Government and Defense
- Media and Entertainment
- Healthcare and Life Sciences
- Manufacturing and Industrial
- Other End-Users
- By Data-Center Type
- Colocation
- Hyperscalers/Cloud Service Providers
- Edge/Micro Data Centers
- By Bandwidth
- Less Than or Equal to 10 GbE
- 25–40 GbE
- 50–100 GbE
- Greater than 100 GbE
Data Sources, Market Sizing, and Validation
Desk Research
Desk work starts with building a clear demand map for Belgium data centers, then linking it to networking refresh cycles and bandwidth upgrades. We referenced public infrastructure and digital indicators from sources such as Eurostat, the European Commission Digital Economy and Society Index, and OECD digital statistics, which help anchor macro demand drivers without forcing the model to fit a single proxy.
To ground the data center footprint, we also used sources such as Belgium Data Center Industry Association publications, regulator and public agency releases, and peer reviewed papers that describe network fabrics and power density trends. These are complemented with annual reports, investor presentations, and reputable press coverage, and then selectively checked against paid subscriptions for company financials, patent activity, and shipment-level trade signals where available. This list is illustrative only, and many additional sources were reviewed to collect data, cross-check assumptions, and resolve inconsistencies.
Primary Interviews and Surveys
Primary validation was done through structured interviews and short surveys with data center operators, network integrators, component distributors, and enterprise IT teams that run on-prem data halls. We used these conversations to confirm typical switch and router replacement timing, the pace of 25 to 40 GbE and higher upgrades, and how service spend is allocated across installation, maintenance, and support in Belgium.
Distribution of primary research fieldwork respondents
| Company type | Respondent position |
|---|---|
| Top tier: 25% | CXOs: 19% |
| Mid tier: 55% | Functional/Unit leaders: 35% |
| Smaller Players: 20% | Managers: 46% |
Market-Sizing & Forecasting
Sizing is built using a top-down and bottom-up model, where the top-down view reconstructs networking spend from Belgium data center activity signals and upgrade needs, and then gets stress-tested with selective supplier and channel checks. The model starts from the installed base of data center capacity and network architecture needs, which are then converted into equipment and services demand using replacement rates and typical spend per site category.
Key inputs used (illustrative) include: the mix of colocation versus hyperscale and enterprise facilities, average port speeds and migration pace (for example, movement from 10 GbE to 25 to 40 GbE and higher), typical refresh cycles for switches and routers, service attach rates for installation and maintenance, and pricing direction for high-speed switching ports. Forecasting uses scenario analysis, where base, conservative, and expansion cases are built around pipeline confidence, power availability constraints, and the timing of large capacity additions. Where bottom-up evidence is incomplete, gaps are handled by applying validated ranges for spend per MW and per rack, followed by a review with industry respondents before finalizing totals.
Data Validation & Update Cycle
Validation is done by triangulating the model output against independent signals such as data center capacity additions, reported utilization trends, and observed upgrade patterns for higher bandwidth networking. Outliers are flagged when the implied spend per site, per MW, or per port appears inconsistent with interview feedback, and those lines are reworked before sign-off.
A second analyst review is performed to check arithmetic, currency conversions, and year alignment, and then we re-contact select respondents if a variance cannot be explained with public evidence. Reports are refreshed annually, and interim adjustments are made when material events change the near-term build pipeline or pricing assumptions. Before delivery, we run a final update pass so the numbers reflect the latest available information.
Mordor Intelligence's Belgium Data Center Networking Market Size Versus Other Published Estimates
Published values for this market can differ more than people expect, even when they look like they are talking about the same country and the same type of technology. The differences usually come from what is counted as networking, which buyer types are included, and how upgrade timing is translated into yearly revenue.
The main gap comes from whether service revenue and bandwidth migration are counted only when projects are executed inside Belgian data centers, which is where Mordor Intelligence ties the estimate to actual refresh cycles and port-speed transitions instead of using broader IT spend proxies.
Benchmark comparison
| Source | Market Size | Gaps in Research Methodology |
|---|---|---|
| Mordor Intelligence | USD 156.76 M (2025) | |
| Digital Infrastructure Blog A | USD 220.00 M (2024) | Applies a faster growth profile and a broader networking interpretation, which can pull in adjacent enterprise networking spend that is not strictly tied to data center refresh events. |
| Industry Brief B | USD 160.04 M (2026) | Uses a forward year as the headline value, so it is not directly comparable to a current-year figure and can look higher or lower depending on the chosen base year. |
The spread in the table is mainly explained by scope choices and year selection, rather than simple math differences. By keeping the demand pool linked to executed upgrades and separating equipment from adjacent IT items, the final value stays traceable to a small set of repeatable inputs that can be rechecked during updates.


Key Questions Answered in the Report
What is the current size of the Belgium data center networking market?
The Belgium data center networking market size at USD 160.04 million in 2026 and is projected to rise to USD 177.47 million by 2031.
Which segment is growing fastest within the market?
Services deliver the fastest growth at a 5.12% CAGR, driven by demand for managed network operations, integration and AI-fabric consulting.
How are AI workloads influencing networking investments in Belgium?
AI training clusters require 400 GbE and 800 GbE switching fabrics, pushing operators toward liquid-cooled optics, congestion-aware protocols and telemetry-driven automation.
Why are grid-connection delays considered a restraint?
Lengthy power-access queues postpone new data-hall commissioning, which in turn delays networking hardware purchases and cools near-term market growth.
What role does the EU Digital Decade play in Belgium’s market outlook?
Digital Decade funding promotes sovereign data-routing and climate-neutral edge nodes, creating fresh opportunities for compliant, energy-efficient networking solutions.
Which bandwidth tier holds the largest share today?
The 50-100 GbE tier commands 32.85% of 2025 revenue, though >100 GbE is expanding more rapidly at a 6.38% CAGR.
Page last updated on:
- Data Center Security Market Security across all regions, split by security type, offering and facility type.
- Artificial Intelligence (AI) Data Center Market AI facilities across the global market, covering facility type, component and tier.
- Data Center Cooling Market Global cooling demand, split by cooling technology, cooling component and facility type.
- Data Center Fabric Market Network fabric across the global market, covering solution, application and end user.
- Europe Data Center Physical Security Market Physical security demand across Europe, covering component, data-center tier and facility type.
- Denmark Data Center Storage Market Storage demand across Denmark, covering facility size and tier.





