
Battery Plate Market Size and Share
Market Overview
| Study Period | 2021 - 2031 |
|---|---|
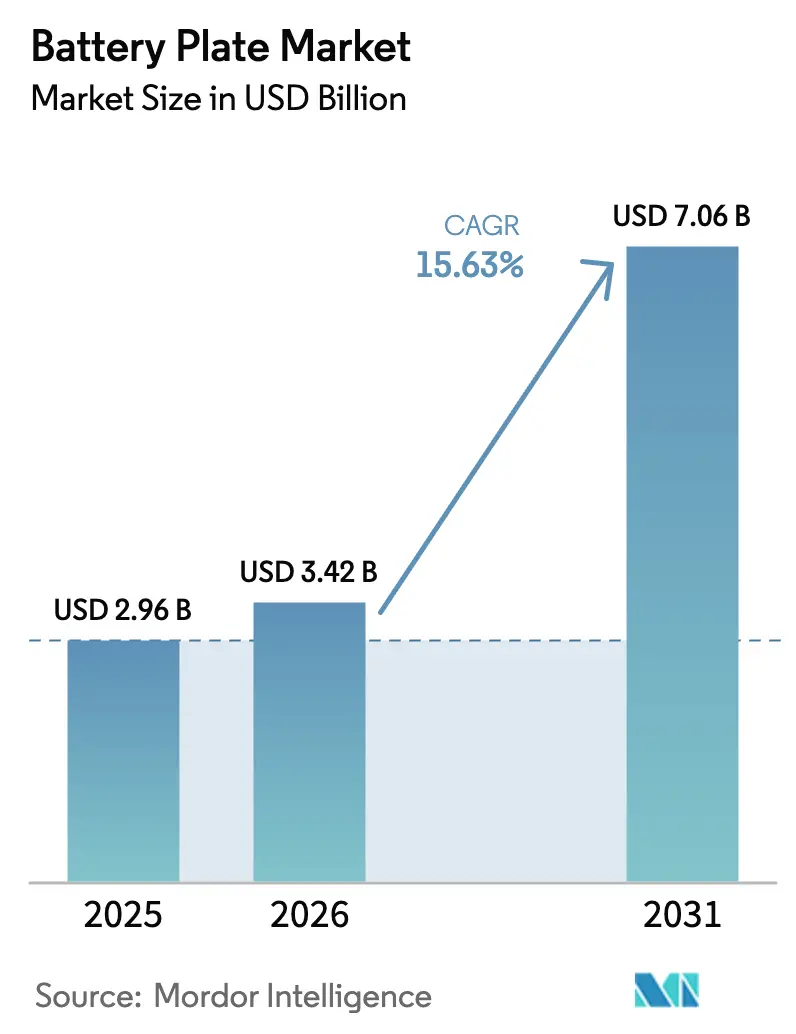
| Market Size (2026) | USD 3.42 Billion |
| Market Size (2031) | USD 7.06 Billion |
| Growth Rate (2026 - 2031) | 15.63 % |
| Fastest Growing Market | Asia Pacific |
| Largest Market | Asia Pacific |
| Market Concentration | Medium |
Major Players *Disclaimer: Major Players sorted in no particular order Image © Mordor Intelligence. Reuse requires attribution under CC BY 4.0. | |
Battery Plate Market Analysis by Mordor Intelligence
The Battery Plate market size is expected to grow from USD 2.96 billion in 2025 to USD 3.42 billion in 2026 and is forecast to reach USD 7.06 billion by 2031 at 15.63% CAGR over 2026-2031.
Demand scales with the rollout of electric vehicles, renewable-heavy grids, and factory upgrades that reduce the cost per plate while enhancing electrochemical performance. The battery plate market is therefore evolving from a traditional lead-acid component supplier to a cornerstone of the energy transition supply chain. The Asia-Pacific region anchors both production and consumption, while utility-scale storage pushes novel plate architectures, and manufacturing innovations, such as 3D printing, widen design latitude. Competitive rivalry intensifies as lead-acid specialists, lithium-ion leaders, and alternative-chemistry entrants vie for procurement contracts and technology partnerships.
Key Report Takeaways
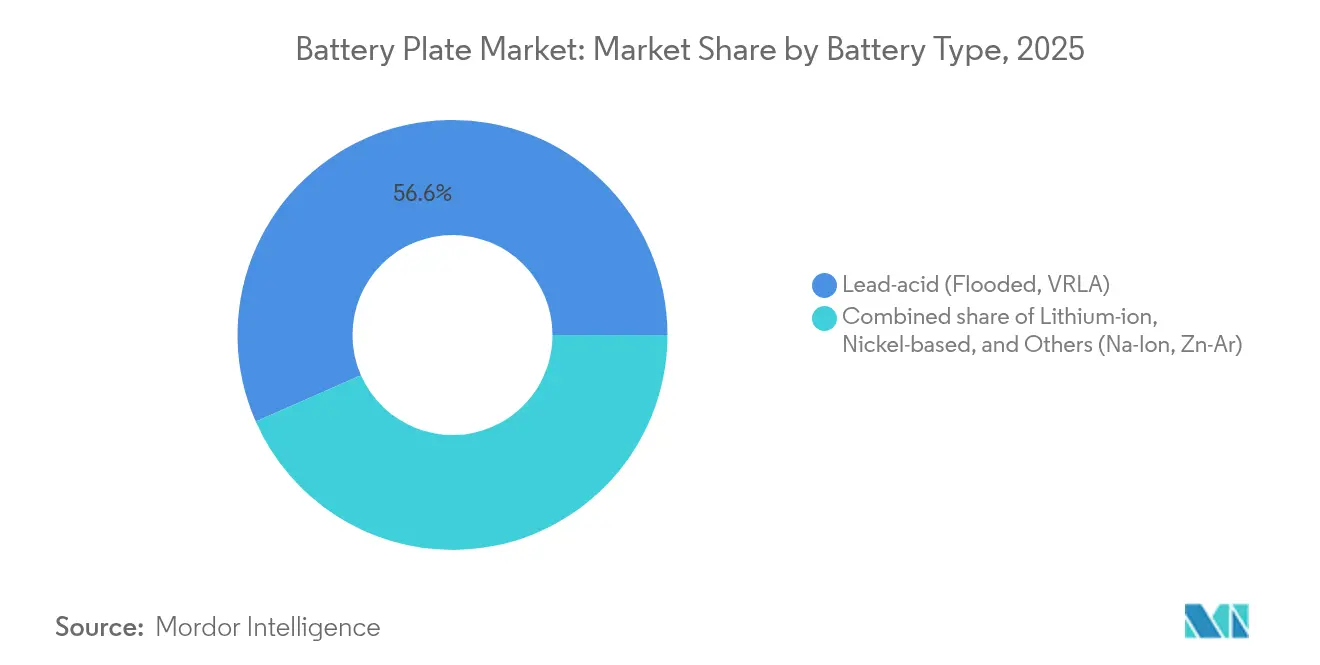
- By battery type, lead-acid technology led with 56.60% revenue share in 2025, while lithium-ion plates are forecast to grow at 17.15% CAGR through 2031.
- By plate material, lead-calcium alloys accounted for 47.05% of the battery plate market size in 2025; graphite-coated composites are set to accelerate at a 19.52% CAGR.
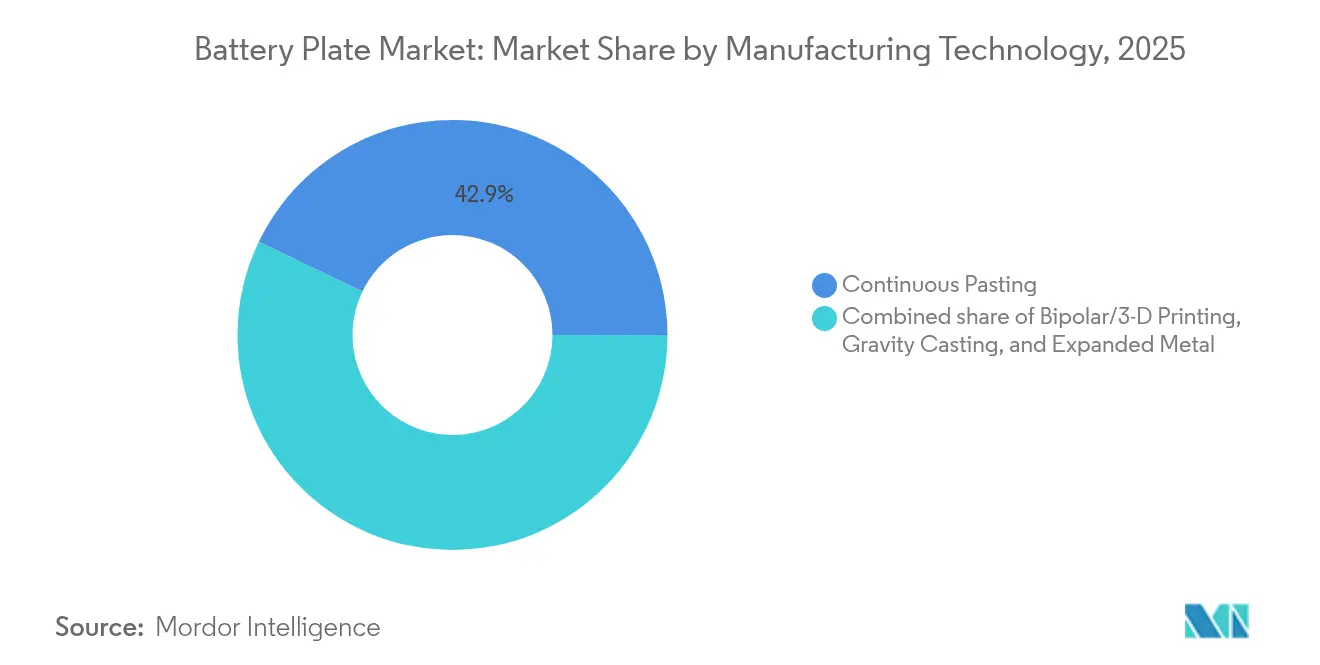
- By manufacturing process, continuous pasting captured 42.85% of the battery plate market share in 2025, whereas bipolar and 3D-printed plates are rising at an 18.62% CAGR.
- By end-user, automotive applications accounted for 52.25% of the battery plate market size in 2025, whereas energy storage systems are expected to advance at a 19.05% CAGR.
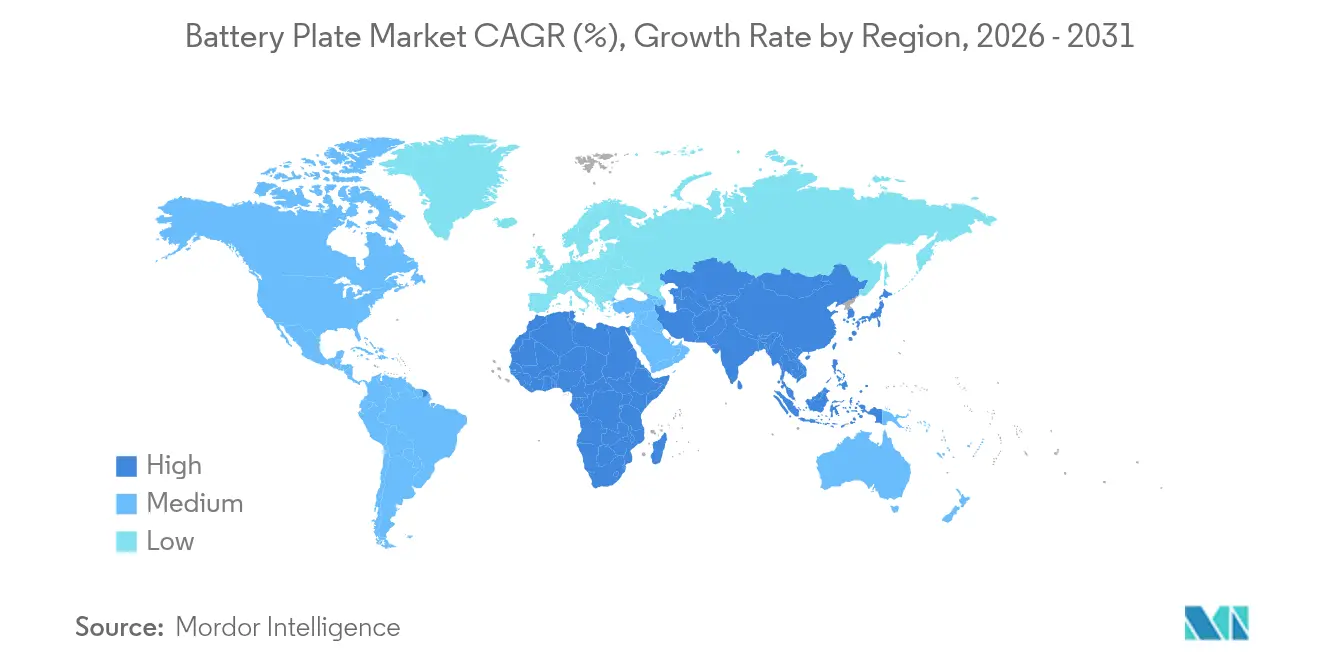
- By geography, the Asia-Pacific region commanded 58.90% of the battery plate market share in 2025 and is projected to expand at a 16.28% CAGR through 2031.
Note: Market size and forecast figures in this report are generated using Mordor Intelligence’s proprietary estimation framework, updated with the latest available data and insights as of 2026.
Market Trends and Insights
Drivers Impact Analysis of Battery Plate Market*
| Driver | (~) % Impact on CAGR Forecast | Geographic Relevance | Impact Timeline |
|---|---|---|---|
| EV-led surge in lead-acid SLI demand | +4.2% | Asia-Pacific, North America, global spill-over | Medium term (2-4 years) |
| Utility-scale ESS roll-outs in emerging markets | +3.8% | APAC core, MEA & South America spill-over | Long term (≥4 years) |
| Adoption of corrosion-resistant Pb-Ca-Sn grids | +2.1% | Europe & North America, global diffusion | Short term (≤2 years) |
| 3-D printed bipolar plate architectures | +1.9% | North America & Europe, expanding to APAC | Long term (≥4 years) |
| Source: Mordor Intelligence | |||
EV-led Surge in Lead-acid SLI Demand
Electric vehicles utilize 12 V lead-acid batteries for fail-safe power to critical functions, leaving a sizable floor for SLI plates despite the dominance of lithium-ion traction. Global EV sales touched 14 million units in 2024.[1]International Energy Agency, “Global EV Outlook 2025,” iea.org Start-stop systems within internal-combustion cars extend cycling frequency and heighten durability requirements, spurring higher-grade grid designs. Mild hybrids employ dual-battery setups, so lead-acid plates remain complementary rather than competitive to high-voltage packs. OEMs, therefore, maintain long-term contracts with established plate suppliers for auxiliary systems. This linkage cushions the battery plate market against abrupt lead-acid displacement and stabilizes baseline volumes across regions.
Utility-scale ESS Roll-outs in Emerging Markets
Emerging economies added 42 GW of grid storage in 2024, with 35% of the installations located outside mature OECD markets. Duration-driven projects select iron-flow, sodium-ion, and other chemistries, each needing bespoke plate geometry for multi-hour discharge. The world’s largest sodium-ion BESS entered service in 2024, proving cost-effectiveness where lithium sourcing remains pricey. Governments couple renewables with localized storage mandates, broadening procurement beyond conventional lithium-ion plates. Suppliers capable of engineering chemistry-specific plates gain a first-mover advantage as utilities solicit turnkey solutions.
Adoption of Corrosion-resistant Pb-Ca-Sn Grids
Valve-regulated lead-acid systems now rely on lead-calcium-tin alloys that demonstrate stronger electrochemical stability and lower water loss than antimony-rich grids. Thinner, lighter grids cut metal usage by up to 20% without compromising structural strength. Telecom and UPS operators gravitate toward maintenance-free formats, spurring immediate uptake in North America and Europe. Cost savings stem from fewer service visits and longer replacement cycles, directly improving total-cost-of-ownership metrics. These alloys thus reinforce the incumbent position of lead-acid plates in industrial standby applications.
3-D Printed Bipolar Plate Architectures
Additive manufacturing enables the integration of cooling channels, gradient thickness, and current-collection ribs within single-piece plates.[2]Nature Energy, “3D-printed Bipolar Plates for High-Power Batteries,” nature.com Tesla’s structural battery pack demonstrates how bipolar formats can eliminate module assembly, reduce part count, and enhance volumetric efficiency. Polymer-composite bipolar plates weigh 40% less than their metallic counterparts yet still meet the conductivity thresholds required for passenger-car environments. The method excels at rapid prototyping, enabling design iterations without the need for costly dies. Durability validation under high-temperature cycling is ongoing, but early field trials in stationary systems have already shown promising lifespan figures.
Restraints Impact Analysis of Battery Plate Market*
| Restraint | (~) % Impact on CAGR Forecast | Geographic Relevance | Impact Timeline |
|---|---|---|---|
| Volatility in refined-lead prices | -2.3% | Global, particularly impacting Asia-Pacific and Europe | Short term (≤ 2 years) |
| Stringent hazardous-waste directives (RoHS, ELV) | -1.7% | Europe and North America, expanding globally | Medium term (2-4 years) |
| Limited availability of high-purity recycled lead | -1.2% | Global, with acute impact in North America and Europe | Medium term (2-4 years) |
| Source: Mordor Intelligence | |||
Volatility in Refined-lead Prices
Lead prices fluctuated sharply in 2024, driven by supply disruptions and sustained demand for batteries. Raw materials account for up to 70% of plate production cost, so pricing spikes compress margins in short order. Recycling offers partial relief, yet high-purity alloy grades limit secondary content ratios in premium plates. Manufacturers hedge through long-term contracts and futures positions, but smaller firms lack the financial firepower to maintain stable input costs. Price instability, therefore, discourages capital investment in new plate lines and tilts procurement decisions toward chemistry diversification.
Stringent Hazardous-waste Directives (RoHS, ELV)
The EU End-of-Life Vehicles directive mandates rigorous recycling quotas, escalating compliance expenses for lead-based batteries. China’s roasting of RoHS rules to include batteries adds regional variants that complicate global supply planning. Manufacturers must document material composition, adapt alloy recipes, and certify processes for each jurisdiction. Compliance costs weigh heavier on SMEs, accelerating consolidation or exit. Simultaneously, the regulatory spotlight amplifies R&D into lead-free alternatives, thus redirecting funding away from traditional plate upgrades.
*Our forecasts treat driver/restraint impacts as directional, not additive. The impact forecasts reflect baseline growth, mix effects, and variable interactions.
Battery Plate Market Segment Analysis
By Battery Type:
Lead-acid Dominance Faces Lithium ChallengeLead-acid technology controlled 56.60% of the battery plate market share in 2025, primarily due to its entrenched use in automotive SLI and cost-sensitive industrial niches. Lithium-ion plates, however, are scaling at 17.15% CAGR as EV and high-performance storage proliferate, thereby re-balancing procurement budgets within the battery plate market. Flooded lead-acid units still anchor telecom backup because installers trust their field heritage and cost profile. VRLA derivatives meet the premium automotive demand for the introduction of sodium-ion and zinc-air entrants that address supply-chain risk and safety. CATL placed Naxtra sodium-ion batteries into mass production in June 2025, utilizing maintenance-free designs and rapid charge acceptance. Nickel-based systems fill aerospace and defense micro-segments, where extreme temperature tolerance offsets higher price points.
Diversification continues with sodium-ion and zinc-air entrants that address supply-chain risk and safety. CATL placed Naxtra sodium-ion batteries into mass production in June 2025, requiring aluminum rather than copper current collectors. Plate manufacturers now juggle multiple metallurgical toolkits to align with each chemistry’s corrosion profile. This fragmentation elevates design-for-manufacture complexity but also widens addressable opportunity across the battery plate market.



By Plate Material:
Advanced Composites Disrupt Traditional AlloysLead-calcium grids owned a 47.05% share of plate material demand in 2025, combining corrosion resistance with robust mechanical properties in sealed batteries. The battery plate market, nevertheless, rewards innovation; graphite-coated and carbon-foam composites are predicted to grow at a rate of 19.52% annually through 2031, driven by lightweighting and thermal-management agendas. Lead-antimony alloys persist in deep-cycle forklifts because they better withstand mechanical stress during heavy discharge. Niche applications turn to lead-tin mixes for superior conductivity, though elevated tin costs confine uptake to specialty products.
Composite momentum mirrors wider industry appetite for energy density gains. Group14’s silicon-rich SCC55 anode, for instance, lifts cell capacity by 50%, signalling comparable payoffs when carbon-rich matrices reduce internal resistance. Plate makers able to scale composite grids without cost blow-outs secure a differentiated portfolio within the battery plate market.
By Manufacturing Technology:
3D Printing Challenges Conventional MethodsContinuous pasting lines held a 42.85% market share of the battery plate market in 2025, owing to their proven throughput and repeatability. Yet, bipolar and 3D-printed formats are accelerating at an 18.62% CAGR, as additive layers permit lattice geometries that are beyond the reach of stamping. Gravity casting is suitable for low-volume, bespoke plates and for chemistries that require thicker sections. Expanded metal grids provide a high surface area with minimal scrap, making them attractive to two-wheeler batteries where every gram counts.
Digital-twin supervision, exemplified by Siemens and Fraunhofer’s Münster pilot, now integrates real-time data capture into plate factories, reducing waste and enhancing uptime. Such an Industry 4.0 overlay converts design freedom into economically viable output, reinforcing the appeal of advanced techniques inside the battery plate market.
By End-user:
Energy Storage Emerges as Growth EngineAutomotive customers accounted for 52.25% of revenue in 2025, linking household names such as Toyota and Ford to long-term SLI supply contracts. Energy storage systems, however, are projected to post a brisk 19.05% CAGR thanks to grid modernization, residential solar adoption, and flexible peaking mandates. Industrial motive power—forklifts, mining carts, port cranes—delivers predictable demand for deep-cycle plates engineered for harsh duty. Consumer electronics contribute modest but steady volume as devices shrink, yet proliferation continues.
Grid storage requires multi-hour endurance, along with high cycle life, nudging plate designers toward thick, corrosion-resistant grids and high-porosity active materials. Natron Energy’s 600 MW sodium-ion plant in Michigan demonstrates how alternative chemistries are being commercialized to meet these requirements. Suppliers that translate such needs into scalable plate production gain priority bidding status in utility procurement, underpinning future growth of the battery plate market.
Geography Analysis
APAC Battery Plate Market
Asia-Pacific controlled 58.90% of the battery plate market in 2025 and will maintain leadership at a 16.28% CAGR through 2031. China’s power battery output surged 176% in the first half of 2024, yet looming oversupply drives consolidation and efficiency projects. South Korea retains 37% of global battery cell capacity through LG Energy Solution and SK On, while government grants focus on pre-commercial solid-state platforms. Japan secures niche aerospace and premium-vehicle contracts, leveraging materials expertise even as volume shifts to mainland Asia. India’s Production-Linked Incentive program has attracted substantial investment; Amara Raja’s INR 95 billion gigafactory exemplifies the country’s localization push.
North America and Europe Battery Plate Market
North America and Europe together represent the next frontier for the battery plate market. United States capacity is slated to hit 1,200 GWh by 2030, aided by 10 new factories commencing in 2025. Federal tax credits tilt procurement toward domestic plates, prompting supplier footprint expansion. European projects aim for 1.5 TWh by 2030, though financing delays imperil half the announced pipeline. Germany hosts Northvolt’s 60 GWh facility, France backs Verkor at Dunkirk, and the EU Green Deal channels funds into recycling streams that will feed future plate alloy demand.
MEA and South America Battery Plate Market
South America and the Middle East & Africa add emerging prospects for the battery plate market. Brazil and Argentina exploit lithium and lead reserves, yet infrastructure hurdles moderate immediate scale-up. Gulf states deploy high-solar-penetration grids that require large energy storage buffers, opening tenders for sodium-ion and lead-carbon systems. Africa’s mineral wealth promises vertical integration possibilities, although political stability and logistics build-out remain prerequisites before gigafactory economics align.

Regulatory Landscape
Battery plate demand and manufacturing choices are increasingly shaped by battery sustainability, labeling, and end-of-life rules across major markets. In the European Union, Regulation (EU) 2023/1542 governs placing batteries on the market across SLI, industrial, and EV categories, and links technical documentation (including electrochemical performance and durability parameter values for rechargeable industrial batteries >2 kWh, LMT, and EV batteries from 18 August 2024) with extended producer responsibility, collection, and treatment obligations. The compliance timetable for supply-chain due diligence was updated by Regulation (EU) 2025/1561, which postpones a key application date to 26 July 2026. Related EU recycling efficiency and recovery methodology requirements also add annual data provision commencing for calendar year 2026, increasing the need for traceable materials and recycler reporting across lead-bearing and advanced plate supply chains.
In the United States, federal policy support includes EPA-led work under 42 USC 6966c to promote battery recycling through voluntary labeling guidelines aligned with international labeling standards and existing US battery management legislation. At the state level, Washington adopted WAC 173-905 (Battery Stewardship Program) on Dec. 16, 2025, effective Jan. 16, 2026, with phased collection obligations extending into later years. California also moved forward with rulemaking for its Responsible Battery Recycling Act, including a June 16, 2026 workshop and a June 16 to June 30, 2026 comment window. Together, these measures raise the bar on documentation, stewardship, and take-back readiness for plate and battery manufacturers supporting automotive, industrial standby, and emerging storage applications.
Competitive Landscape
Competitive intensity within the battery plate market is moderate, with no single technology or region dominating all use cases. Clarios, Exide, and GS Yuasa maintain strong automotive SLI footholds through longstanding OEM agreements and extensive service networks. CATL and BYD channel EV momentum into downstream plate demand while investing in R&D for sodium-ion and solid-state prototypes. Narada Power focuses on telecom standby arrays, Crown Battery steers into industrial deep-cycle niches, and Natron Energy scales blue-sodium chemistries for multihour grid services.
Strategic patterns diverge between vertical integration and specialization. CATL secures offtake pacts with GM and Volkswagen, coupling cell production with raw-materials sourcing under long-term contracts. Amara Raja signed technology-licensing deals with GIB EnergyX to leapfrog into lithium-iron-phosphate manufacturing. Traditional plate makers incubate joint ventures to share capital risk when entering lithium segments, while still leveraging legacy lead-acid volumes to fund R&D. Overcapacity in China pressures margins, whereas North American and European buyers pay premiums for compliance-ready, regionally sourced plates.
Innovation hotspots cluster around additive manufacturing, advanced alloys, and digital production control. Siemens’ digital-twin implementation enables “first-time-right” runs, which reduce scrap during 3D-printed plate fabrication.[4]Siemens AG, “Digital-Twin Solutions for Fraunhofer Battery Cell Factory,” siemens.com Group 14 and Lyten advance silicon-rich and lithium-metal inputs, respectively, influencing downstream plate metallurgy. In response, conventional lead-acid leaders pilot composite grids, hoping to retain share where cost and safety overshadow energy-density considerations. As chemistries diversify, suppliers capable of multi-chemistry plate portfolios enjoy hedged demand streams across cycles.
Battery Plate Industry Leaders
Clarios, LLC
GS Yuasa Corporation
Exide Industries Ltd.
East Penn Manufacturing
Enersys
- *Disclaimer: Major Players sorted in no particular order

Battery Plate Market Companies Covered in this Report
- Clarios, LLC
- Exide Industries Ltd.
- GS Yuasa Corporation
- East Penn Manufacturing Co.
- Enersys
- Amara Raja Energy & Mobility Ltd.
- Narada Power Source Co., Ltd.
- Camel Group Co., Ltd.
- Chaowei Power Holdings Ltd.
- Leoch International Technology Ltd.
- Crown Battery Manufacturing Co.
- Tianneng Power International Ltd.
- Hitachi Chemical Energy Technology
- Fiamm Energy Technology S.p.A.
- Panasonic Energy Co., Ltd.
- Toshiba Corporation
- BYD Co., Ltd.
- Contemporary Amperex Technology Co., Ltd. (CATL)
- SVOLT Energy Technology
- Envision AESC Group

Market Opportunities and Future Outlook
Compliance-driven redesign and documentation represent a near-term whitespace for plate makers and battery OEMs operating across multiple regions and chemistries. In the EU, the Batteries Regulation (EU) 2023/1542 raises requirements for labeling, information, and end-of-life performance and reporting across SLI, industrial, and EV batteries. Regulation (EU) 2025/1561 shifts due diligence timing to 26 July 2026, creating a defined window to upgrade supplier onboarding, material declarations, and audit-ready traceability for metals and composite inputs used in grids and current collectors. A second compliance-driven opportunity is in data systems and recycler integration: EU recycling efficiency and recovery methodology requirements call for annual information provision starting with calendar year 2026, which favors suppliers that can connect plate material specifications with verified recycling and recovery reporting.
In North America, stewardship and labeling initiatives expand the addressable services around plates, rather than just the parts themselves. EPA programs under 42 USC 6966c support voluntary recycling and labeling guidelines, while Washingtons WAC 173-905 (effective Jan. 16, 2026) and Californias Responsible Battery Recycling Act rulemaking steps in June 2026 increase the value of standardized labeling, safer handling instructions, and producer-led collection logistics across battery formats that incorporate plates. On the supply side, recent company investments also point to where capacity and capability are being built: Clarios reported progress under its USD 6 billion American Energy Manufacturing Strategy (including a May 2026 one-year update) and announced a major manufacturing expansion in St. Joseph, Missouri. GS Yuasa also secured METI certification for a new stationary lithium-ion battery plant in northern Tokyo (2 GWh per year). These moves underline commercial pull for advanced automotive and stationary products, where plate suppliers that can qualify materials across lead-acid, lithium-ion, and sodium-ion architectures can win multi-chemistry programs while meeting tightening stewardship and traceability requirements.
Recent Industry Developments in Battery Plate Market
- May 2026: Clarios expands its St. Joseph, Missouri manufacturing facilities by up to $390 million to boost automotive battery production capacity and modernize operations. The expansion strengthens the US auto battery supply chain by regionalizing production.
- May 2026: Clarios updates the $6 billion American Energy Manufacturing Strategy and expects more than $500 million to be invested in U.S. plants by the end of FY2026. This signals intensified capital deployment and scale-up in North American production.
- February 2026: GS Yuasa Corporation secures METI Stable Supply Assurance Plan certification for a new stationary Li-ion battery plant in northern Tokyo with about ¥70.3 billion investment and 2 GWh per year capacity. The project adds vertical integration into grid storage and strengthens supply assurances in Japan.


Battery Plate Market Report Scope and Research Methodology
Market Definition and Coverage
This market covers the revenue generated from battery plates used inside batteries to store and release electrical energy, including plates supplied to battery makers and plates sold as replacements through service channels.
Scope exclusions: We exclude complete batteries, separators, electrolytes, chargers, and battery packs because they are priced and purchased as different products.
Segments Covered in This Report
- By Battery Type
- Lead-acid (Flooded, VRLA)
- Lithium-ion
- Nickel-based
- Others (Zn-Air, Na-Ion, etc.)
- By Plate Material
- Lead-Antimony Alloy
- Lead-Calcium Alloy
- Lead-Tin Alloy
- Advanced Composites (Graphite-coated, Carbon Foam)
- By Manufacturing Technology
- Gravity Casting
- Continuous Pasting
- Expanded Metal
- Bipolar/3-D Printing
- By End-user
- Automotive (SLI, Start-Stop)
- Industrial (Forklifts, Telecom, UPS)
- Energy Storage Systems
- Consumer Electronics
- Aerospace and Defense
- By Geography
- North America
- United States
- Canada
- Mexico
- Europe
- Germany
- United Kingdom
- France
- Italy
- NORDIC Countries
- Russia
- Rest of Europe
- Asia-Pacific
- China
- India
- Japan
- South Korea
- ASEAN Countries
- Rest of Asia-Pacific
- South America
- Brazil
- Argentina
- Rest of South America
- Middle East and Africa
- Saudi Arabia
- United Arab Emirates
- South Africa
- Egypt
- Rest of Middle East and Africa
- North America
Data Sources, Market Sizing, and Validation
Desk Research
Desk research was used to build the starting data layer for production, trade, and end-use demand signals that influence battery plate consumption. We referenced public sources such as USGS for lead supply context, UN Comtrade for import and export patterns of related lead products, IEA for energy storage and electrification indicators, and OICA for vehicle production trends that drive replacement and OEM battery demand.
Along with this, we reviewed company annual reports, investor presentations, and reputable press releases to understand capacity additions, product mix, and regional footprint. Where needed, paid subscriptions for company financials and intelligence, patent databases, and shipment level import and export data were used to cross-check timelines and reduce guesswork around volumes and pricing. The sources listed above are illustrative, and many other public and paid references were also used for data collection, validation, and clarification.
Primary Interviews and Surveys
Primary work was used to pressure-test the desk assumptions, especially on what is actually sold as a plate versus a broader battery component. We spoke with manufacturers, distributors, recyclers, and large buyers across major producing and consuming regions, and then followed up on pricing, scrap recovery, and demand swings by application.
Survey inputs were used to triangulate average selling prices, the share of replacement demand versus OEM pull, and how technology shifts affect plate design and the materials used over time.
Distribution of primary research fieldwork respondents
| Company type | Respondent position | Region |
|---|---|---|
| Top tier: 34% | CXOs: 13% | APAC: 44% |
| Mid tier: 52% | Functional/Unit leaders: 39% | EMEA: 36% |
| Smaller Players: 14% | Managers: 48% | Americas: 20% |
Market-Sizing & Forecasting
Sizing starts with a top-down build where battery output and replacement demand signals are translated into an implied plate requirement by chemistry mix and typical plate intensity. From there, totals are reconciled with selective bottom-up checks like sampled supplier revenue rollups, channel checks from distributors, and volume x ASP sanity checks for common plate categories.
Key inputs in the model include lead price direction and pass-through behavior, vehicle parc and replacement cycles (which influence lead-acid demand), stationary backup and industrial battery deployment, regional manufacturing capacity and utilization, and trade flows that indicate which regions are net exporters or importers of plate-related materials. For forecasting, we use scenario analysis supported by expert views on electrification pace, recycling constraints, and pricing cycles, then convert these into yearly volume and ASP paths.
Where bottom-up data is incomplete for smaller local players, gaps are handled using proxy shares from trade data and capacity signals, and then adjusted through interview-based reality checks so totals remain consistent by region and end use.
Data Validation & Update Cycle
Validation is done through multiple checks so the model does not drift away from real market signals. We compare outputs against independent indicators such as lead consumption context, battery production direction, and observed pricing changes, and then investigate outliers before the internal review step.
If large variances show up by region or application, follow-up calls are triggered and assumptions are revisited, including ASP progression and demand timing. Reports are refreshed annually, and interim updates are made when material events occur, such as major capacity additions, recycling policy changes, or sharp commodity price moves. Before delivery, a final analyst pass is completed to ensure the latest public data points are reflected.
Mordor Intelligence's Battery Plate Market Sizing Compared With Other Published Estimates
Published market sizes for battery plates often differ because the scope lines are drawn in different places, and because pricing and volume assumptions move quickly with raw material cycles. We also see gaps when studies mix plate value with broader battery components, or when they use fixed conversion factors that do not match how plates are specified and sold in practice.
Complete batteries are kept outside Mordor Intelligence's scope, which reduces double counting when other estimates bundle plates with assembled battery revenue or pack-level value. Differences also come from how lead price pass-through is treated in ASPs, whether replacement demand is modeled from vehicle parc dynamics or assumed as a flat ratio, and how frequently assumptions are refreshed when trade flows and capacity utilization shift.
Benchmark comparison
| Source | Market Size | Gaps in Research Methodology |
|---|---|---|
| Mordor Intelligence | USD 2.96 B (2025) | |
| Industry Research Bulletin A | USD 2.98 B (2024) | Uses a prior-year base and commonly blends plate revenue with broader lead-acid battery component value, and then carries forward ASPs without clearly tying them to lead price timing. |
| Global Consultancy B | USD 3.26 B (2025) | Applies wider inclusion of plate-like parts across multiple chemistries and end uses, and relies on generalized demand multipliers instead of region-specific replacement cycle and trade-based cross-checks. |
The spread in the table mostly comes from what is counted as a plate versus a battery or adjacent component, and from how quickly pricing is allowed to move with lead cost cycles. By keeping assumptions traceable to demand signals, trade checks, and interview-confirmed ASP logic, the estimate stays practical to reproduce and easier to defend in planning discussions.


Key Questions Answered in the Report
What is the current value of the battery plate market?
The battery plate market size was USD 3.42 billion in 2026.
How fast is the battery plate market expected to grow?
The market is forecast to post a 15.63% CAGR over 2026-2031, taking revenue to USD 7.06 billion by 2031.
Which region leads battery plate demand?
Asia-Pacific held 58.90% of global revenue in 2025 and is forecast to grow the quickest at 16.28% CAGR.
Which application segment is expanding the fastest?
Energy storage systems are the fastest-growing end-user group with a 19.05% CAGR through 2031.
What manufacturing technologies are gaining traction?
Bipolar and 3D-printed plates are rising at an 18.62% CAGR, challenging continuous pasting’s incumbent position.
How do raw-material price swings affect suppliers?
Lead price volatility can shave 2.3 percentage points off forecast CAGR, forcing producers to adopt hedging and recycling strategies.
Page last updated on:


 Your data is secure and never sold or shared.


