
Automotive TIC Market Size and Share
Market Overview
| Study Period | 2020 - 2031 |
|---|---|
| Market Size (2026) | USD 21.28 Billion |
| Market Size (2031) | USD 26.86 Billion |
| Growth Rate (2026 - 2031) | 4.78 % |
| Fastest Growing Market | Asia Pacific |
| Largest Market | Asia Pacific |
| Market Concentration | Medium |
Major Players *Disclaimer: Major Players sorted in no particular order Image © Mordor Intelligence. Reuse requires attribution under CC BY 4.0. | |
Automotive TIC Market Analysis by Mordor Intelligence
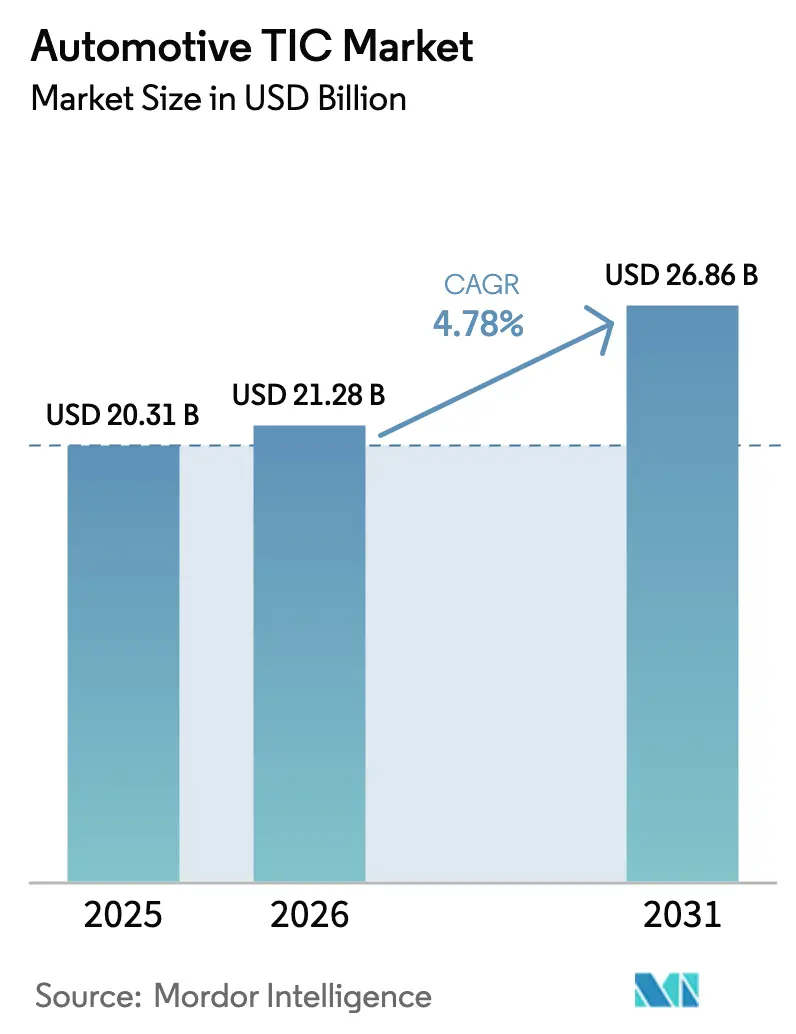
The automotive testing, inspection, and certification market size was valued at USD 20.31 billion in 2025 and estimated to grow from USD 21.28 billion in 2026 to reach USD 26.86 billion by 2031, at a CAGR of 4.78% during the forecast period (2026-2031). This expansion tracks the sector’s pivot from isolated mechanical evaluations toward end-to-end validation of software-defined vehicles, electrified powertrains, and connected-car ecosystems. Stricter UNECE R155 and R156 mandates have moved cybersecurity from single-event approval to continuous lifecycle oversight, creating stable demand for year-round compliance services. Providers able to blend physical testing with validated virtual simulations are capturing share as development cycles compress from 60–72 months to roughly 40 months. Outsourcing remains the dominant sourcing model because OEMs struggle to keep pace with the rising capital and talent requirements needed to test batteries, over-the-air (OTA) updates, and artificial-intelligence (AI) driving features.
Key Report Takeaways
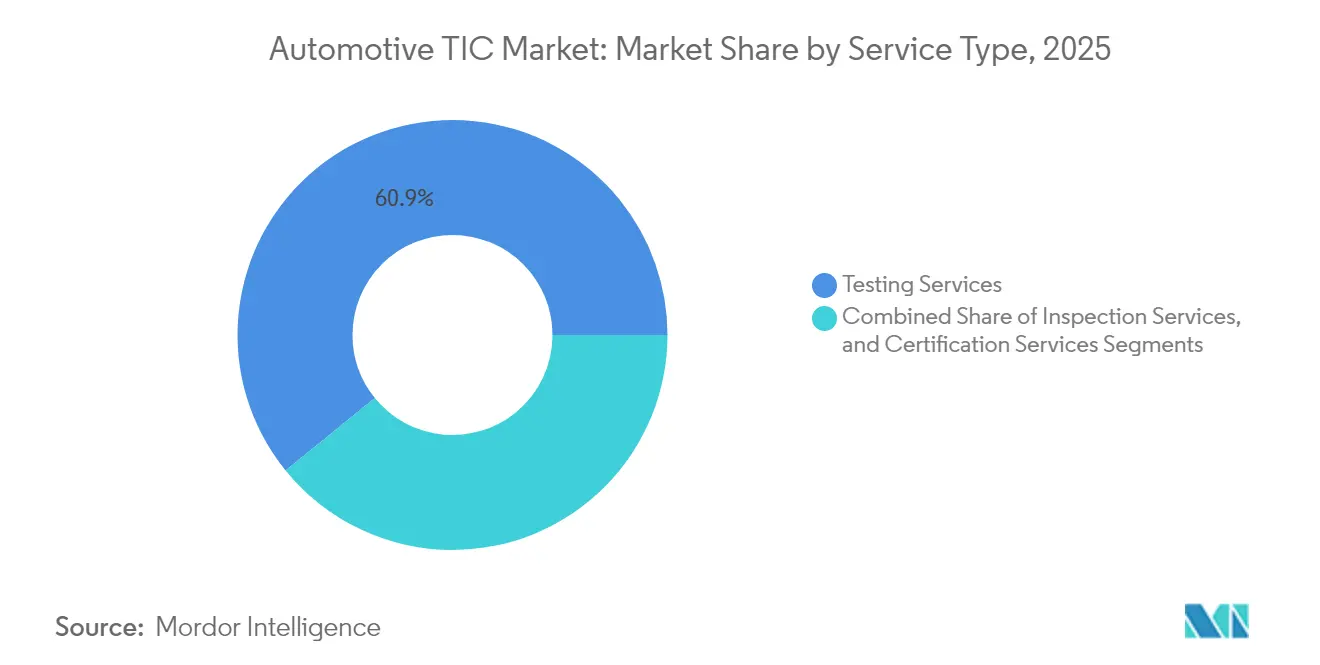
- By service type, testing accounted for 60.85% of the automotive testing, inspection, and certification market share in 2025, while certification is forecast to post the fastest 5.12% CAGR through 2031.
- By sourcing type, outsourced services commanded 74.62% of the automotive testing, inspection, and certification market size in 2025 and are projected to expand at a 4.83% CAGR to 2031.
- By geography, Asia-Pacific held 48.12% revenue share of the automotive testing, inspection, and certification market in 2025 and is set to register the highest 5.26% CAGR through 2031.
Note: Market size and forecast figures in this report are generated using Mordor Intelligence’s proprietary estimation framework, updated with the latest available data and insights as of 2026.
Global Automotive TIC Market Trends and Insights
Drivers Impact Analysis*
| Driver | (~) % Impact on CAGR Forecast | Geographic Relevance | Impact Timeline |
|---|---|---|---|
| Stricter UNECE and ISO Safety Mandates | +1.2% | Global, with the EU and Asia-Pacific leading implementation | Medium term (2-4 years) |
| Growing Outsourcing of Periodic Technical Inspection (PTI) | +0.8% | Europe and North America are primary, expanding to the Asia-Pacific | Short term (≤ 2 years) |
| Electrification Driving Battery and E-Powertrain Testing | +1.5% | Global, with China and the EU driving adoption | Long term (≥ 4 years) |
| Connected-Car Cyber-Security Compliance | +0.9% | North America and the EU core, spill-over to the Asia-Pacific | Medium term (2-4 years) |
| OTA Software-Update Validation Needs | +0.7% | Global, with premium segments leading | Short term (≤ 2 years) |
| Circular-Economy End-of-Life Certification | +0.4% | EU primary, expanding to developed markets | Long term (≥ 4 years) |
| Source: Mordor Intelligence | |||
Stricter UNECE and ISO Safety Mandates
UNECE R155 and R156, mandatory for new vehicle types since July 2024, require demonstrable cybersecurity management throughout a vehicle’s lifespan. SGS enlarged its portfolio to include ISO/SAE 21434 training and Common-Criteria evaluations across Germany, the Netherlands, and Singapore, enabling OEMs to meet these continuous-compliance expectations.[1]SGS Integrated Report 2024, “Corporate Profile,” SGS, sgs.com ISO 24089 revisions published in 2024 added tougher automated-driving validation, forcing manufacturers to test sensor fusion, decision algorithms, and human-machine-interface (HMI) performance under a single audit umbrella. Semiconductor suppliers responded quickly; multiple chipmakers achieved ISO 26262 ASIL-D in 2024, proving functional-safety standards now permeate the full supply chain. As a result, providers that can deliver integrated hardware, software, and cybersecurity assessments are winning multi-year contracts tied to model-series refresh cycles.
Growing Outsourcing of Periodic Technical Inspection (PTI)
Governments increasingly delegate PTI activities to specialized firms to access advanced test benches and data analytics platforms without public-sector capital outlay. DEKRA secured 61% of inspection lines in Guadalajara, Mexico, showing how scale and reputation sway public tenders.[2]“DEKRA to Launch Mexican Vehicle Inspection Facilities,” Automotive Testing Technology International, automotivetestingtechnologyinternational.com New PTI scopes now cover brake-particle emissions, battery health, and even cybersecurity checks. Fragmented inspection intervals-some EU nations mandate 12-month cycles while others stretch to 48 months—create opportunities for providers adept at tailoring services to divergent rules. Digital inspection portals enabling real-time data transfer to regulators give large TIC firms an edge, reinforcing the outsourcing trajectory.
Electrification Driving Battery and E-Powertrain Testing
Battery validation has become the fastest-growing revenue stream as regulations now demand thermal-runaway, cycle-life, and recycling-readiness tests. Stellantis’ EUR 4.1 billion (USD 4.63 billion) joint venture with CATL for LFP cell production in Spain requires tiered testing—from single-cell abuse tests to pack-level durability—in both prototype and mass-production phases. Hofer Powertrain’s launch of battery-swelling analysis underscores how electrochemical nuances push TIC expertise past traditional automotive know-how. Providers equipped for electromagnetic-compatibility (EMC) tests, DC-fast-charge validation, and grid-interaction studies offer integrated “one-stop” electrification suites, securing long-term framework agreements with global OEMs.
Connected-Car Cyber-Security Compliance
Cybersecurity testing shifted from optional to compulsory once UNECE R155 took effect. ENX Vehicle Cybersecurity audits now standardize supplier assessments, cutting redundant checks yet raising the baseline competency bar. Keysight’s lab in the Netherlands won technical-service approval in 2024, enlarging the roster of accredited facilities that can certify vehicle software-update processes. V2X modules, cloud gateways, and OTA patch managers must all pass penetration tests before type approval, turning cybersecurity validation into a recurring revenue stream each time firmware is updated. Semiconductor makers such as SK hynix acquired TISAX certification in 2025 to reassure automakers that memory chips meet data-protection criteria, illustrating how cyber-compliance now spans the entire supply chain.
Restraints Impact Analysis*
| Restraint | (~) % Impact on CAGR Forecast | Geographic Relevance | Impact Timeline |
|---|---|---|---|
| High Cost and Time-to-Market of Homologation | -0.9% | Global, with emerging markets most affected | Medium term (2-4 years) |
| Fragmented Country-Level PTI Regulations | -0.6% | Europe is primary expanding globally | Long term (≥ 4 years) |
| Shortage of EV-Qualified Test Engineers | -0.8% | Global, with Asia-Pacific and North America most impacted | Short term (≤ 2 years) |
| Ethical-AI Audit Gaps for Autonomous Systems | -0.4% | North America and the EU are leading, with limited Asia-Pacific adoption | Long term (≥ 4 years) |
| Source: Mordor Intelligence | |||
High Cost and Time-to-Market of Homologation
Divergent U.S. CARB, Euro 7, and Chinese GB standards force OEMs to run parallel validation cycles for identical subsystems. TÜV NORD reports that multiplying rules for pollutant limits, battery durability, and driver-assist functions inflate homologation budgets and add months to launch schedules. Stellantis faced investigations over Opel models that triggered retesting and retrofit campaigns, highlighting reputational exposure when rules are misinterpreted.[3]Stellantis N.V., “Annual Report 2024,” stellantis.com Small suppliers feel the pinch most; certification fees can exceed 10% of annual revenue for niche component makers. The push toward multi-energy platforms intensifies the burden because each propulsion type must satisfy distinct test matrices without cross-credit among regulators.
Fragmented Country-Level PTI Regulations
Lack of harmonization across Europe keeps inspection-interval policies locked in national silos. Vehicles moving from a 12-month jurisdiction to a 48-month one may face redundant checks without measurable safety benefit, undercutting economies of scale for pan-European TIC networks. Each authority mandates its own accreditation path, equipment calibration, and inspector-licensing criteria, driving up compliance costs for service providers. The European Commission’s proposals for uniform PTI standards meet resistance from member states guarding sovereignty, prolonging uncertainty. Until convergence occurs, investors hesitate to fund continent-wide inspection-station upgrades, curbing modernization of brake-particle and battery-health test rigs.
*Our forecasts treat driver/restraint impacts as directional, not additive. The impact forecasts reflect baseline growth, mix effects, and variable interactions.
Segment Analysis
By Service Type: Testing Dominates, Certification Accelerates
Testing held a 60.85% share of the automotive testing, inspection, and certification market in 2025, reflecting its indispensability for validating hardware durability, EMI resilience, and safety-critical software. Continued demand for full-vehicle crash tests, battery thermal-runaway chambers, and vehicle-in-the-loop (VIL) simulations anchors the segment’s scale advantage. Certification, though smaller, is growing fastest at 5.12% CAGR because UNECE R155/R156 obligate OEMs to prove cybersecurity and software-update competence before any new model is registered. Each mandatory certificate unlocks downstream testing contracts for periodic audits and OTA re-approvals.
Digital-twin adoption is reshaping revenue composition. dSPACE’s AURELION platform enables Mercedes-Benz to perform sensor-realistic driving scenario validation that regulators accept as equivalent to road miles. Such simulation reduces physical-prototype counts, but it does not diminish testing volume; instead, it shifts spend to high-performance computing clusters and data-validation services. Providers pairing track facilities with certified simulation suites secure multi-phase bookings covering concept, design, and homologation. The automotive testing, inspection, and certification market size tied to software-driven validation is set to widen as developers ask regulators to credit virtual kilometers toward compliance targets.



By Sourcing Type: Outsourcing Momentum Intensifies
Outsourced contracts accounted for 74.62% of the automotive testing, inspection, and certification market size in 2025 and are forecast to expand at a 4.83% CAGR through 2031. OEMs offload specialized tasks—battery nail-penetration, 5G V2X conformance, penetration testing—to avoid capital outlays on single-use rigs and to access scarce talent. In-house labs remain relevant for early-stage R&D where IP sensitivity is high, yet budget constraints and headcount freezes push even proprietary testing outside corporate walls once concept feasibility is proven.
Investor sentiment validates the trend. Spectris’s USD 630 million takeover of Micromeritics in 2024 signaled confidence in materials characterization demand, while FEV continued opening benchmark centers to serve powertrain clients. Predictive-maintenance programs lengthen equipment life at commercial test centers, allowing price structures that undercut internal labs. As regulatory files grow thicker—each Euro 7 prototype requires up to 20 GB of test data—providers able to manage secure data lakes and generate audit-ready dashboards earn preferred-supplier status in global sourcing rosters.
Geography Analysis
Asia-Pacific’s 48.12% share in 2025 and 5.26% CAGR through 2031 confirm the region as the gravitational center of the automotive testing, inspection, and certification market. China’s mandate for enhanced tyre and lighting standards, couples with the world’s highest electric-vehicle adoption, is funneling battery-pack and EMC validation work to domestic TIC zones. India’s NATRAX alliance with TÜV SÜD has cut lead times for ADAS and electromagnetic-compatibility tests, supporting the country’s surge in compact SUV exports. Japan’s advanced autonomous-drive pilots and South Korea’s prominence in automotive semiconductors add layers of software and memory-device certification volume. Yet regulatory harmonization remains modest; labs must hold discrete accreditations for GB, AIS, and J-type standards, reinforcing multiyear project bookings for globally connected providers.
Europe sustains significant weight thanks to rule-making leadership. Euro 7 emissions ceilings and circular-economy directives keep demand robust for powertrain durability, battery recycling, and end-of-life dismantling audits. The region houses dense networks of TÜV, SGS, and Bureau Veritas facilities that possess deep regulators’ trust. Eastern European nations attract new lab investments as cost-effective alternatives to legacy Western European sites, while Brexit complications channel additional certification runs to continental labs. Continued refinement of UNECE and ISO standards ensures steady revenue even as light-vehicle sales stagnate.
North America concentrates on autonomous-vehicle and cybersecurity validations. DEKRA’s USD 22.8 million Michigan expansion in 2024 added climatic chambers and 5G test bays to serve a pipeline of vehicle-software overhauls. U.S. federal and California CARB rules seldom align perfectly, so manufacturers rely on TIC firms to separate and manage dual-path programs. Mexico’s rising role as a manufacturing hub generates cross-border testing demand, especially for NAFTA-compliant emissions and safety certifications. South America and the Middle East, and Africa show emerging, if uneven, promise. Brazil’s PROCONVE L7 and L8 standards increase local powertrain testing needs, while Gulf countries invest in inspection centers tied to growing passenger-car fleets. Infrastructure gaps and technician shortages temper growth but also create first-mover advantages for global providers that partner with local governments.


Regulatory Landscape
Global automotive TIC demand is anchored by a mix of harmonized UN rules and region-specific type-approval and in-service inspection requirements. UNECE WP.29 cybersecurity and software update regulations (R155 and R156) have moved compliance toward lifecycle governance and periodic evidence refresh, while the Global Innovation Dialogues (GID) framework under WP.29 continues to shape how automated-driving functions are assessed across member markets. In June 2026, WP.29 discussions covered proposals spanning Automated Driving Systems (ADS), liquid hydrogen, and tyre abrasion, reinforcing the need for multi-domain labs that can cover safety, energy-storage, and emerging non-exhaust emissions topics under a single compliance roadmap.
In the European Union, the Motor Vehicle Type-Approval Framework (Regulation (EU) 2018/858) remains the core regime, with policy work in 2026 focused on lowering compliance friction through wider acceptance of virtual testing and risk-based approaches. Alongside this, the EU automotive industrial action plan published in March 2025 targeted regulatory simplification to improve coherence across standards, which influences how OEMs structure homologation test plans and how TIC providers package cross-regulation evidence dossiers. Across Asia, enforcement of UNECE-aligned cybersecurity and software-update requirements in markets such as Japan and South Korea further increases the need for accredited facilities that can support both initial approval and ongoing audit cycles.
Value Chain Analysis
The automotive TIC value chain starts upstream with standards-setting and conformity-assessment frameworks (e.g., UNECE WP.29 regulations and ISO-based management systems), flows through OEM and tier supplier design validation, and then into accredited laboratory testing, inspection operations, and certification issuance. As vehicles become software-defined, the chain increasingly connects physical proving (EMC, durability, crash, and battery abuse) with cybersecurity and software-update governance, where evidence packages are continuously updated rather than assembled only at SOP and type approval. This shift increases the importance of secure data handling and repeatable test artifacts, including scenario libraries and controlled OTA validation routines.
Downstream, recurring revenue is reinforced by periodic technical inspection (PTI) outsourcing and re-assessment cycles tied to software releases and supplier assurance programs. Large TIC groups such as SGS, Bureau Veritas, and Intertek are extending beyond classic component and vehicle testing into supply-chain verification (for example, analytical methods used to verify recycled polymer content) and digital trust services, which link material traceability, manufacturing quality audits, and information-security assessments into a single compliance narrative. Digital certification portals and remote witnessing also tighten feedback loops between regulators, laboratories, and OEM engineering teams, shortening approval handoffs while increasing the volume and frequency of auditable documentation.
Competitive Landscape
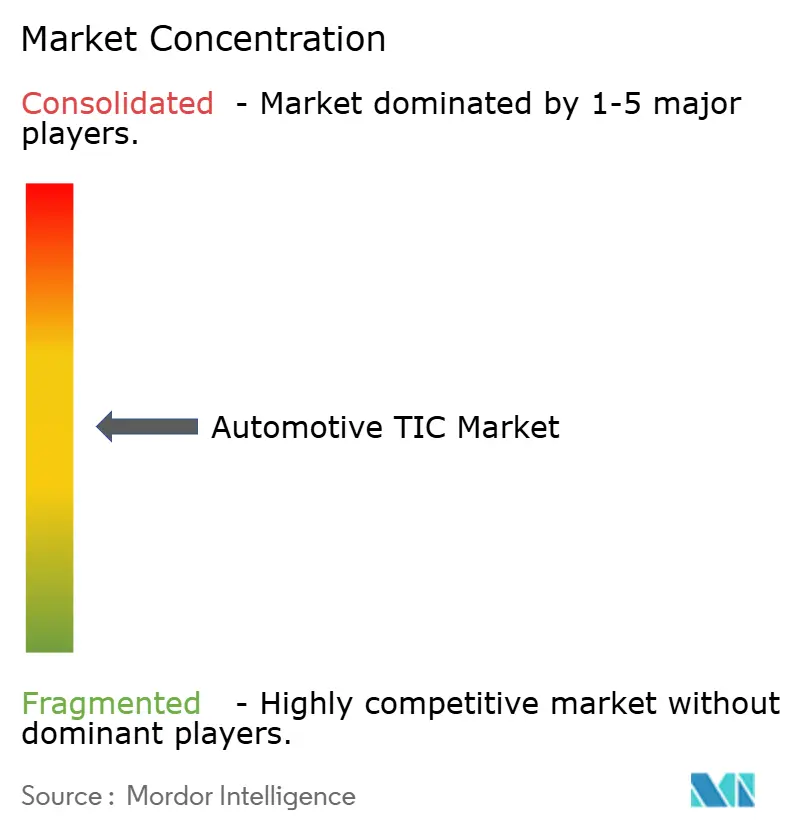
The automotive testing, inspection, and certification market remains moderately fragmented. Global majors such as SGS, Bureau Veritas, TÜV SÜD, TÜV Rheinland, and Intertek defend their share through dense lab networks, multi-standard accreditations, and deep regulator rapport. SGS operated 2,500 laboratories across 115 nations and 99,500 staff in 2024, reflecting a scale that smaller entrants struggle to replicate. Midsize specialists thrive by focusing on fast-growing niches: battery-abuse testing, ADAS sensor calibration, and V2X conformance. Emerging EV-centric players in China and Europe leverage government subsidies to install high-energy cyclers and thermal-shock chambers within new-energy-vehicle clusters.
Technology partnerships are becoming decisive. Continental aligned with Synopsys to embed vehicle digital twins that cut validation time for software releases.[4]Continental, “Vehicle Digital Twin Cooperation with Synopsys,” continental.com TÜV SÜD collaborates with cloud-simulation vendors to certify scenario libraries acceptable to regulators. Providers racing to integrate virtual and physical test-beds can match the software iteration cadence of modern vehicle programs, winning renewal contracts tied to OTA pipelines rather than model launches.
Price competition remains moderate because accreditations and safety stakes raise switching costs. Yet talent scarcity—especially battery chemists and ethical-AI auditors—raises wage bills across the board. Companies are countering by establishing joint academies with universities and offering remote-testing portals that let OEM engineers watch test runs online, reducing travel expenditure and reinforcing client lock-in.
Automotive TIC Industry Leaders
SGS SA
Bureau Veritas SA
Intertek Group plc
TÜV SÜD AG
TÜV Rheinland AG
- *Disclaimer: Major Players sorted in no particular order

Market Opportunities and Future Outlook
White-space is opening around lifecycle compliance packages that bundle UNECE R155/R156 evidence management with OTA release validation and supplier assurance, because cybersecurity and software-update compliance is now treated as an ongoing operational obligation rather than a one-time approval hurdle. Recent market actions underline this shift: SGS expanded digital-trust capabilities via its Granite River Labs Services (GRL) acquisition and broadened its ability to validate high-speed wired data connections that sit at the center of in-vehicle networks and connected-car architectures. As OEMs compress development cycles and increase software iteration cadence, vendors that can combine accredited test execution with audit-ready data governance gain leverage in multi-year framework agreements.
A second opportunity cluster is tied to electrification and circular-economy verification, where battery validation expands from safety to durability, recycling-readiness, and materials traceability. The Stellantis and CATL LFP cell joint venture in Spain highlights how gigafactory-linked ecosystems require multiple layers of verification, from incoming materials and process audits through cell and pack test regimes. In parallel, supply-chain claims around recycled content and sustainability compliance are pulling TIC providers into advanced materials testing and chain-of-custody audit work, exemplified by SGS activity supporting recycled-materials verification for automotive. Providers that link materials analytics, factory surveillance, and product compliance documentation into a single deliverable can address OEM procurement needs while reducing duplicated assessments across tiers.
Recent Industry Developments
- July 2026: SGS TISAX approval for its Pune Chakan laboratory in India. The approval adds data security credibility for automotive testing in the facility, elevating trust among OEMs and suppliers. This strengthens SGS's India testing network with cybersecurity credibility across OEMs and suppliers.
- May 2026: SGS Official approval from Changan Automobile to serve as a third-party laboratory for passenger vehicle testing across its Thai laboratory network. The move reinforces Changan's testing reliance in Thailand and supports broader compliance ecosystems. Expands regional testing footprint and accelerates testing throughput in Southeast Asia.
- March 2026: SGS acquired Granite River Labs Services GRL to broaden capabilities in high-speed wired data validation. The acquisition expands the scope of digital infrastructure validation for complex vehicle systems. Enhances test coverage for connected and software-defined vehicles through advanced lab capabilities.


Research Methodology Framework and Report Scope
Market Definition and Coverage
For this study, the market covers revenues earned from automotive testing, inspection, and certification services that validate vehicles, systems, and components against safety, quality, and regulatory requirements across major regions.
Scope exclusions: The model excludes pure automotive repair and maintenance labor, routine dealership servicing, and standalone sales of test equipment when it is not bundled as a service.
Segmentation Overview
- By Service Type
- Testing Services
- Inspection Services
- Certification Services
- By Sourcing Type
- In-house
- Outsourced
- By Geography
- North America
- United States
- Canada
- Mexico
- South America
- Brazil
- Argentina
- Rest of South America
- Europe
- Germany
- United Kingdom
- France
- Italy
- Spain
- Rest of Europe
- Asia-Pacific
- China
- Japan
- India
- South Korea
- South-East Asia
- Rest of Asia-Pacific
- Middle East and Africa
- Middle East
- Saudi Arabia
- United Arab Emirates
- Turkey
- Rest of Middle East
- Africa
- South Africa
- Nigeria
- Rest of Africa
- Middle East
- North America
Data Sources, Market Sizing, and Validation
Desk Research
Desk research started with public rulebooks and compliance signals that explain why testing and certification volumes rise or fall over time. We referred to sources such as UNECE regulations and updates, US NHTSA rules and recall data, the European Commission mobility and type approval information, and ISO and IEC standards that shape lab and audit requirements.
To anchor demand and activity, we also used automotive production and registration statistics from sources such as OICA, along with customs and trade statistics that help cross-check component flows linked to homologation and validation needs. Company filings, investor presentations, accreditation body publications, and reputable press were used to understand service mix shifts such as EV battery testing and cybersecurity checks. Where required, paid subscriptions were used for company financials and intelligence, shipment-level trade views, and patent databases to confirm technology direction. The sources named above are illustrative and not exhaustive, and many other public and paid references were used for collection, validation, and research clarification.
Primary Interviews and Surveys
Primary work focused on interviews and short surveys with lab operators, compliance heads, quality leaders, and procurement teams involved in outsourced TIC buying, plus input from OEM and supplier engineering groups. Because this is a global market, we balanced respondents across key auto production hubs so assumptions on service pricing, utilization, and outsourcing intensity could be checked and corrected as needed.
Distribution of primary research fieldwork respondents
| Company type | Respondent position | Region |
|---|---|---|
| Top tier: 33% | CXOs: 14% | APAC: 49% |
| Mid tier: 53% | Functional/Unit leaders: 33% | EMEA: 30% |
| Smaller Players: 14% | Managers: 53% | Americas: 21% |
Market-Sizing & Forecasting
Sizing begins with a top-down build that reconstructs the addressable service pool using automotive production, regulatory testing intensity, and outsourcing penetration by region. These quantities are then converted into annual value using observed service pricing bands. To keep totals practical, we corroborated them with selective bottom-up checks, including sampled provider revenue ranges, capacity utilization logic for major test categories, and ASP times volume approximations for common programs.
Key inputs included vehicle production and model change cycles, EV and hybrid mix (which increases battery and high-voltage testing needs), cybersecurity and software compliance activity tied to UNECE R155 and R156, recall and defect trends that raise validation workload, and the share of outsourced versus in-house testing. Pricing relied on service-specific ASP ladders, with the assumed uplift linked to mix shift toward advanced domains rather than a flat inflation add-on.
Forecasting relied mainly on scenario analysis. We stress production outlook, regulatory cadence, and technology adoption in a base, conservative, and faster-compliance case. Where bottom-up signals were thin in smaller countries, we used proxy ratios from similar manufacturing hubs and then adjusted them using interview feedback so gaps did not distort the global total.
Data Validation & Update Cycle
Validation is performed through multiple checks so unusual jumps are questioned before numbers are finalized. We compare outputs against independent signals such as vehicle production trends, regulatory enforcement milestones, and observed shifts in outsourcing behavior, and then run a second pass to test whether pricing and volume assumptions still align with interview inputs.
If a large variance shows up by region or by service type, the model is revisited and a small set of experts is re-contacted to confirm whether the change is structural or temporary. Reports are refreshed annually, with interim updates when material events occur that can move demand or pricing. Before delivery, an analyst runs a fresh review so clients receive the latest updated view.
Mordor Intelligence's Testing Inspection and Certification Market for Automotive Market Estimate Compared With Other Published Estimates
Published values for automotive TIC often differ because each publisher sets its own service boundary and timing, and the market itself is changing as EV and software compliance work becomes more recurring. Differences can also come from how local currency revenues are translated into USD, and whether pricing is treated as a flat uplift or rebuilt from service mix and program volumes.
Refresh cadence and currency timing are usually the first reasons totals drift. A newer pricing check can lift advanced testing ASPs even when the underlying volume outlook looks similar. A second driver is whether recurring UNECE R155 and R156 related cybersecurity and software update validation is counted as ongoing services, or treated as one-time homologation work. These checks are re-run when assumptions change in Mordor Intelligence.
Benchmark comparison
| Source | Market Size | Gaps in Research Methodology |
|---|---|---|
| Mordor Intelligence | USD 21.28 B (2026) | |
| Industry Data Publisher A | USD 23.22 B (2024) | Uses an earlier base year and can include adjacent technical inspection activities that are not always tied to regulated testing programs, and the faster CAGR suggests a more aggressive pricing and mix uplift assumption. |
| Business Research Publisher B | USD 21.17 B (2024) | Build appears to lean on a broader services bucket with simpler ASP progression, and the lower near-term CAGR implies a more conservative uptake for EV and software compliance driven testing volumes. |
The comparison shows that timing, scope boundaries, and price build-up methods can move the headline number even when the same industry is discussed. Our approach keeps the total traceable to demand drivers like production, compliance workload, and outsourcing share, and then it is cross-checked with pricing bands so the steps can be repeated and reviewed.


Key Questions Answered in the Report
What is the current size of the automotive TIC market and its growth outlook?
The automotive TIC market stands at USD 21.28 billion in 2026 and is projected to reach USD 26.86 billion by 2031, reflecting a 4.78% CAGR.
Which region leads the automotive TIC market and which grows fastest?
Asia-Pacific holds the largest 48.12% share, while Asia-Pacific posts the fastest 5.26% CAGR through 2031.
Which service segment is expanding most rapidly in the automotive TIC market?
Certification services show the strongest momentum, advancing at a 5.12% CAGR as electric and autonomous vehicles increase regulatory complexity.
Why are OEMs increasing outsourcing of automotive TIC services?
Specialized battery, hydrogen and cybersecurity tests require costly infrastructure and expertise, prompting OEMs to outsource work that is non-core yet compliance-critical.
How do new cybersecurity regulations influence demand in the automotive TIC market?
UNECE R155/R156 rules mandate lifecycle cybersecurity certification, turning one-time tests into recurring validation programs and generating steady revenue for TIC providers.
What drives the surge in battery testing within the automotive TIC market?
Stricter safety rules such as China’s “No Fire, No Explosion” standard and global fast-charging adoption elevate demand for advanced thermal-runaway and abuse testing.
Page last updated on:


 Your data is secure and never sold or shared.


