
Delivery Drones Market Size and Share
Market Overview
| Study Period | 2019 - 2031 |
|---|---|
| Market Size (2026) | USD 1.47 Billion |
| Market Size (2031) | USD 6.74 Billion |
| Growth Rate (2026 - 2031) | 35.69 % |
| Fastest Growing Market | Asia Pacific |
| Largest Market | North America |
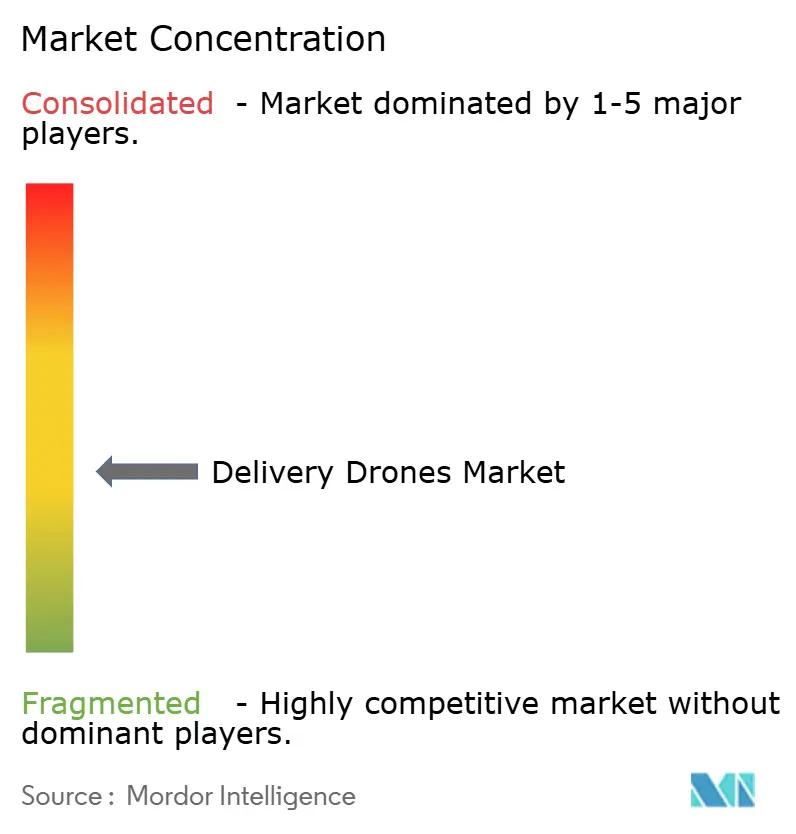
| Market Concentration | Medium |
Major Players *Disclaimer: Major Players sorted in no particular order Image © Mordor Intelligence. Reuse requires attribution under CC BY 4.0. | |
Delivery Drones Market Analysis by Mordor Intelligence
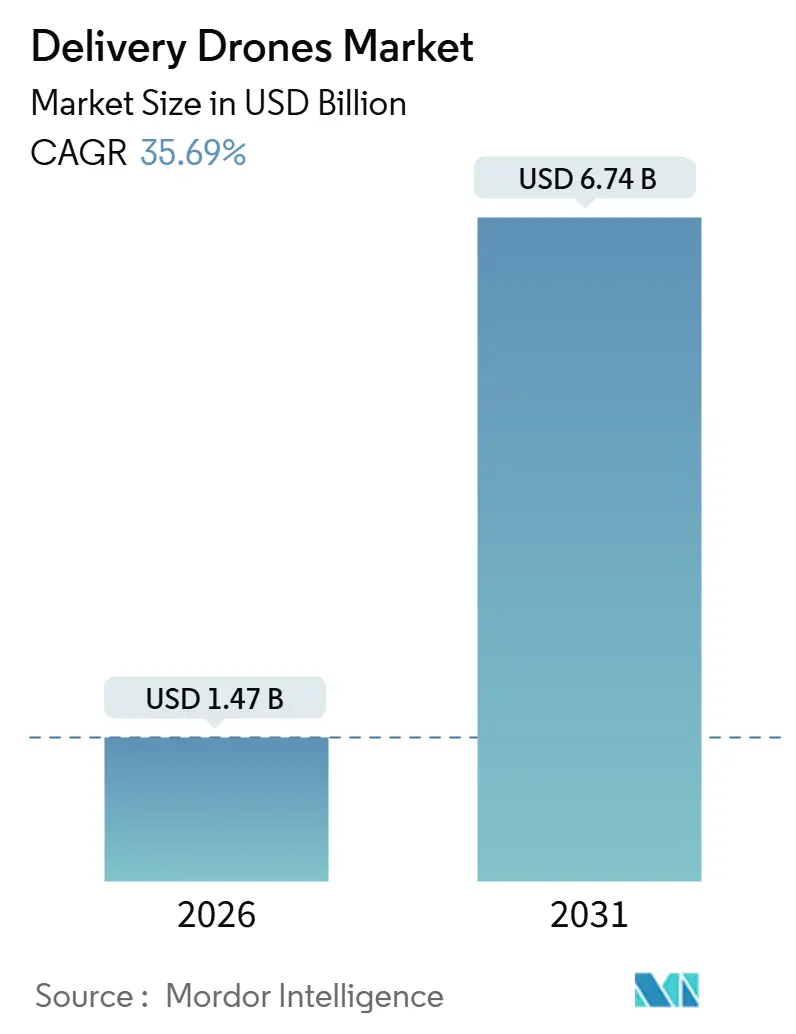
The delivery drones market size reached USD 1.47 billion in 2026 and is projected to attain USD 6.74 billion by 2031, expanding at a 35.69% CAGR through the forecast period. Rapid progress in beyond-visual-line-of-sight regulations, demand for same-day fulfillment, and hybrid VTOL innovations together accelerate adoption across retail, healthcare, and industrial corridors. Rotary-wing craft currently dominate dense urban routes, yet long-range fixed-wing systems are scaling in rural networks where ground logistics remain inefficient. Capital inflows from retailers, express parcel incumbents, and venture investors are shrinking experimentation cycles and prompting operators to deploy in multiple cities. At the same time, airspace-integration bottlenecks and payload limits concentrate expansion among well-capitalized firms that can absorb certification costs.
Key Report Takeaways
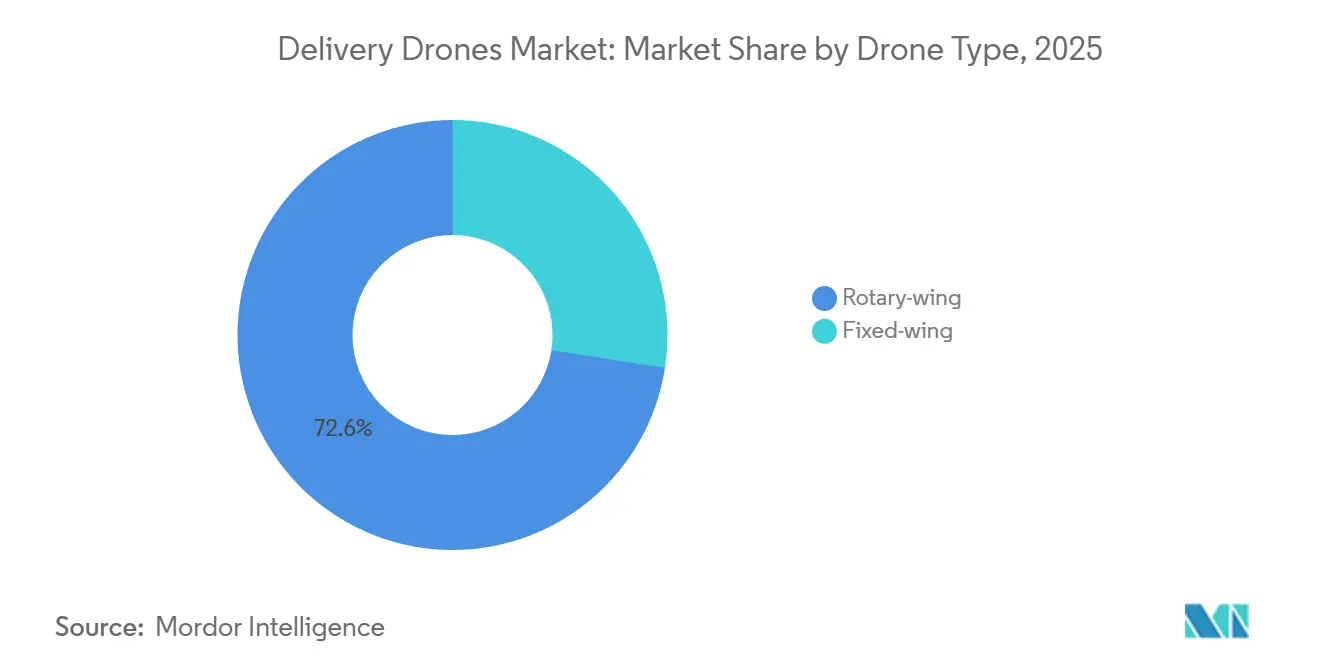
- By drone type, rotary-wing platforms led with 72.56% revenue share in 2025, while fixed-wing systems are forecasted to grow at a 29.15% CAGR between 2026 and 2031.
- By payload capacity, units under 5 kg accounted for 65.71% share of the delivery drone market size in 2025; drones exceeding 10 kg are poised to expand at 31.9% CAGR to 2031.
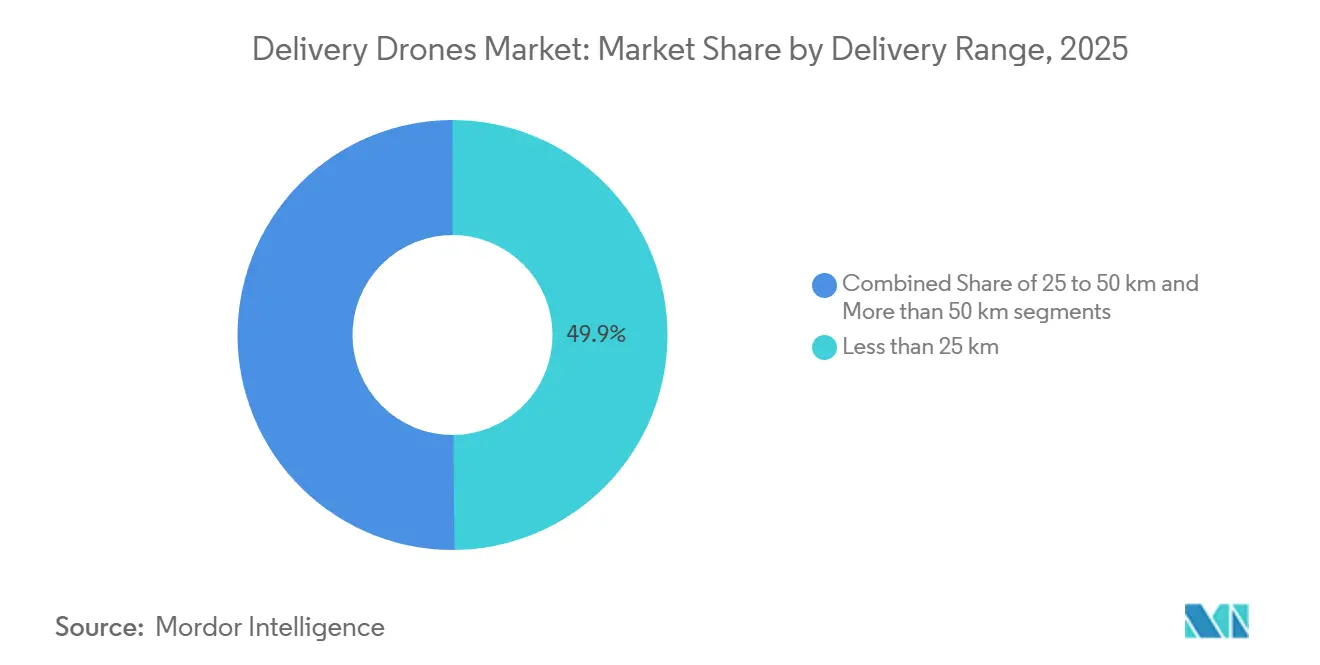
- By delivery range, missions under 25 km captured 49.85% share in 2025, whereas flights beyond 50 km are set to advance at 29.5% CAGR through 2031.
- By end-user, retail and e-commerce accounted for 51.83% of demand in 2025; healthcare and pharma logistics are expected to grow at a 28.35% CAGR through 2031.
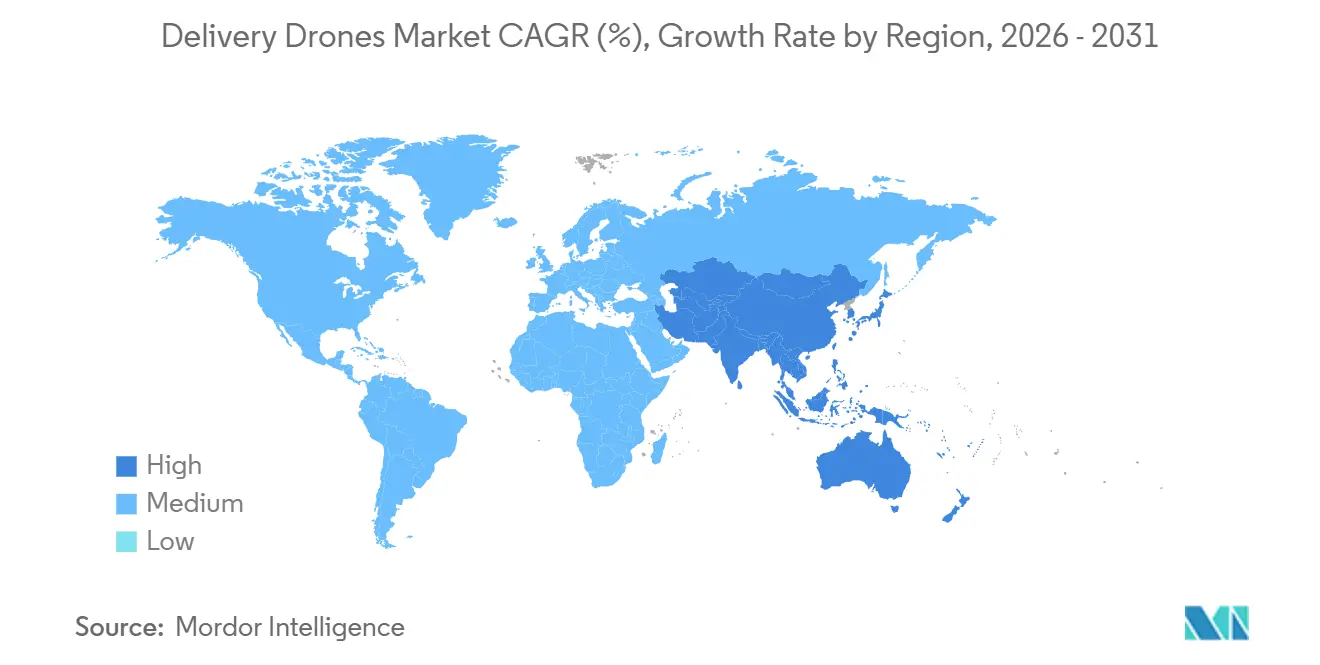
- By geography, North America accounted for 42.84% of the revenue in 2025, while the Asia-Pacific region is projected to grow at a 33.68% CAGR through 2031.
Note: Market size and forecast figures in this report are generated using Mordor Intelligence’s proprietary estimation framework, updated with the latest available data and insights as of January 2026.
Market Trends and Insights
Drivers Impact Analysis of Delivery Drones Market*
| Driver | (~) % Impact on CAGR Forecast | Geographic Relevance | Impact Timeline |
|---|---|---|---|
| Accelerating demand for same-day e-commerce fulfillment in densely populated urban centers | +8.2% | Global; especially North America and APAC | Short term (≤ 2 years) |
| Rising need for reliable healthcare delivery solutions in geographically isolated and underserved areas | +7.1% | MEA and rural APAC | Medium term (2-4 years) |
| Global expansion of regulatory frameworks enabling commercial delivery drone operations | +6.8% | North America and Europe | Medium term (2-4 years) |
| Operational cost reductions through more efficient last-mile delivery in high-traffic environments | +5.9% | Global, urban focus | Long term (≥ 4 years) |
| Increased adoption of sustainable logistics practices driven by corporate and government emissions targets | +4.4% | Global, EU and North America leading | Long term (≥ 4 years) |
| Technological advancements in hybrid VTOL systems enabling longer-range and more flexible delivery missions | +6.7% | Global | Medium term (2-4 years) |
| Source: Mordor Intelligence | |||
Accelerating Demand for Same-Day E-Commerce Fulfillment in Densely Populated Urban Centers
Urban consumers increasingly expect delivery within two hours, a benchmark that ground fleets miss during peak congestion. Drones avoid surface traffic, allowing retailers to ship from micro-fulfillment hubs located near downtown districts. The growing adoption of drones for last-mile parcel transportation is also driving expansion of the drone package delivery market, particularly as retailers seek faster and more cost-efficient fulfillment options. Walmart expanded its Wing Aviation program to 100 US stores in June 2025, indicating that aerial logistics has transitioned from a trial to a core service.[1]Walmart Inc., “Walmart Corporate News,” walmart.com Unit economics improve as parcel costs fall toward USD 2 once fleet density reaches scale, compared with USD 13.50 for truck-based last-mile routes.[2]McKinsey & Company, “The Future of Last-Mile Delivery,” mckinsey.com Labor shortages amplify this advantage, especially in North American and European cities where wages remain high. As a result, the delivery drones market is integrating deeply into omnichannel retail strategies to safeguard customer loyalty.
Rising Need for Reliable Healthcare Delivery Solutions in Geographically Isolated and Underserved Areas
Road gaps delay life-critical supplies for rural clinics, so health systems turn to medical drones for predictable, rapid service. Zipline surpassed 1 million autonomous flights, moving blood and vaccines across Rwanda, Ghana, and remote US counties.[3]Zipline International, “Zipline Drone Delivery Platform,” flyzipline.com A 2025 partnership with the Cleveland Clinic reduced prescription lead times from hours to minutes for patients in suburban Ohio. India designated dedicated corridors for medical payloads under its Drone Rules, accelerating adoption in hard-to-reach districts.[4]Ministry of Civil Aviation India, “Drone Rules and Regulations,” civilaviation.gov.in These programs demonstrate that drones can leapfrog limited road infrastructure, thereby reinforcing growth prospects for the delivery drones market across emerging economies.
Global Expansion of Regulatory Frameworks Enabling Commercial Delivery Drone Operations
Regulators are shifting from ad-hoc waivers to standardized certificates, cutting entry hurdles. The FAA approved DroneUp for Part 135 operations in December 2024, permitting routine beyond-visual-line-of-sight flights. EASA’s certified category, finalized in 2024, provides clear airworthiness rules that mirror the requirements of manned aviation. China’s Civil Aviation Administration (CAA) opened over 200 fixed routes for JD Logistics, integrating unmanned missions into controlled airspace. Harmonized standards shorten go-to-market cycles, enabling operators to scale fleets across multiple countries.
Operational Cost Reductions Through More Efficient Last-Mile Delivery in High-Traffic Environments
Last-mile activities account for 41% of logistics spending, and urban congestion exacerbates fuel and labor costs. Drones eliminate curbside parking fines and idling time by flying directly to customer yards. PwC projects that costs could dip to USD 2 per parcel once automation matures, beating traditional courier economics even after accounting for battery depreciation. DoorDash’s Wing Aviation roll-out in Virginia and North Carolina during 2025 underscores the margin upside for food-service brands in sprawling suburbs. Lower variable costs translate into price competitiveness, supporting the expansion of the delivery drones market across various service verticals.
Restraints Impact Analysis of Delivery Drones Market*
| Restraint | (~) % Impact on CAGR Forecast | Geographic Relevance | Impact Timeline |
|---|---|---|---|
| Complex airspace integration with existing civil aviation systems limiting operational scalability | -4.8% | Dense airspace regions worldwide | Medium term (2-4 years) |
| Low payload capacity restricting revenue potential in high-volume delivery segments | -3.9% | Global | Short term (≤ 2 years) |
| Persistent public concerns over privacy and noise in densely populated residential areas | -2.7% | Global, urban focus | Long term (≥ 4 years) |
| High upfront fleet investment requirements posing barriers for small and medium-sized enterprises | -3.1% | Global, emerging markets impact | Medium term (2-4 years) |
| Source: Mordor Intelligence | |||
Complex Airspace Integration with Existing Civil Aviation Systems Limiting Operational Scalability
Unmanned traffic management remains in pilot testing, constraining route density near busy airports. The FAA’s concept of dynamic flight corridors still lacks full interoperability with manned aircraft systems, forcing operators to throttle frequency in metropolitan skies. EASA’s U-space rules require geofencing and mandatory collision-avoidance protocols; however, adoption rates differ across member states, resulting in fragmented service design. NASA research indicates that current algorithms can handle only hundreds, not thousands, of simultaneous drone flights. Until scalable UTM networks mature, the growth of the delivery drone market in densely populated regions will lag behind its technical potential.
Low Payload Capacity Restricting Revenue Potential in High-Volume Segments
Most commercial drones weigh under 5 kg, which prevents the cost-effective transport of bulk grocery baskets or consumer electronics. DJI’s FlyCart 30 lifts a 30 kg payload, yet sacrifices endurance for weight, limiting its flight radius. Wingcopter 198 balances a 6 kg payload with 75 km range but remains a niche healthcare solution. Without breakthroughs in battery density or hybrid propulsion, revenue per sortie stays capped, tempering the broader delivery drone industry outlook.
*Our forecasts treat driver/restraint impacts as directional, not additive. The impact forecasts reflect baseline growth, mix effects, and variable interactions.
Delivery Drones Market Segment Analysis
By Drone Type:
Fixed-Wing Platforms Extend Reach and Lower Unit CostsRotary-wing craft delivered 72.56% of shipments in 2025. They excel where rooftops double as drop zones and curbside space is scarce. Yet, fixed-wing systems, projected to grow at a 29.15% annual rate, glide during cruise, slashing energy use per kilometer. Zipline’s P2 travels 100 km on a single charge, allowing operators to serve multiple counties from a single hub. This range economy is critical in Asia-Pacific’s patchy transport grid, where JD Logistics uses fixed-wing drones on 200 rural routes. Regulatory bodies are now funneling Part 135 approvals toward designs that combine long endurance and automated detect-and-avoid capabilities. Consequently, the delivery drones market is tilting toward hybrid craft that merge rotary lift with fixed-wing cruise, narrowing the operational gap between city blocks and distant clinics.
Fixed-wing expansion reshapes fleet-planning math. Operators can retire several short-hop bases and instead run a single centralized launch site. This consolidation frees capital for route density and value-added services such as cold-chain pods for vaccines. Rotary-wing models still dominate instant restaurant delivery and under-15-minute urban promises, so adoption becomes a portfolio decision rather than a binary switch. Future platform roadmaps incorporate modular wings that detach for pure hover missions, indicating an adaptable architecture that flexes with demand spikes across the delivery drones market.



By Payload Capacity:
Light Parcels Prevail While Heavy-Lift Applications EmergeShipments under 5 kg held a 65.71% share in 2025, aligning with prescriptions, meal kits, and small consumer goods that fit within standard wing lockers. Fleet managers favor this class because batteries, control logic, and drop mechanisms are off-the-shelf, and they satisfy most aviation authorities without requiring lengthy proof-of-concept phases. The 5-10 kg band grows as grocery chains experiment with mid-basket orders and as regulations mature around packaging standards. Drones weighing above 10 kg will advance at a 31.9% CAGR, albeit from a lower base, serving offshore rigs or construction sites where helicopters have historically dominated.
Engineering trade-offs remain stark. Every additional kilogram reduces flight time unless energy density increases. Hybrid gasoline-electric prototypes promise relief, although certification timelines are stretched longer. Heavy-lift niches therefore charge a premium for their services, covering higher maintenance and risk insurance costs. Over time, as powertrain efficiency improves, weight ceilings will climb, setting the stage for broader heavy-lift adoption throughout the delivery drones market.
By Delivery Range:
Long-Distance Routes Reduce Hub Counts in Sparse RegionsRoutes under 25 km made up 49.85% of 2025 sorties. They suit metropolitan footprints where customer density allows a single drone to complete several cycles per hour. The 25–50 km bracket encompasses peri-urban fringes where ground vans experience reduced efficiency. Flights over 50 km will accelerate at a rate of 29.50% annually as health ministries and energy firms link widely scattered sites. Zipline’s hub-and-spoke layouts in Rwanda reduce supply chain nodes by up to 80%, a savings that can be applied to parts of Latin America and Southeast Asia.
Long-range missions require redundant satellite communications (satcom) links, ADS-B transponders, and automated failsafe landings to meet Part 135 and EASA-certified category rules. Operators that meet these benchmarks gain a lasting moat, as licensors rarely award overlapping routes in the same corridor. This competitive lock-in reinforces revenue visibility and underscores why the delivery drones market rewards early movers who secure long-distance certifications.
By End-User Industry:
Healthcare Sets the Pace for High-Value GrowthRetail and e-commerce generated 51.83% of flight volume in 2025, driven by shoppers' increasing demand for two-hour delivery windows. Still, healthcare is expected to log a 28.35% CAGR through 2031, reflecting a greater willingness to pay for urgency and chain-of-custody assurances. Zipline entered the US prescription delivery market with Walmart Health, an endorsement that catalyzes payers and providers in their pursuit of lower readmission rates. Food and grocery operators such as Manna focus on suburban clusters where restaurant density offsets lower ticket values. Industrial buyers, from oil majors to mining consortia, represent a smaller slice but command high price points for mission-critical parts that keep production lines running.
Regulatory oversight varies. Medical payloads must adhere to pharmacy handling laws, which require additional packaging and temperature controls. Retail consignments avoid such layers, making scaling easier, but margins are thinner. Market participants now partition fleets by vertical, tailoring craft payload modules, telemetry, and compliance documentation to meet specific needs. This segmentation discipline is sharpening competitive edges across the delivery drone market.
Geography Analysis
North America Delivery Drones Market
North America remains the largest regional base with a 42.84% share in 2025, thanks to progressive FAA rulings, robust consumer spending, and investments by Amazon Prime Air, Wing, and Walmart. Urban architectures accommodate rooftop drop-off pads and micro-fulfillment nodes integrated into existing retail footprints. Healthcare use cases thrive in Alaska, Appalachia, and desert counties where road access is seasonal, anchoring long-range demand. Venture funding concentrates in US tech hubs, enabling hardware and software iterations that ripple out to global partners. Despite its lead, the region grapples with crowded airspace, which complicates route approvals and moderates the pace of expansion within the delivery drones market.
APAC Delivery Drones Market
The Asia-Pacific region is poised for the fastest growth, with a 33.68% CAGR through 2031. China mainstreamed drones into JD Logistics’ network, connecting rural farms to city sort centers across more than 200 fixed corridors. India’s Production-Linked Incentive scheme offers subsidies for local manufacturing and design, drawing startups into cost-sensitive niches such as agri-input deliveries. Japan green-lit Rakuten’s multi-prefecture operations, signaling regulatory convergence with Western safety standards. Infrastructure deficits in Indonesia and the Philippines further spotlight drones as substitutes for unpaved or island-hopping truck routes. Consequently, the delivery drones market sees the APAC leapfrog incremental improvements and adopt aerial logistics as the first-choice supply chain in remote provinces.
EMEA and LATAM Delivery Drones Market
Europe enjoys policy alignment under EASA, which facilitates smooth cross-border services as operators scale from local to regional footprints. Manna’s operations in Ireland and the UK advanced when it secured a US FAA waiver, illustrating the benefits of transatlantic harmonization. Environmental policy accelerates the adoption of low-emission credentials, with carriers leveraging these credentials to win municipal freight tenders. Growth remains tempered by privacy activism and dense controlled airspace, yet high per-capita income sustains premium delivery fees. Collectively, these dynamics underpin steady but measured expansion for the delivery drones market across Europe. At the same time, Latin America, the Middle East, and Africa progress through smaller healthcare-led pilots that will scale as regulatory clarity improves.

Regulatory Landscape
Commercial package-delivery drone operations are shifting from waiver-heavy pathways toward standardized, performance-based frameworks. In the United States, compensated package delivery typically routes through 14 CFR Part 135 air carrier certification, and federal actions in 2024-2025 emphasized scaling approvals through programmatic approaches, including streamlined environmental review under NEPA. In June 2025, an executive order directed the FAA to accelerate rulemaking for routine BVLOS operations, supporting repeatable approvals for higher-frequency networks.
In Europe, EASA has continued to consolidate rules for unmanned aircraft operations through its Easy Access Rules for UAS, with a June 2026 revision adding updated guidance aligned to the Specific Operations Risk Assessment (SORA) framework. At the international level, ICAO adopted new Standards and Recommended Practices for Remotely Piloted Aircraft Systems in April 2024, supporting convergence on operator certification concepts and risk-based operating categories that shape how national authorities structure approvals for delivery missions.
Value Chain Analysis
The delivery drones value chain spans airframe and subsystem suppliers (batteries, propulsion, avionics, communications links, payload integration), software providers (flight planning, fleet management, detect-and-avoid interfaces, and UTM connectivity), and operators that run routes and ground infrastructure (launch/landing sites, charging, maintenance, and mission control). Customer-facing integration also matters, as retailers, healthcare providers, and logistics firms connect ordering platforms, identity and chain-of-custody workflows, and delivery confirmation into existing last-mile processes.
Value capture is shifting toward the operating system around the drone rather than the drone itself, since scaling depends on regulatory compliance, safety cases, and repeatable route authorizations. Regulatory standardization efforts, including the FAA pathway for package delivery under Part 135 and EASA rule updates incorporating SORA 2.5 guidance, increase the weight of compliance engineering, testing, documentation, and audit readiness. Partnerships influence route monetization and network buildout, with cargo and healthcare stakeholders working with specialist drone firms to extend coverage where ground logistics are constrained.
Competitive Landscape
Global competition is split between vertically integrated tech giants, including Wing Aviation LLC (Alphabet Inc.), Zipline International Inc., Flytrex Inc., SZ DJI Technology Co., Ltd., and United Parcel Service of America, Inc. Amazon Prime Air and Alphabet’s Wing devote resources to proprietary airframes, route-optimization software, and dedicated fulfillment nodes, using e-commerce scale to amortize R&D costs. Zipline and Wingcopter tackle healthcare and rural logistics, leveraging fixed-wing endurance and cold-chain modules to carve defensible niches. UPS Flight Forward and FedEx experiment with rural parcel lanes but still weigh drones against crewed aircraft and trucks in broader fleet economics. Together, these players raise the innovation bar, deepening technical entry barriers for late arrivals to the delivery drones market.
Strategic partnerships multiply, for instance, Walmart has aligned with both Wing and Zipline for broader coverage, Kroger has tested Drone Express for grocery deliveries, and Uber has invested in Flytrex to integrate aerial drops into its Eats app. Heavy-lift remains an open space where DJI’s FlyCart 30 meets industrial demand, and startups like Speedbird Aero build custom rigs for oil majors. Intellectual property related to detect-and-avoid and battery management emerges as a differentiator, with firms patenting avionics stacks to prevent competitors from accessing them. Certification proficiency, evident in DroneUp’s 2024 Part 135 clearance, serves as a regulatory moat, allowing early movers to compound their market share before newcomers navigate lengthy audits.
Regional fragmentation persists as local aviation agencies issue unique map overlays, spectrum allocations, and insurance requirements. Operators with cloud-based flight-planning platforms that ingest these variables in real time will scale faster. Mergers and minority investments are gaining pace, reflecting a race to acquire scarce pilot teams, integration engineers, and regulatory staff. Over the next five years, the delivery drones market is likely to consolidate around a handful of multi-continent networks supplemented by specialized regional franchises.
Delivery Drones Industry Leaders
Wing Aviation LLC (Alphabet Inc.)
Zipline International Inc.
Flytrex Inc.
SZ DJI Technology Co., Ltd.
United Parcel Service of America, Inc.
- *Disclaimer: Major Players sorted in no particular order
Delivery Drones Market Companies Covered in this Report
- Prime Air (Amazon.com, Inc.)
- Wing Aviation LLC (Alphabet Inc.)
- United Parcel Service of America, Inc.
- FedEx Corporation
- Airbus SE
- Zipline International Inc.
- SZ DJI Technology Co., Ltd.
- Wingcopter GmbH
- Guangzhou EHang Intelligent Technology Co. Ltd.
- Drone Delivery Canada Corp.
- Flytrex Inc.
- Matternet Inc.
- Kite Aero
- Manna Drone Delivery
- Skyports Drone Services
- Speedbird Aero
- Rakuten Group, Inc.
- JDLogistics, Inc
- DroneUp, LLC

Market Opportunities and Future Outlook
A key whitespace for market expansion sits where large-format retail coverage overlaps with BVLOS-capable networks, since multi-city deployments can rely on repeatable operational playbooks rather than one-off pilots. Wing and Walmart moved from pilots toward metro-by-metro scaling, including a January 2026 plan to extend service to an additional 150 Walmart stores through 2027 and a June 2026 announcement adding seven new major US metro areas. This shift calls for standardized hubs, higher-throughput fleet operations, and integration software that can manage ordering, routing, and exceptions across multiple cities.
Manufacturing and systems-integration capacity is also becoming a constraint and a development lever as operators move from limited fleets toward network density. In 2026, Flytrex opened a manufacturing and maintenance facility in Texas to support expansion in Dallas-Fort Worth, and Volatus Aerospace opened a 53,000-square-foot manufacturing and systems integration facility in Montreal-Mirabel, pointing to more localized build, test, and support footprints. Healthcare network buildouts add another expansion lane, with Zipline extending US home delivery services to Cleveland (with Cleveland Clinic) and Austin in July 2026, which increases demand for temperature-controlled payload modules, traceability, and service-level assurance aligned to clinical workflows.
Recent Industry Developments in Delivery Drones Market
- July 2026: Zipline announced expansion of its US home delivery services to Cleveland, Ohio (including a Cleveland Clinic-linked service in the Beachwood suburb) and to Austin, Texas. The move extends drone delivery beyond institutional routes toward consumer-addressable healthcare logistics, increasing demand for compliant packaging, chain-of-custody workflows, and higher-frequency BVLOS operations.
- June 2026: Wing and Walmart announced expansion of their drone delivery service into seven additional major US metro areas: Memphis, New Orleans, Philadelphia, Phoenix, San Diego, the San Francisco Bay Area, and Salt Lake City. Adding multiple metros in one step accelerates standardization of hub layouts and operational processes, and it increases competitive pressure on other operators to secure approvals and retail integrations at scale.
- December 2024: The FAA approved DroneUp for Part 135 operations, enabling routine package-delivery flights under an air carrier certification framework. This approval reinforced Part 135 as a scaling pathway for compensated drone deliveries and raised the bar for safety management, maintenance programs, and documentation across commercial operators.


Delivery Drones Market Report Scope and Research Methodology
Market Definition and Coverage
For this study, the delivery drones market covers unmanned aerial vehicles and related onboard systems that are purchased or deployed mainly to move parcels, medical items, or small freight from one point to another, either within a campus setting or across last mile routes.
Scope exclusions: Activities focused only on photography, mapping, defense missions, recreational flying, after-sales drone services, and non-aerial delivery robots are excluded.
Segments Covered in This Report
- By Drone Type
- Rotary-wing
- Fixed-wing
- By Payload Capacity
- Less than 5 kg
- 5 to 10 kg
- More than 10 kg
- By Delivery Range
- Less than 25 km
- 25 to 50 km
- More than 50 km
- By End-User Industry
- Retail and E-commerce
- Food and Grocery
- Healthcare and Pharma Logistics
- Postal and Express Parcel
- Industrial and Construction
- By Geography
- North America
- United States
- Canada
- Mexico
- Europe
- Germany
- United Kingdom
- France
- Italy
- Spain
- Rest of Europe
- Asia-Pacific
- China
- Japan
- India
- South Korea
- Rest of Asia-Pacific
- South America
- Brazil
- Argentina
- Rest of South America
- Middle East and Africa
- Middle East
- United Arab Emirates
- Saudi Arabia
- Rest of Middle East
- Africa
- South Africa
- Rest of Africa
- Middle East
- North America
Data Sources, Market Sizing, and Validation
Desk Research
Desk research was used to map the demand signals and operating constraints that shape delivery drone deployments. We referenced public sources such as aviation regulator publications (for UAS rules and waiver paths), customs and trade statistics for aircraft parts, and government transport statistics that proxy parcel flow and last mile intensity.
To keep assumptions practical, technical and adoption inputs were cross-checked using sources such as peer-reviewed UAS logistics papers, patent databases for delivery-related filings, and material from relevant associations and standards bodies that clarifies safety, remote ID, and airworthiness direction. We also reviewed company filings, investor presentations, and trusted press coverage, and we supplemented financial normalization through a paid company financials and intelligence subscription where needed. This list is illustrative only, and many other sources were used for data collection, validation, and clarification.
Primary Interviews and Surveys
Primary work focused on operators, logistics users, drone OEMs and integrators, and supporting ecosystem experts who track permitting, fleet operations, and delivery economics. These discussions were used to confirm adoption timelines by region, realistic payload and range use cases, and how pricing changes as fleets move from pilots to scaled routes, then any weak spots in the desk view were rechecked before locking assumptions.
Distribution of primary research fieldwork respondents
| Company type | Respondent position | Region |
|---|---|---|
| Top tier: 29% | CXOs: 15% | APAC: 47% |
| Mid tier: 50% | Functional/Unit leaders: 30% | EMEA: 29% |
| Smaller Players: 21% | Managers: 55% | Americas: 24% |
Market-Sizing & Forecasting
Sizing starts with a top-down build where the demand pool is reconstructed from addressable delivery routes, approval and operating limits, and the share of deliveries that can shift to drones under current safety and range conditions. The totals are then corroborated through selective bottom-up checks using sampled fleet counts, typical deliveries per drone per day, and price bands for platforms and key onboard subsystems.
Key inputs used in the model include payload class mix, average flight range per mission, operating hours allowed by local rules, replacement cycles for airframes and batteries, and the share of deliveries done in urban versus rural corridors. Because some countries publish clearer UAS permissions and trial outcomes than others, we apply gap-handling using proxy indicators like parcel density, infrastructure readiness, and comparable approval pathways, then adjust with interview feedback.
For forecasting, scenario analysis is used to reflect different speeds of regulatory clearance, scaling of beyond-visual-line-of-sight operations, and the pace at which unit economics improve. Each scenario is anchored to a short list of drivers that can be rechecked annually, which keeps the forecast explainable and repeatable as conditions change.
Data Validation & Update Cycle
Model outputs are checked against independent signals such as reported pilot-to-commercial conversion rates, announced route permissions, and observable fleet scale-ups, and we look for changes that do not match these markers. When variances show up, assumptions are reviewed in steps, first for unit definitions and currency timing, then for adoption and pricing inputs, and only then for growth logic.
Before sign-off, the work is peer reviewed and any large swings trigger targeted re-contacts with operators or ecosystem experts to confirm what changed. Reports are refreshed annually, with interim updates when material events occur, and a final pre-delivery pass is done so clients receive the most current view available.
Mordor Intelligence's Delivery Drones Market Estimate Compared With Other Published Estimates
Published market sizes for delivery drones can look far apart because the counted item is not always the same, and because base years and rollout assumptions vary by publisher. The differences usually come from what gets included in the value (hardware only versus service revenue), how regulatory readiness is treated, and how quickly pricing is assumed to move as deployments scale.
In this market, two practical gap drivers show up often: some estimates blend drone delivery services with drone platform sales, and others assume a faster shift to routine BVLOS operations across many countries even when approvals remain uneven. The main spread comes from excluding service revenue and ground robots while anchoring adoption to country-level operating permissions and observable fleet activity, which is how it is handled by Mordor Intelligence.
Benchmark comparison
| Source | Market Size | Gaps in Research Methodology |
|---|---|---|
| Mordor Intelligence | USD 1.47 B (2026) | |
| Industry Research Publisher A | USD 1.40 B (2025) | Uses a different base year and may blend a broader definition of delivery-related drone components and deployments, which can shift the starting value and the growth slope. |
| Global Research Publisher B | USD 3.47 B (2025) | Frames the market as drone delivery services, which can include service fees and delivery operations revenue that are not counted in a drone platform focused market size. |
Across the three figures, the biggest driver is scope, since hardware sales and delivery services create very different revenue pools even if the same flights are discussed. By keeping unit definitions consistent and tying adoption to permissions, routes, and fleet signals that can be rechecked, our estimate stays traceable to clear inputs and can be updated without rewriting the full logic.


Key Questions Answered in the Report
How large is the delivery drones market in 2026?
The delivery drones market size reached USD 1.47 billion in 2026 and is forecasted to reach USD 6.74 billion by 2031 at a 35.69% CAGR.
Which drone type currently dominates commercial deliveries?
Rotary-wing platforms led with 72.56% revenue share in 2025, favored for dense urban and rooftop drop-off missions.
What is the fastest-growing regional opportunity?
Asia-Pacific is projected to expand at 33.68% CAGR through 2031, driven by China’s rural routes and India’s manufacturing incentives.
Why are healthcare providers adopting drones?
Drones cut delivery times for blood, vaccines, and prescriptions from hours to minutes in areas where road access is limited, enhancing patient outcomes.
What regulatory milestones should operators watch?
FAA Part 135 certificates in the US and EASA certified category approvals in Europe now provide standardized paths for routine beyond-visual-line-of-sight operations.
Page last updated on:


 Your data is secure and never sold or shared.


