
Automotive Semiconductor Market Size and Share
Market Overview
| Study Period | 2020 - 2031 |
|---|---|
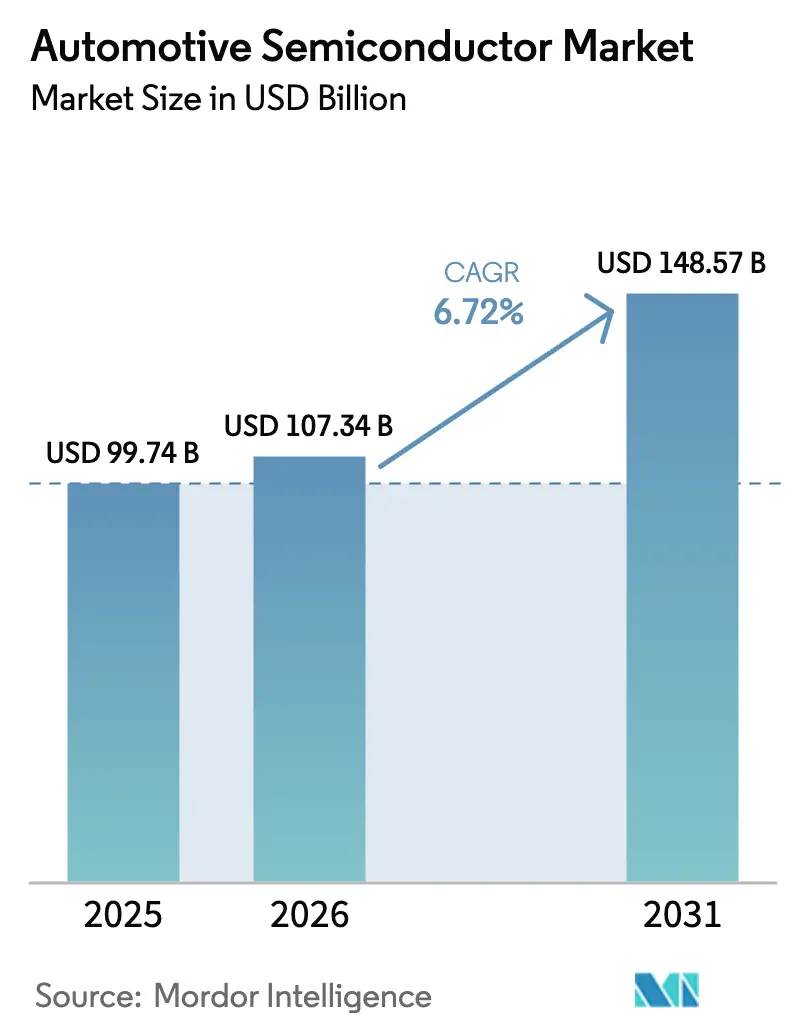
| Market Size (2026) | USD 107.34 Billion |
| Market Size (2031) | USD 148.57 Billion |
| Growth Rate (2026 - 2031) | 6.72% CAGR |
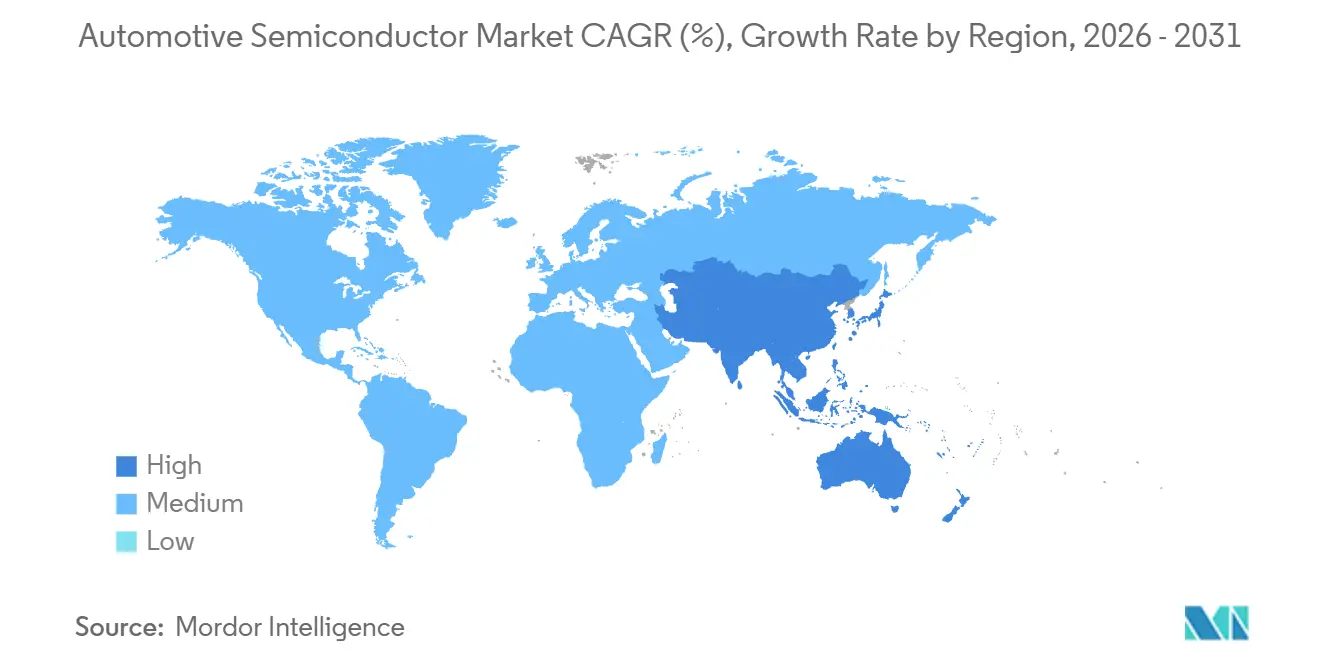
| Fastest Growing Market | Middle East |
| Largest Market | Asia Pacific |
| Market Concentration | Medium |
Major Players *Disclaimer: Major Players sorted in no particular order Image © Mordor Intelligence. Reuse requires attribution under CC BY 4.0. | |
Automotive Semiconductor Market Analysis by Mordor Intelligence
The Automotive Semiconductor Market size is projected to expand from USD 99.74 billion in 2025 and USD 107.34 billion in 2026 to USD 148.57 billion by 2031, registering a CAGR of 6.72% between 2026 to 2031. Zonal electrical-and-electronic (E/E) architectures, rising electric-vehicle penetration, and regulatory pressure for advanced safety have collectively pushed chip content per vehicle to historic highs. Battery electric models already account for more than half of global semiconductor demand, despite representing a smaller share of production, confirming that value growth now depends far more on content per unit than on unit volumes. High-performance system-on-chip (SoC) platforms have transitioned from concept to mainstream as automakers adopt software-defined vehicles and shorten their product cycles. The Asia Pacific leads in revenue thanks to a robust Chinese industrial policy, while sovereign wealth programs in the Middle East have made that region the fastest-growing frontier. Competitive intensity is rising as traditional integrated device manufacturers (IDMs) confront hyperscalers and mobile-chip specialists that leverage leading-edge nodes to win centralized-compute sockets.
Key Report Takeaways
- By propulsion type, battery electric vehicles accounted for 54.19% of the automotive semiconductor market share in 2025; internal-combustion vehicles are forecast to trail with a 17.49% CAGR through 2031.
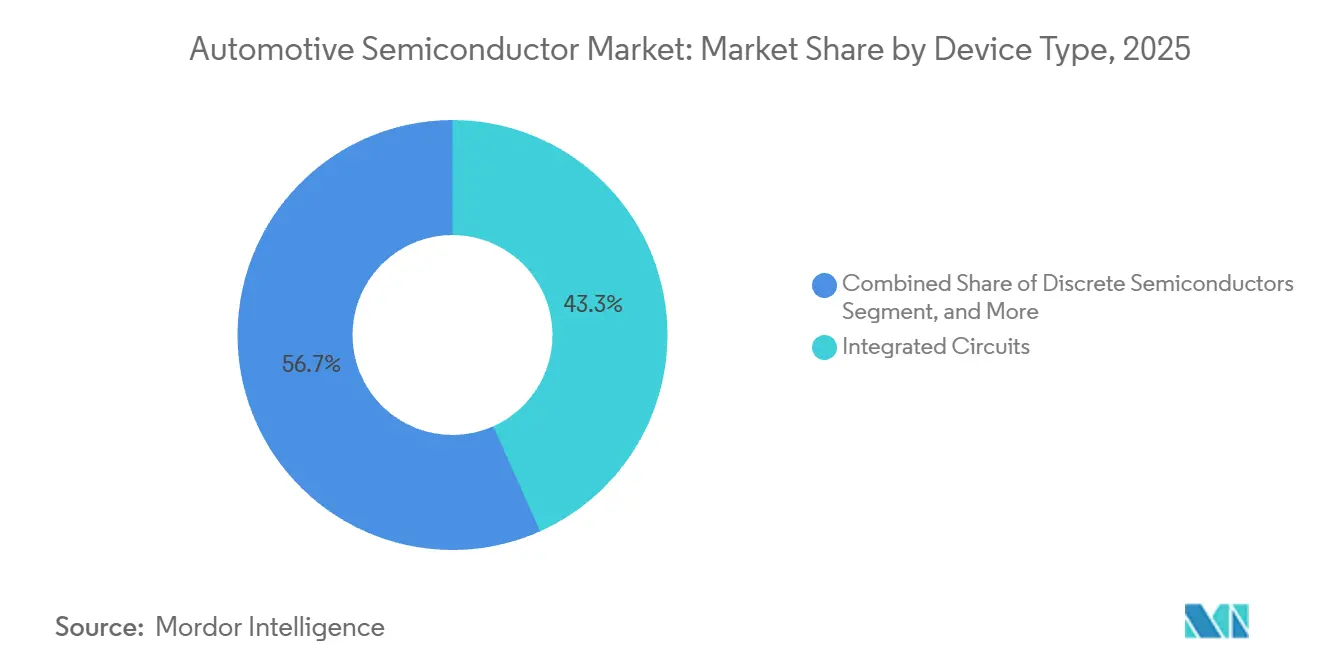
- By device category, integrated circuits led with 43.32% revenue share in 2025, while sensors and microelectromechanical systems are poised to expand at a 17.61% CAGR to 2031.
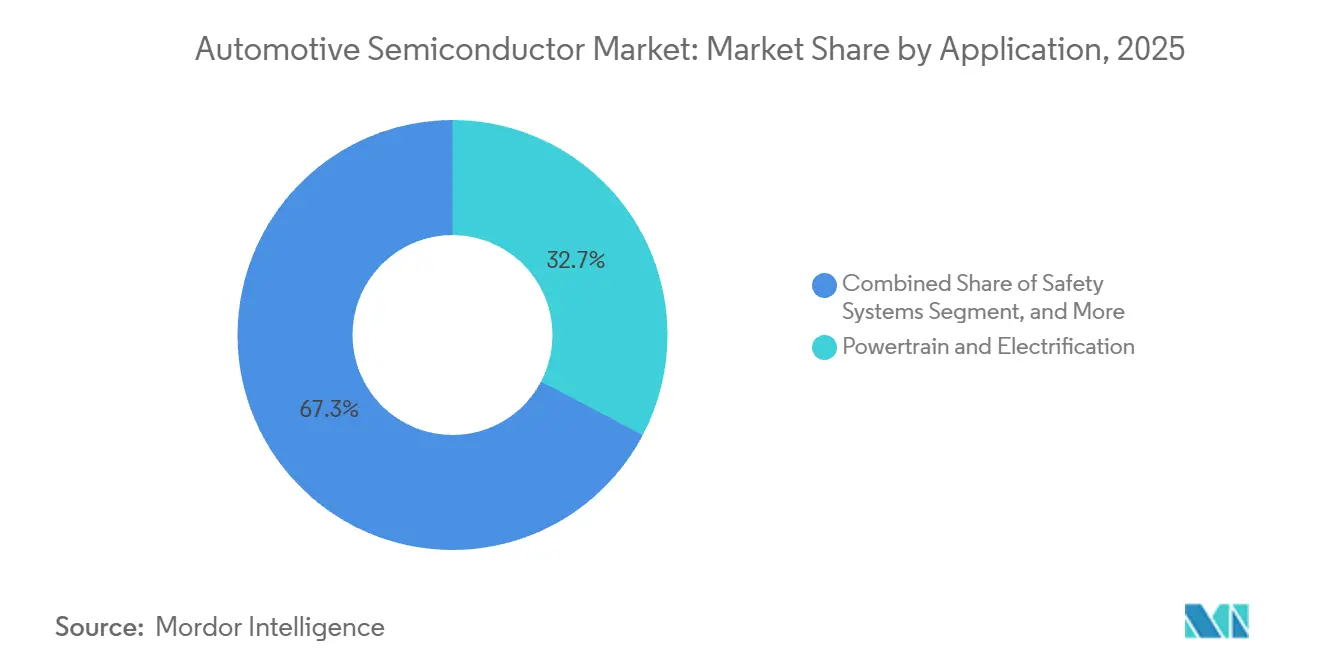
- By application, powertrain and electrification captured 32.71% of 2025 revenue; advanced driver-assistance systems are projected to post the fastest growth rate of 17.81% between 2026 and 2031.
- By business model, IDMs retained a 67.58% share in 2025, yet fabless vendors are tracking an 18.43% CAGR through 2031.
- By geography, Asia Pacific commanded 45.87% of 2025 revenue, whereas the Middle East is expected to log an 18.12% CAGR for 2026-2031.
Note: Market size and forecast figures in this report are generated using Mordor Intelligence’s proprietary estimation framework, updated with the latest available data and insights as of January 2026.
Global Automotive Semiconductor Market Trends and Insights
Drivers Impact Analysis*
| Driver | (~) % Impact on CAGR Forecast | Geographic Relevance | Impact Timeline |
|---|---|---|---|
| Increasing vehicle production in emerging economies | +2.8% | Asia Pacific, Middle East and Africa | Medium term (2-4 years) |
| Rising demand for advanced safety and comfort systems | +3.2% | Global, early adoption in North America and Europe | Short term (≤ 2 years) |
| Electrification boosting semiconductor content per vehicle | +4.1% | Global, led by China, Europe and North America | Medium term (2-4 years) |
| Zonal E/E architectures and software-defined vehicles spur high-end processors | +2.9% | Global, concentrated in premium segments | Long term (≥ 4 years) |
| Government incentives for auto-grade foundry capacity expansion | +1.7% | North America, Europe, Asia Pacific | Medium term (2-4 years) |
| Adoption of SiC and GaN power devices in electric powertrains | +2.4% | Global, strong uptake in China and Europe | Medium term (2-4 years) |
| Source: Mordor Intelligence | |||


Increasing Vehicle Production in Emerging Economies
Light-vehicle output in India reached 5.8 million units in 2025, a 9% annual rise, while Southeast Asian assembly topped 3.2 million units, pushing semiconductor demand for entry-level models that now ship with stability control and basic connectivity as standard. New assembly and test capacity under India’s Production-Linked Incentive scheme is localizing supply and trimming import costs, a shift mirrored by incentive-backed investments in Mexico and the Gulf states. These moves shorten supply chains, anchor design talent regionally, and accelerate time to qualification. As emerging-market buyers demand safety features once reserved for premium segments, chip volumes per vehicle continue to climb. The result is sustained structural expansion for the automotive semiconductor market well beyond global vehicle growth rates.
Rising Demand for Advanced Safety and Comfort Systems
The European Union's General Safety Regulation mandated intelligent speed assistance, advanced emergency braking, and driver monitoring for all new type approvals after July 2024, effectively standardizing radar and camera content across mainstream models. U.S. crash-reduction data have reinforced the business case, enabling insurers to lower premiums for vehicles fitted with automated emergency braking, which, in turn, spurs consumer uptake. China’s New Car Assessment Program raised its five-star standard in 2025, prompting domestic brands to incorporate higher-resolution sensors capable of detecting pedestrians up to 100 meters away. These mandates are spreading to cost-sensitive regions, lifting average semiconductor bill-of-materials values for even compact cars. Tier-one suppliers with deep functional-safety pedigrees are well positioned, as ISO 26262 barriers favor proven platforms.
Electrification Boosting Semiconductor Content per Vehicle
Battery electric vehicles averaged USD 1,200 in semiconductor content during 2025, almost triple internal-combustion equivalents, due to traction inverters, onboard chargers, and battery-management integrated circuits.[1]International Energy Agency, “Global EV Outlook 2025,” iea.org Silicon-carbide metal-oxide-semiconductor transistors enable 800-volt architectures that slash charging times below 20 minutes, though substrate capacity remains constrained until new 200-millimeter wafer lines reach scale. Automakers increasingly sign long-term supply agreements to lock in wide-bandgap materials, ensuring cost visibility and design stability. Gallium-nitride devices have begun displacing silicon in onboard chargers for vehicles priced above USD 50,000, leveraging higher switching frequencies to shrink magnetics. With the International Energy Agency forecasting 17 million electric cars in 2026, incremental chip revenue tied to electrification alone is set to exceed USD 10 billion annually.
Zonal E/E Architectures and Software-Defined Vehicles Spur High-End Processors
Major tier-one suppliers secured 2025 production awards for zonal controllers that collapse dozens of electronic control units into a handful of high-compute nodes. NXP’s S32 family on TSMC 5 nanometer merges real-time safety cores, application processors, and hardware security to support over-the-air updates without compromising ASIL-D requirements. Renesas started producing a 3 nanometer SoC that delivers 200 TOPS for sensor fusion, highlighting the rapid migration of automotive logic to cutting-edge nodes. This compute density lets automakers sell post-sale feature unlocks, creating durable revenue streams while shortening hardware replacement cycles. Consequently, demand is pivoting toward advanced substrates, fast memory, and high-speed interconnects, reinforcing the secular uptrend in the automotive semiconductor market.
Restraints Impact Analysis*
| Restraint | (~) % Impact on CAGR Forecast | Geographic Relevance | Impact Timeline |
|---|---|---|---|
| High cost of advanced-feature vehicles | -1.9% | Global, pronounced in price-sensitive markets | Short term (≤ 2 years) |
| Persistent supply-chain constraints and chip shortages | -1.4% | Global, acute in North America and Europe | Short term (≤ 2 years) |
| Scarcity and cost of wide-bandgap substrates | -0.8% | Global, affects high-voltage EV platforms | Medium term (2-4 years) |
| Lengthy automotive qualification cycles slow time-to-market | -1.1% | Global, impacting all OEMs and tier-ones | Medium term (2-4 years) |
| Source: Mordor Intelligence | |||
High Cost of Advanced-Feature Vehicles
Equipping a mainstream vehicle with Level 2 driver assistance pushes average transaction prices above USD 48,000 in the United States, making such cars 22% costlier than segment norms. Semiconductor content for these feature packs often exceeds USD 1,000, and automakers apply significant mark-ups to recover R&D and validation costs. Emerging markets with high price elasticity feel the effect most acutely, limiting penetration to upper trims. Redundant sensor architectures raise costs further because regulators insist on fail-operational designs for pedestrian safety. Although suppliers are exploring lower-cost sensor fusion that reduces lidar reliance, functional-safety ceilings still restrain rapid cost downs.
Persistent Supply-Chain Constraints and Chip Shortages
Automotive chip lead times averaged 22 weeks in late 2025, still markedly above the pre-pandemic baseline of 12-14 weeks.[2]Semiconductor Equipment and Materials International, “Long-Term Lead-Time Trends,” semi.org European OEMs lost an estimated 180,000 units of output in 2025 to microcontroller shortages, and many tier-one suppliers doubled buffer inventory to hedge risk, depressing their return on invested capital. Geopolitical trade friction has pushed automakers to qualify multiple foundries, but dual-sourcing critical components consumes engineering bandwidth and prolongs validation. Roughly 40% of analog and power capacity remains on 200-millimeter tools with limited scope for expansion, so bottlenecks persist even as new subsidized fabs arrive later in the decade. Until mature-node capacity broadens, supply risk will continue tempering the automotive semiconductor market’s growth trajectory.
*Our forecasts treat driver/restraint impacts as directional, not additive. The impact forecasts reflect baseline growth, mix effects, and variable interactions.
Segment Analysis
By Device Type: Integration Dominates, Sensors Accelerate
The automotive semiconductor market size for integrated circuits stood highest in 2025, capturing 43.32% revenue thanks to microcontrollers, SoCs, and memory that underpin zonal and centralized architectures. Growing compute density, embedded hardware security, and over-the-air update readiness make these devices indispensable. Market participants note that the latest SoCs combine heterogeneous CPU clusters, graphics engines, and neural processors, allowing a single package to handle cockpit, connectivity, and low-speed autonomy workloads. Demand for embedded memory continues to surge as map data and neural network weights expand.
Sensors and microelectromechanical systems are forecast to post a 17.61% CAGR, the fastest pace among device categories. Radar, lidar, camera, ultrasonic, and inertial units now ship in redundant arrays to deliver 360-degree perception for mandated safety functions. Texas Instruments’ corner-radar chip, which integrates an RF front-end and signal processing on one die, typifies this consolidation trend. Meanwhile, wide-bandgap power discretes are migrating into multichip modules, slightly tempering discrete unit growth but lifting average selling prices. The pathway ahead favors suppliers that can blend sensing, processing, and actuation into integrated platforms, reinforcing scale advantages in the automotive semiconductor market.


By Vehicle Propulsion: Combustion Retains Volume, Battery Electric Drives Value
Battery electric vehicles still deliver the highest semiconductor value per vehicle, giving them 54.19% of 2025 semiconductor revenue. Mild-hybrid 48-volt systems add converters and controllers, nudging chip content upward even before full electrification. In contrast, the automotive semiconductor market size tied to internal-combustion vehicles will expand at a projected 17.49% CAGR, influenced by increasing electronic content even in conventional platforms. Each battery electric car carries USD 600-USD 800 of power electronics alone, dwarfing combustion counterparts.
Hybrid configurations offer a bridge solution, demanding dual power-management architectures that lift per-vehicle chip value to roughly USD 700. Fuel-cell variants remain niche but command specialized high-voltage converters, hinting at future upside should hydrogen infrastructure mature. Automakers such as BYD and Stellantis have announced standardized 400-volt and 800-volt platforms that rely heavily on silicon-carbide modules, tightening the link between propulsion choice and semiconductor bill of materials. The data confirm that value growth will hinge on electrified drivetrains, even as combustion engines dominate production counts through the near term.
By Application: Powertrain Leads, ADAS Surges
Powertrain and electrification yielded 32.71% of 2025 revenue, cementing their role as the single largest application block. Content ranges from gate-driver ICs and current sensors to battery-management and thermal-control ASICs. Silicon-carbide MOSFET modules priced well above traditional IGBTs are gradually standardizing in premium electric vehicles, raising revenue density per inverter.
Advanced driver-assistance systems stand out as the fastest-growing slice, projected to grow 17.81% annually through 2031. Mandates for automated emergency braking, lane-keeping, and driver monitoring ensure baseline demand, while premium brands push toward Level 3 conditional automation that requires centralized perception compute of 200-2,000 TOPS. Here, the automotive semiconductor market share increasingly tilts toward graphics-oriented SoCs from players like NVIDIA and custom ASIL-D designs by tier-one integrators. Body electronics and infotainment maintain steady trajectories, but their relative weight diminishes as high-performance compute and powertrain semiconductors command a larger revenue mix.
By Business Model: IDMs Hold Scale, Fabless Vendors Accelerate
IDMs secured 67.58% of 2025 revenue, leveraging captive fabs to guarantee supply, iterate quickly on automotive qualification, and retain full margin stacks. Infineon and Renesas continue to press this advantage by extending silicon-carbide and microcontroller capacity. Still, fabless players are scaling faster, aided by foundry commitments to qualify sub-10 nanometer nodes for automotive reliability. The automotive semiconductor market size attributable to fabless vendors is projected to post an 18.43% CAGR, as OEMs value custom silicon aligned with proprietary software.
Foundry partners such as TSMC and Samsung have earmarked dedicated automotive lines, absorbing AEC-Q validation costs and lowering entry barriers. Automakers hiring silicon design teams further blur the traditional IDM–fabless divide. Over time, the ecosystem will likely converge on hybrid models that mix in-house design with external manufacturing, but the present cycle still rewards IDMs for their vertical resilience during supply shortages.
Geography Analysis
Asia Pacific generated 45.87% of 2025 revenue, anchored by China’s 9 million electric-vehicle sales and its 25% domestic-content mandate for new-energy vehicles.[3]China Association of Automobile Manufacturers, “New-Energy Vehicle Sales,” caam.org.cn Proximity to foundries and assembly houses enables faster design-for-cost loops and the prompt qualification of custom devices, thereby strengthening the region’s influence on semiconductor roadmaps. South Korea’s memory giants have pledged to dedicate 15% of their 300-millimeter wafer output to automotive customers by 2027, thereby deepening the supply-chain cluster.
North America and Europe combined for roughly 35% of revenue. Aggressive safety and decarbonization targets continue to drive high semiconductor intensity, while public incentives under the United States CHIPS and Science Act and the European Union Chips Act channel billions of dollars into domestic fabs. Those plants will not fully ramp up until 2027-2028, leaving the regions reliant on Asian imports in the interim.
The Middle East, although a small base today, is expected to log an 18.12% CAGR through 2031. Sovereign funds in the United Arab Emirates and Saudi Arabia are backing electric fleet mandates and local assembly that specify advanced driver-assistance and battery-management features, pulling global tier-one suppliers into greenfield partnerships. Africa and South America remain volume markets for entry-level vehicles, yet regulatory adoption of electronic stability control and tire-pressure monitoring is gradually lifting chip demand.
Mordor Intelligence provides coverage of the automotive semiconductor market across other key regional markets, including Europe, each with their regulatory frameworks and demand patterns.

Regulatory Landscape
Automotive semiconductor demand is shaped by safety, cybersecurity, and industrial policy requirements that affect device content and supplier qualification. In Europe, the EU General Safety Regulation has mandated features such as intelligent speed assistance, advanced emergency braking, and driver monitoring for new type approvals since July 2024. This standardization reinforces baseline radar, camera, and in-cabin sensing content and raises functional-safety expectations (ISO 26262) for the associated ICs and sensors.
Supply-chain and trade rules are also tightening for connected and software-defined vehicles. In the United States, the Department of Commerce issued a connected vehicle supply chain final rule (published January 2025, effective March 2025) restricting certain connected vehicle hardware and software with a sufficient nexus to the PRC or Russia, which increases compliance and traceability requirements for telematics, connectivity, and compute platforms. In the EU, the European Commission advanced a 2026 proposal often described as a next-phase semiconductor policy package (COM(2026) 504), focused on strategic instruments and streamlined permitting for semiconductor manufacturing. It is aimed at supporting downstream critical sectors such as automotive, strengthening the link between public incentives and auto-grade capacity expansion.
Value Chain Analysis
The automotive semiconductor value chain runs from (i) upstream materials and equipment, including wide-bandgap substrates for SiC and GaN, to (ii) chip design by IDMs and fabless vendors. It then moves to (iii) wafer fabrication at captive IDM fabs and foundries, (iv) OSAT assembly, test, and automotive qualification, and (v) integration through tier-one suppliers into OEM platforms across powertrain, ADAS, body, and infotainment.
A defining constraint is the length of the automotive qualification cycle (AEC-Q and ISO 26262), which encourages early supplier engagement and multi-sourcing for critical MCUs, power devices, and sensors. From 2024-2026, procurement and manufacturing have shifted closer together via direct OEM-chipmaker agreements and localized capacity programs designed to reduce exposure to long lead times (around 22 weeks in late 2025 in this market context). Stellantis and Infineon, for instance, signed supply and capacity agreements in November 2024 focused on power architecture and silicon carbide. Volkswagen Group also outlined a joint procurement model with Rivian in September 2025 covering more than 50 semiconductor categories to standardize sourcing across platforms. On the supply side, the chain is expanding geographically and technologically, including advanced-node automotive compute (foundry-qualified) and power semiconductor localization. Collaborative R&D remains part of the approach, such as GlobalFoundries joining imec's Automotive Chiplet Program in October 2025 to accelerate automotive-grade chiplet adoption across the ecosystem.
Competitive Landscape
The top ten suppliers accounted for approximately 65% of the 2025 revenue, indicating a moderately concentrated structure. NXP Semiconductors, Infineon Technologies, and Renesas Electronics collectively hold more than 40% of the microcontroller and power-discrete revenue, benefiting from rich automotive pedigrees and deep customer relationships. Yet hyperscalers and mobile-SoC leaders, including NVIDIA and Qualcomm, are claiming centralized compute sockets in premium nameplates by porting graphics and modem roadmaps to zonal architectures.
Government-subsidized capacity expansions have become a strategic lever. TSMC’s Arizona mega-fab, for example, secured USD 40 billion in pledges, part of which targets AEC-Q-qualified 4-nanometer production lines from 2027. In Europe, STMicroelectronics and GlobalFoundries are jointly building an 18-nanometer fab in France, with funding partly provided by Chips Act grants. Strategic alliances between automakers and chip designers also intensified, as seen in General Motors’ 2025 partnership with Qualcomm on custom cockpit and driver-assistance processors.
White-space innovation centers on edge AI accelerators designed for low-latency sensor fusion. Ambarella’s 120-TOPS SoC positions the firm as a challenger in perception processing. Chinese vendors such as Horizon Robotics leverage domestic policy support to gain share in local markets. Across the board, compliance with ISO 26262 and UNECE WP.29 cybersecurity rules has become a competitive moat, rewarding suppliers that can certify ASIL-D systems and deliver secure over-the-air updates.
Automotive Semiconductor Industry Leaders
NXP Semiconductors N.V.
Infineon Technologies AG
Renesas Electronics Corporation
STMicroelectronics N.V.
Texas Instruments Inc.
- *Disclaimer: Major Players sorted in no particular order


Market Opportunities and Future Outlook
Power semiconductors for electrified powertrains remain the main whitespace, since higher-voltage architectures increase the value density of inverters, onboard chargers, and DC-DC conversion. The shift from silicon to wide-bandgap devices is also tied to manufacturing scale-up, particularly 200 mm SiC wafer production by leading suppliers, which creates openings for substrate capacity, device packaging, and automotive-grade qualification services. A tangible near-term signal is Bosch starting sample production of SiC semiconductors at its Roseville, California, site in July 2026, supported by a USD 2 billion investment and a USD 225 million CHIPS Act grant. This reinforces localized supply for North American EV programs.
A second opportunity corridor is the consolidation of vehicle electronics into zonal and centralized compute, which raises demand for high-integration SoCs, high-speed memory, and secure in-vehicle networking. OEM and tier-one actions point to pull-through, including Volkswagen highlighting standardized semiconductor procurement across more than 50 categories with its Rivian alliance in September 2025, and GM pursuing custom compute partnerships (for example, Qualcomm collaboration noted in the market context) that expand sockets for automotive-grade processors, connectivity ICs, and security IP aligned with UNECE WP.29 cybersecurity requirements. As advanced-node capacity expands across regions, the presence of programs such as TSMC's expansion footprint (including the Dresden ESMC project referenced in 2026 capacity updates and the already-running JASM site in Japan with volume production in late 2024) supports opportunities in automotive-qualified foundry services, co-development, and long-term supply agreements that stabilize availability for critical compute and memory content in software-defined vehicles.
Recent Industry Developments
- July 2026: Bosch commenced sample production at its Roseville, California, semiconductor facility as it advances local silicon carbide device manufacturing under a USD 2 billion investment supported by a USD 225 million CHIPS Act award. The move strengthens regional sourcing options for EV power electronics and shortens supply lines for automotive-grade qualification and ramp.
- June 2026: Infineon Technologies began mass production of its RASIC CTRX8188F imaging radar MMIC (8Tx8Rx), expanding the availability of higher-resolution radar components for ADAS stacks. This supports sensor consolidation and higher-performance perception in mainstream platforms by increasing supply of automotive-grade radar front-end silicon.
- November 2024: Stellantis and Infineon announced cooperation backed by supply and capacity agreements spanning power architecture, intelligent power network management, and silicon carbide semiconductors for next-generation EVs. Such multi-year arrangements deepen direct OEM-IDM coordination on capacity planning and accelerate platform standardization around SiC-based electrification.


Research Methodology Framework and Report Scope
Market Definition and Coverage
This market covers the value of semiconductor components that are designed and qualified for use in on-road passenger and commercial vehicles, and that go into vehicle electronic systems during manufacturing.
Scope exclusions: We exclude refurb-grade or remanufactured chips sold through independent channels, and we also exclude general consumer semiconductors that are not built or qualified for automotive use.
Segmentation Overview
- By Device Type
- Discrete Semiconductors
- Diodes
- Transistors
- Power Transistors
- Rectifiers and Thyristors
- Other Discrete Devices
- Optoelectronics
- Light-Emitting Diodes (LEDs)
- Laser Diodes
- Image Sensors
- Optocouplers
- Other Optoelectronic Devices
- Sensors and MEMS
- Pressure Sensors
- Magnetic Field Sensors
- Actuators
- Acceleration and Yaw-Rate Sensors
- Temperature and Other Sensors
- Integrated Circuits
- By Integrated Circuit Type
- Analog
- Micro
- Microprocessors (MPU)
- Microcontrollers (MCU)
- Digital Signal Processors
- Logic
- Memory
- By Technology Node (Shipment Volume Not Applicable)
- < 3 nm
- 3 nm
- 5 nm
- 7 nm
- 16 nm
- 28 nm
- > 28 nm
- By Integrated Circuit Type
- Discrete Semiconductors
- By Vehicle Propulsion
- Internal Combustion Engine Vehicles
- Hybrid Vehicles
- Battery Electric Vehicles
- Fuel-Cell Electric Vehicles
- By Application
- Powertrain and Electrification
- Advanced Driver-Assistance Systems (ADAS) and Autonomous Driving
- Body Electronics and Comfort
- Infotainment and Connectivity
- Safety Systems
- By Business Model
- Integrated Device Manufacturer (IDM)
- Design / Fabless Vendor
- Foundry Service Provider
- By Geography
- North America
- United States
- Canada
- Mexico
- South America
- Brazil
- Argentina
- Rest of South America
- Europe
- Germany
- United Kingdom
- France
- Italy
- Spain
- Russia
- Rest of Europe
- Asia Pacific
- China
- Japan
- South Korea
- India
- Australia
- New Zealand
- Rest of Asia Pacific
- Middle East
- United Arab Emirates
- Saudi Arabia
- Turkey
- Rest of Middle East
- Africa
- South Africa
- Nigeria
- Kenya
- Rest of Africa
- North America
Data Sources, Market Sizing, and Validation
Desk Research
Desk work starts by building a clean fact base on vehicle production, electrification, and electronics content trends, because these are the easiest public signals to trace year to year. We relied on public sources such as OICA production statistics, IEA EV outlook data, USITC trade data, and UNECE vehicle safety regulation references to understand what is changing in the vehicle fleet and why.
After that, we used supporting sources like company annual reports, 10-K style filings, investor presentations, and reputable press to cross-check product mix shifts and capacity announcements at a high level. In a few places, we used a paid subscription focused on company financials and a patent database to confirm timing of platform transitions and technology direction. This desk source list is illustrative only, and many additional public sources were reviewed for collection, validation, and clarification.
Primary Interviews and Surveys
Primary work was used to pressure-test the desk assumptions and bring the model closer to what is actually shipping into vehicles. We spoke with a mix of chip suppliers, module and system stakeholders, and vehicle electronics decision-makers across APAC, EMEA, and the Americas. Their input was used to align content per vehicle, pricing movement, and adoption timing by major application areas.
Distribution of primary research fieldwork respondents
| Company type | Respondent position | Region |
|---|---|---|
| Top tier: 28% | CXOs: 14% | APAC: 42% |
| Mid tier: 55% | Functional/Unit leaders: 39% | EMEA: 37% |
| Smaller Players: 17% | Managers: 47% | Americas: 21% |
Market-Sizing & Forecasting
For sizing, we used a top-down build that reconstructs demand from global vehicle output, the mix of EV and ADAS-equipped vehicles, and the average semiconductor content per vehicle, which is then converted into value using realistic average selling price bands. To keep it grounded, selective bottom-up checks were done using sampled supplier revenue exposure to automotive, channel feedback on tight and loose device categories, and simple ASP x unit logic for high-volume components where unit ranges are publicly discussed.
Inputs used in the model include light vehicle and commercial vehicle production trends, EV and hybrid penetration, ADAS and infotainment fitment rates, the shift toward higher voltage power electronics, and typical device price movement during tight supply versus normalization. Where bottom-up signals were incomplete, gaps were handled by using conservative penetration assumptions first, and then tightening them only when multiple interview inputs converged.
Forecasting was done using scenario analysis supported by a simple multivariate regression layer, so the outlook responds to the expected path of vehicle production, EV share, and electronics content growth. The final forward view is adjusted only after primary feedback confirms what is changing in platform design cycles and sourcing behavior.
Data Validation & Update Cycle
Validation is done in several passes, where model outputs are compared against independent signals like vehicle production totals, trade flows for key semiconductor categories, and disclosed automotive revenue direction from major supply-chain participants. When a number looks off, we run variance checks by region and application, and then we re-check the assumptions that drive it, such as content per vehicle or ASP timing, before it moves to analyst review.
Before sign-off, the work is reviewed for logic consistency across years, and outliers are challenged with follow-up calls when the explanation is not clean. Reports are refreshed annually, and interim updates are made when major events occur, such as sharp production shocks or step-changes in EV adoption. Right before delivery, a final refresh pass is completed so the view reflects the latest available data.
Mordor Intelligence's Automotive Semiconductor Market Size Measured Against Other Published Estimates
Published market sizes for automotive semiconductors can look far apart even when they talk about similar vehicles, because the boundary lines are not the same and the timing choices differ. Differences usually come from what is counted as automotive-grade content, which years are treated as the starting point, and how pricing is carried forward when supply conditions change.
By tracking vehicle production, EV and ADAS fitment, and ASP normalization signals, Mordor Intelligence keeps the market value tied to semiconductor content that is actually qualified for automotive programs, instead of blending in broader electronics demand. Another common gap driver is whether the scope includes refurbishment or gray-market flows, and whether the market is presented as a calmer base-case versus a faster adoption scenario, which can lift or compress totals quickly.
Benchmark comparison
| Source | Market Size | Gaps in Research Methodology |
|---|---|---|
| Mordor Intelligence | USD 99.74 B (2025) | |
| Industry Data Publisher A | USD 67.70 B (2024) | Uses an earlier base year and may reflect a narrower revenue capture window tied to the then-current supply cycle, which can understate content growth that accelerated in later vehicle platforms. |
| Research Publisher B | USD 32.14 B (2023) | Appears to use a tighter component scope or different inclusion rules that reduce counted semiconductor categories, and it also starts from a year with lower EV and ADAS penetration, which pulls down the base value. |
The table shows that the spread is largely explained by scope boundaries and the year chosen for the starting point, which are then amplified by pricing and adoption assumptions. When scope is restricted or the base year sits before major content increases, the market value will naturally look smaller, even if the long-term growth rate sounds strong. Our approach stays traceable to a clear demand pool and repeatable checks, which helps keep the final number understandable and consistent across updates.


Key Questions Answered in the Report
How large is the automotive semiconductor market in 2026?
The market is estimated at USD 107.34 billion in 2026 and is projected to reach USD 148.57 billion by 2031.
What is driving semiconductor demand in battery electric vehicles?
Each battery electric car carries USD 1,200 of semiconductor content, mainly for traction inverters, onboard chargers, and battery-management systems.
Which region leads automotive semiconductor revenue?
Asia Pacific held 45.87% of global revenue in 2025, propelled by Chinese electric-vehicle production and domestic-content mandates.
Why are zonal E/E architectures important?
They consolidate dozens of control units into high-compute nodes, enabling over-the-air updates and reducing wiring complexity, thereby boosting demand for advanced SoCs.
How are supply shortages affecting automakers?
Lead times for key microcontrollers remain near 22 weeks, forcing OEMs to carry higher inventory, reschedule production, and dual-source components to mitigate risk.
Page last updated on:




