Automotive Micro Motor Market Size and Share
Market Overview
| Study Period | 2020 - 2031 |
|---|---|
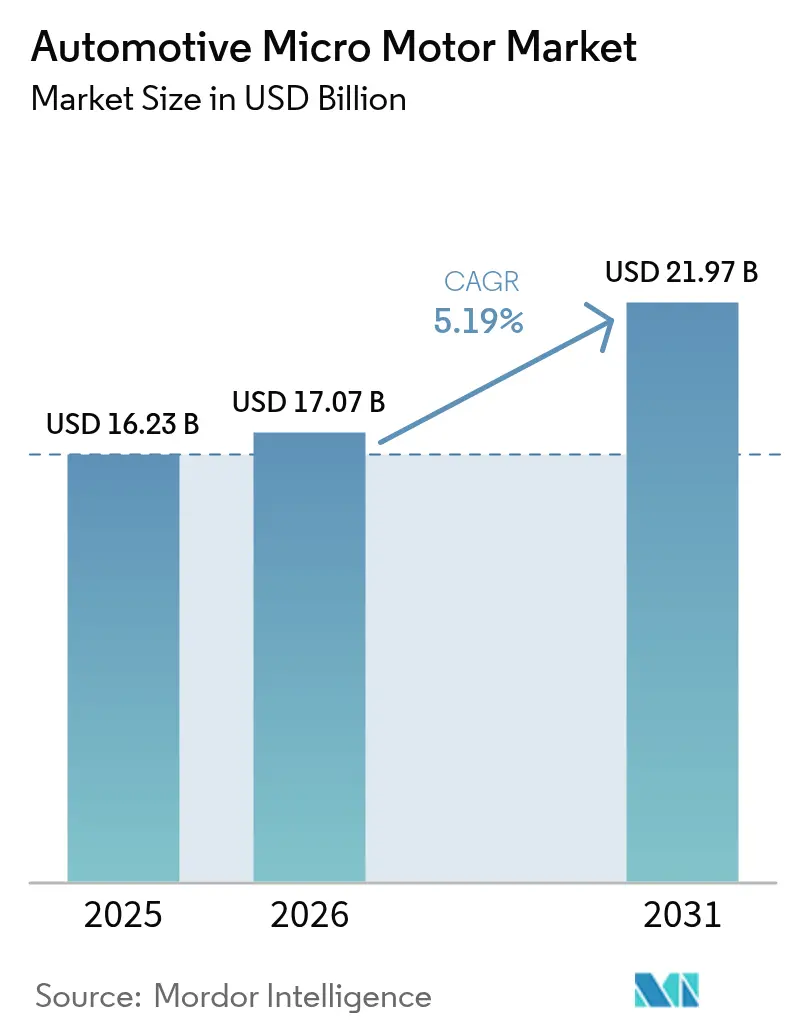
| Market Size (2026) | USD 17.07 Billion |
| Market Size (2031) | USD 21.97 Billion |
| Growth Rate (2026 - 2031) | 5.19% CAGR |
| Fastest Growing Market | Asia-Pacific |
| Largest Market | Asia Pacific |
| Market Concentration | Medium |
Major Players
*Disclaimer: Major Players sorted in no particular order Image © Mordor Intelligence. Reuse requires attribution under CC BY 4.0. |
|
Automotive Micro Motor Market Analysis by Mordor Intelligence
Automotive micromotor market size in 2026 is estimated at USD 17.07 billion, growing from 2025 value of USD 16.23 billion with 2031 projections showing USD 21.97 billion, growing at 5.19% CAGR over 2026-2031. Gains stem from fast-rising electric-vehicle (EV) volumes, the migration to 48 V mild-hybrid architectures and growing content per vehicle across powertrain, safety and comfort modules. Manufacturers are scaling regional production hubs to meet local sourcing rules; Nidec alone earmarked more than USD 7 billion for expanded E-Axle capacity to capture additional automotive micromotor market share. Asia-Pacific remains the demand epicentre, helped by China’s export leadership, while higher-voltage platforms spur the fastest adoption of brushless motor technologies in North America and Europe.
Key Report Takeaways
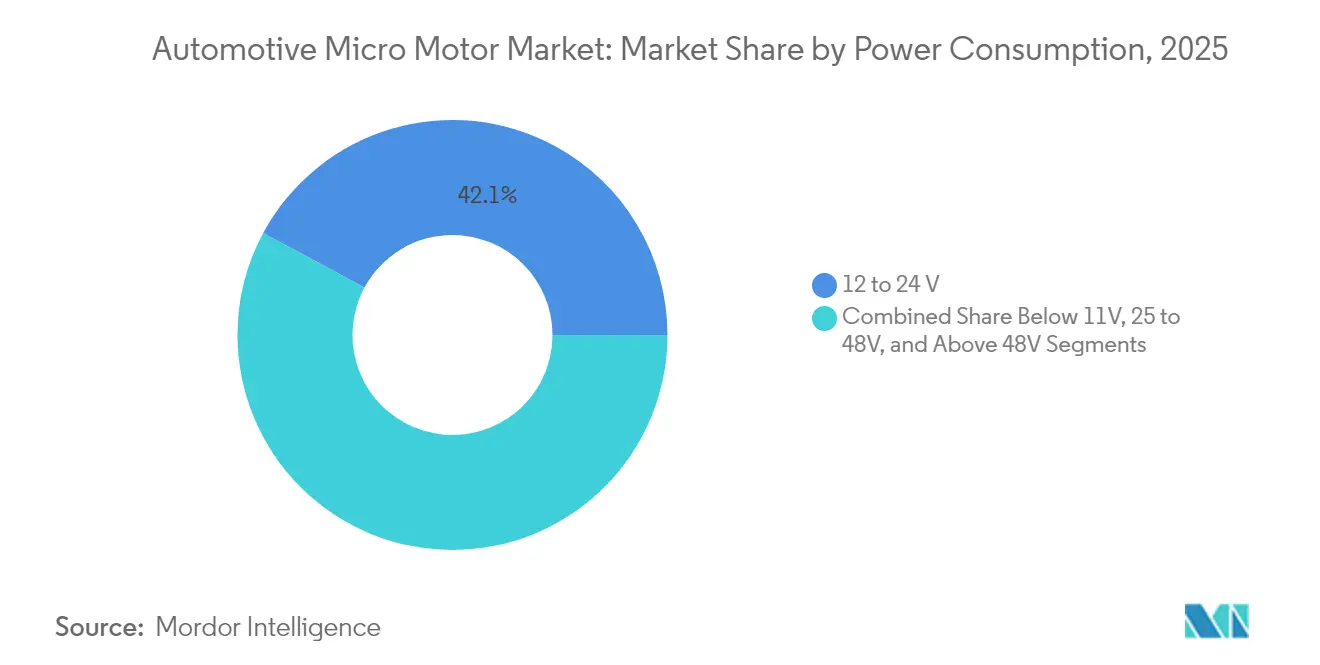
- By power consumption, the 12-24 V segment led with 42.14% of 2025 automotive micromotor market share; More than 48 V systems post the highest 5.61% CAGR through 2031.
- By motor type, DC motors held 59.10% revenue share in 2025, while AC designs are projected to expand at 6.29% CAGR to 2031.
- By technology, brushless motors commanded 53.74% share of the 2025 automotive micromotor market size and are growing at a 5.32% CAGR.
- By application, powertrain and drivetrain accounted for 33.10% revenue in 2025; safety & ADAS modules are advancing fastest at 5.38% CAGR.
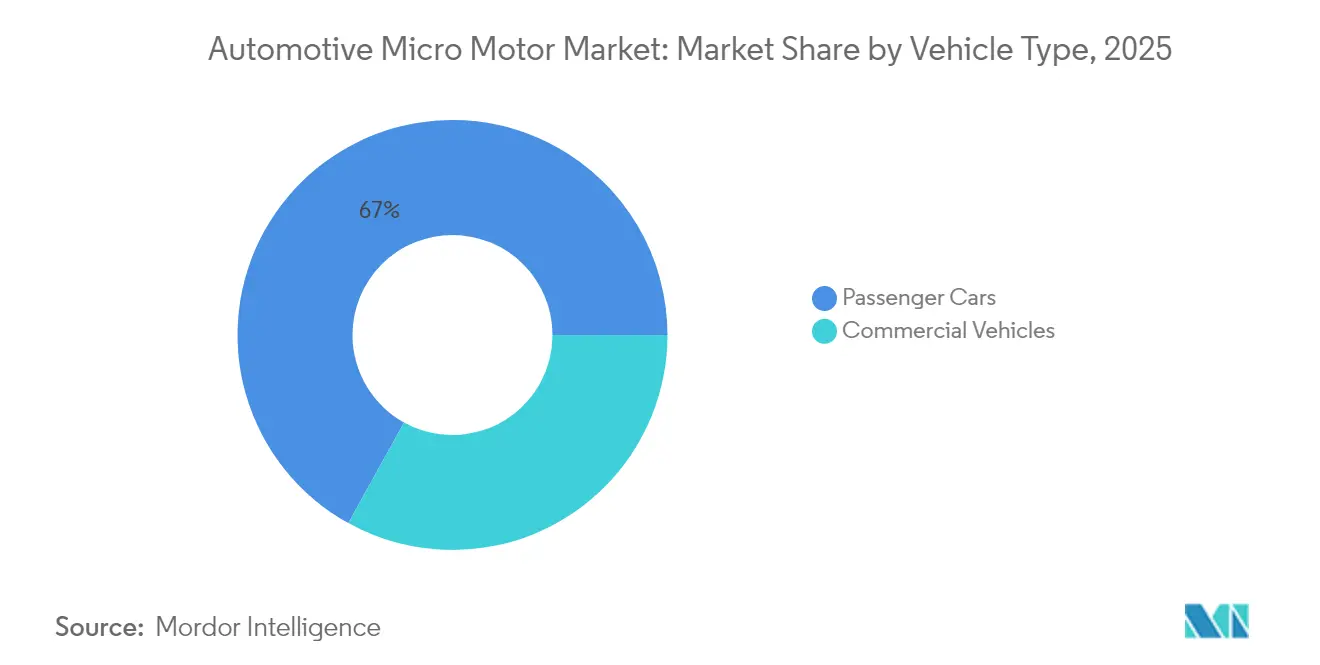
- By vehicle type, passenger cars controlled 66.95% share in 2025, yet commercial vehicles record the quickest 5.57% CAGR on fleet electrification.
- By sales channel, OEM shipments represented 71.60% of revenue in 2025, whereas the aftermarket rises at 6.12% CAGR on replacement demand.
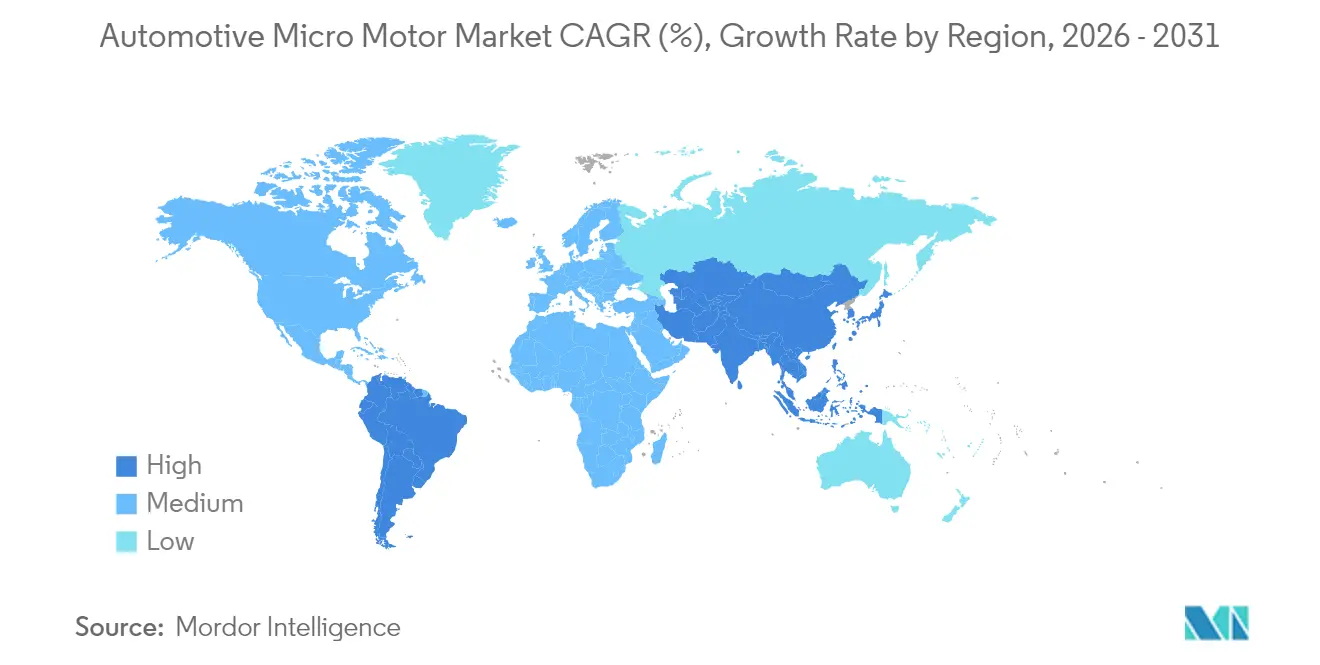
- By geography, Asia-Pacific captured 48.10% of 2025 revenue and is set to grow at 6.03% CAGR, outpacing all other regions.
Note: Market size and forecast figures in this report are generated using Mordor Intelligence’s proprietary estimation framework, updated with the latest available data and insights as of 2026.
Global Automotive Micro Motor Market Trends and Insights
Drivers Impact Analysis*
| Driver | (~) % Impact on CAGR Forecast | Geographic Relevance | Impact Timeline |
|---|---|---|---|
| Surge in EV Production Volumes | +2.1% | Global, with APAC leading adoption | Medium term (2-4 years) |
| Rise in 48V Mild-Hybrid Architectures | +1.8% | North America & Europe, expanding to APAC | Medium term (2-4 years) |
| Growing Demand for Luxury & Premium Interiors | +1.2% | Global, concentrated in developed markets | Long term (≥ 4 years) |
| Vehicle Lightweighting & Component Miniaturisation Push | +0.9% | Global, driven by efficiency regulations | Long term (≥ 4 years) |
| Integration in Active Aerodynamics Systems | +0.6% | Europe & North America premium segments | Medium term (2-4 years) |
| Proliferation of Cabin Wellness Features | +0.4% | Luxury segments in developed markets | Long term (≥ 4 years) |
| Source: Mordor Intelligence | |||
Surge in EV Production Volumes
Global EV shipments continue to outpace overall light-vehicle growth, and each pure battery model relies on dozens of auxiliary micromotors for thermal management, aerodynamics, steering, braking and battery-pack cooling. Assembly Magazine forecasts a fourfold jump in traction-motor output to more than 120 million units by 2034, a trend that cascades into parallel demand for smaller motors across sub-systems. China’s rise to 4.91 million vehicle exports in 2023, surpassing Japan, reflects this shift and concentrates much of the automotive micromotor market in the region. Higher 800 V architectures in premium EVs further raise the performance bar for micromotor control electronics built around silicon-carbide devices, pushing suppliers toward robust, high-frequency driver modules[1]"Cost of Semiconductor Chips Per Vehicle to Double to $1200 by 2030 Due to Tech Advancement: NITI Aayog," Economic Times, economictimes.indiatimes.com.
Rise in 48V Mild-Hybrid Architectures
Moving from traditional 12 V electrics to 48 V boards allows automakers to cut fuel use by up to 15% while unlocking new micromotor applications in active suspension, start-stop and electric superchargers. CLEPA projects 48 V systems in one out of every ten new cars by 2025. The accompanying 48 V battery segment is anticipated to climb, giving the automotive micromotor market a sizeable design-in opportunity. Tesla’s adoption of 48 V wiring in the Cybertruck accelerates industry conversion, although legacy manufacturers must overhaul harnesses, connectors and validation tools to cope with higher voltages[2]"48-V Systems: What You Need to Know as Automakers Say Goodbye to 12 V", Electronic Design, electronicdesign.com.
Growing Demand for Luxury & Premium Interiors
Premium models integrate multiple zone-climate blowers, haptic seats and adaptive lighting arrays, each driven by precision micromotors that ensure silent operation and extended life cycles. Global shipments of vehicles priced above USD 80,000 continue to climb as affluent consumers prioritise cabin technology. Electronics now account for a rising share of build cost, encouraging automakers to add ionisers, scent dispensers and active noise-cancellation modules powered by compact brushless designs. Tier-1 suppliers address growing interior complexity by developing modular motor platforms that share stator designs across seat, steering-column and HVAC actuators, improving scale economics and time-to-market.
Vehicle Lightweighting & Component Miniaturisation Push
Stringent efficiency regulations prompt OEMs to trim vehicle mass, doubling demand for lightweight polymers, aluminium windings and carbon-nanotube coils in micromotor assemblies. Korea Institute of Science and Technology demonstrated a nanotube motor that cuts rotor weight while boosting power density, an innovation with direct implications for space-constrained EV modules. CompositesWorld estimates automotive composites revenue will double by 2032 as suppliers substitute steel housings with high-strength thermoplastics. Vitesco’s 2024 trend review highlights aluminium windings that shrink package size without sacrificing torque, a feature pivotal to next-generation brushless platforms.
Restraints Impact Analysis*
| Restraint | (~) % Impact on CAGR Forecast | Geographic Relevance | Impact Timeline |
|---|---|---|---|
| Up-Trend in Rare-Earth Magnet Prices | -1.1% | Global, with supply concentrated in China | Short term (≤ 2 years) |
| Constant Tech Upgrades Inflating Unit Costs | -0.8% | Global, affecting all market segments | Medium term (2-4 years) |
| Tight Tolerance Specs Raising Qualification Costs | -0.5% | Global, particularly in premium segments | Medium term (2-4 years) |
| Emerging Piezo-Actuator Substitutes | -0.3% | Developed markets with advanced technology adoption | Long term (≥ 4 years) |
| Source: Mordor Intelligence | |||
Up-trend in Rare-Earth Magnet Prices
Permanent-magnet pricing volatility is the most acute cost challenge for automotive micromotor suppliers. Neodymium spot values slid 42% over the past year, yet long-term supply risk looms as China tightens export controls. Vehicle programmes already report production pauses, such as Suzuki’s Swift line in Japan, when magnet shipments stalled. Industry players are diversifying sourcing: Nidec signed a 2025 deal to adopt Noveon Ecoflux magnets produced in the United States, buffering currency and geopolitical shocks.
Constant Tech Upgrades Inflating Unit Costs
Semiconductor content per vehicle is set to double to roughly USD 1,200 by 2030 as powertrain, ADAS and infotainment systems expand, pushing up micromotor controller prices. Rising electric steel prices have elevated motor costs 35–40% since 2020, narrowing supplier margins. Meanwhile, stricter qualification protocols can extend mould validation to eight months and USD 20,000 per tool revision, delaying product launches and boosting development spend.
*Our forecasts treat driver/restraint impacts as directional, not additive. The impact forecasts reflect baseline growth, mix effects, and variable interactions.
Segment Analysis
By Power Consumption: 48 V Systems Drive Voltage Migration
The 12 to 24 V class held 42.14% of the 2025 automotive micromotor market share, reflecting legacy electrical architectures across the light-vehicle parc. Higher-voltage (More than 48 V) segments, however, register the fastest 5.61% CAGR as OEMs adopt mild-hybrid and 800 V EV drivetrains for efficiency gains. This shift enlarges the automotive micromotor market size for high-torque brushless units paired with low-gauge wiring harnesses, cutting resistive losses and easing thermal loads. Tesla’s 48 V harness rollout underscores broad industry alignment on the next electrical standard.
CLEPA confirms that 48 V technology can trim fuel use by up to 15%, accelerating its inclusion in European CO₂-compliance strategies. Suppliers therefore scale modular stator families that cover 24 V blower motors through 400 V traction auxiliaries, maximising platform reuse. Emerging low-power (Less than 11 V) niches remain relevant for sensor nodes yet represent a limited portion of revenue.


By Motor Type: DC Dominance Faces High-Efficiency AC Challenge
DC motors commanded 59.10% of 2025 revenue thanks to cost-effective designs for window lifts, seat adjusters and HVAC flaps. Nevertheless, AC machines record a robust 6.29% CAGR because variable-speed operation reduces energy draw in steering, braking and coolant pumps. The automotive micromotor market therefore witnesses a balanced portfolio where DC platforms remain viable for on-off actuation, while inverter-driven AC options satisfy efficiency targets in electric power steering.
Nidec’s SynRA line illustrates the push toward synchronous-reluctance architectures that remove rare-earth magnets, boosting supply resilience. Johnson Electric’s FY23/24 sales indicate sustained OEM uptake across both motor types, validating a multi-technology roadmap.
By Technology: Brushless Platforms Lead Reliability Race
Brushless platforms delivered 53.74% of 2025 sales and will outpace brushed systems with a 5.32% CAGR on better efficiency, lower noise and virtually zero maintenance. Integrated driver boards further shrink package size, important for modern cockpit and battery-cooling modules. Brushed motors stay relevant in cost-sensitive aftermarket items but continue to cede ground.
Carbon-nanotube windings unveiled by Korea Institute of Science and Technology signal a new chapter in ultralight brushless designs for weight-critical EV corners. Parallel advances include battery-free magnetic encoders that extend service life by removing onboard cells, a step recently commercialised by Nidec.
By Application: Safety & ADAS Modules Accelerate
Powertrain and drivetrain systems held 33.10% of revenue in 2025, anchored by throttle control, turbo wastegate and transmission valve actuation. Yet safety and ADAS modules log the steepest 5.38% CAGR as radar, lidar and camera cleaning mechanisms rely on precision micro-actuation. The automotive micromotor market also benefits from active grille shutters and ride-height controllers that cut drag and boost range by up to 15%.
Cabin wellness devices such as ionisers and scent dispensers add further volume, particularly in luxury trims. Suppliers respond with sealed, liquid-resistant brushless motors suitable for harsh under-hood and exterior placements, expanding addressable value per vehicle.
By Vehicle Type: Commercial Vehicles Gain Momentum
Passenger cars produced 66.95% of 2025 micromotor revenue, driven by sheer unit volume and rapid feature proliferation. Commercial vehicles post a faster 5.57% CAGR on the electrification of delivery fleets. The automotive micromotor market size linked to electric vans grows as fleet operators install electric refrigeration compressors, hydraulic lift actuators and city-safety sensors.
Mexico’s export of EVs to the United States highlights the North American build-up in both passenger and light-commercial segments. Faster duty-cycle wear in commercial duty drives greater aftermarket demand for high-durability brushless replacements.
By Sales Channel: OEM Contracts Dominate, Aftermarket Expands
OEM channels produced 71.60% of 2025 revenue through direct line-fit contracts that run across multi-year vehicle platforms. The aftermarket grows at 6.12% CAGR as complex electronic subsystems age out, requiring specialised diagnostic and replacement parts. Tier-1s diversify into branded service parts, leveraging production know-how to capture post-warranty spend.
Taiwanese suppliers such as E-Lead Electronics, known for infotainment modules, expand cross-border networks to serve both OEM and independent repair channels, underscoring the automotive micromotor industry’s twin opportunities in first-fit and service cycles.
Geography Analysis
Asia-Pacific generated 48.10% of global revenue in 2025, and its 6.03% CAGR to 2031 keeps the region at the forefront of the automotive micromotor market. Chinese exporters shipped 4.91 million vehicles in 2023, surpassing Japan and consolidating a broad supply base for micromotors, semiconductors and magnets. Nidec plans to raise headcount at its Dalian complex by up to 50%, turning it into the world’s largest EV-motor site capable of one-million-unit output a year. Thailand and Indonesia court fresh investment to create integrated EV supply chains, broadening regional sourcing options.
Europe advances at a steady rate as strict emissions targets spur 48 V roll-outs and premium OEMs adopt active aerodynamics. CLEPA’s promotion of mild-hybrid powertrains and Schaeffler’s 2024 merger with Vitesco bolster local motor expertise. German start-up DeepDrive secured USD 33.5 million to commercialise dual-rotor designs using 50% fewer magnets, highlighting Europe’s push for material-light innovations.
North America is powered by reshoring policies and Tesla-led voltage standardisation. KPS Capital Partners’ EUR 3.5 billion takeover of Siemens’ Innomotics division signals private equity appetite for high-value motor brands.
South America exhibits the highr growth off a smaller base, aided by rising electronics content in Brazilian and Argentine production.

Competitive Landscape
The global micromotor market exhibits a moderate level of concentration, with the leading players collectively commanding a significant portion of the overall revenue. Several key trends and competitive dynamics shape this landscape. The market is characterized by the presence of major players, including Nidec and Johnson Electric, among others. These companies are actively pursuing strategies to strengthen their positions and capitalize on the growing demand for micromotors in various applications, particularly within the electric vehicle (EV) and advanced driver-assistance systems (ADAS) sectors. Traditional motor specialists are facing increased competition from Tier-1 suppliers and electronics manufacturers that are expanding into the micromotor market. Furthermore, private equity firms are actively seeking opportunities to acquire and consolidate micromotor businesses, aiming to create diversified technology portfolios.
Strategically, vertical integration gains traction. Schaeffler’s merger with Vitesco forms a EUR 25 billion entity spanning drivetrain, e-axle and inverter systems. Conifer’s USD 20 million funding will speed magnet-agnostic motors that sidestep rare-earth volatility. Meanwhile, TDK’s piezo-based PowerHap actuators facilitate solid-state haptics, posing a niche substitution threat for traditional rotary units in infotainment controls.
OEM collaboration also intensifies. Magna partnered with NVIDIA to integrate AI-ready central computers, driving demand for high-precision motors in sensor cleaning, radar positioning and active grille systems. Suppliers adopting advanced tolerance-analysis software, exemplified by ZF Electronics, report prototype-cutting cost savings that translate into competitive pricing for automakers.
Automotive Micro Motor Industry Leaders
-
Nidec Corporation
-
Johnson Electric Holdings Limited
-
Mabuchi Motor Co., Ltd.
-
DENSO Corporation
-
Maxon Motor AG
- *Disclaimer: Major Players sorted in no particular order

Recent Industry Developments
- June 2025: Conifer raised USD 20 million to commercialise magnet-agnostic motors and e-powertrains, mitigating rare-earth supply risks.
- June 2025: Korea Institute of Science and Technology introduced carbon-nanotube coils enabling ultra-lightweight brushless motors for EV auxiliaries.
- February 2025: Nidec agreed to source American-made Ecoflux magnets from Noveon, bolstering North-American supply security.


Research Methodology Framework and Report Scope
Market Definitions and Key Coverage
Our study counts every factory-built micro motor rated below 1 kW that is designed into passenger or commercial vehicles for functions such as power windows, HVAC flaps, seat modules, power steering, ADAS camera actuation, and e-axle auxiliaries. It includes brushed and brushless DC, as well as low-power AC designs fitted by original-equipment manufacturers or shipped as identical service parts.
Scope exclusion: industrial micro motors, in-wheel hub drives, and non-automotive aftermarket conversions are ruled out to keep the lens strictly on light-duty and heavy-duty vehicle installations.
Segmentation Overview
-
By Power Consumption
- Below 11 V
- 12 to 24 V
- 25 to 48 V
- Above 48 V
-
By Motor Type
- DC Motor
- AC Motor
-
By Technology
- Brushed Micromotor
- Brushless Micromotor
-
By Application
- Body Electronics (window, seat, mirror)
- Powertrain & Drivetrain Systems
- Chassis & Steering
- Safety & ADAS Modules
- Infotainment & Connectivity
-
By Vehicle Type
- Passenger Cars
- Commercial Vehicles
-
By Sales Channel
- OEM
- Aftermarket
-
By Geography
-
North America
- United States
- Canada
- Rest of North America
-
South America
- Brazil
- Argentina
- Rest of South America
-
Europe
- Germany
- United Kingdom
- France
- Italy
- Spain
- Russia
- Rest of Europe
-
Asia-Pacific
- China
- Japan
- India
- South Korea
- Australia & New Zealand
- Rest of Asia-Pacific
-
Middle East and Africa
- Saudi Arabia
- United Arab Emirates
- Turkey
- South Africa
- Rest of Middle East and Africa
-
North America
Detailed Research Methodology and Data Validation
Primary Research
Mordor analysts interviewed tier-one actuator specialists, micro motor coil suppliers, and EV platform engineers across Asia-Pacific, Europe, and North America. These discussions validated duty-cycle assumptions, brushed-to-brushless migration rates, and region-specific ASP bands that secondary sources could not capture alone.
Desk Research
We began with publicly available production statistics from sources such as OICA, UN Comtrade shipment data for HS 8501 categories, and regional road-worthiness registries; these establish the vehicle pool that ultimately hosts micro motors. Technical papers on 48 V architectures from SAE and JSAE, patent analytics from Questel, and policy releases by the US NHTSA and China MIIT helped us size content growth per vehicle. Company 10-Ks, investor decks, and association portals like CLEPA and MEMA provided average selling price cues and mix shifts. The list above is illustrative; many further documents fed our evidence stack.
Market-Sizing & Forecasting
A top-down build starts with light- and heavy-vehicle production, which we multiply by verified micro motor penetration and average units per vehicle before applying regional ASP matrices. Select bottom-up checks, supplier revenue roll-ups and channel margin cross-checks, flag variance and guide recalibration. Key variables include: 48 V mild-hybrid share, average power windows per model, annual EV output, regulatory mandates for safety actuators, and raw-material indexed copper price trends. Multivariate regression, chosen for its transparency, projects each driver to 2030; scenario analysis around EV adoption feeds our sensitivity bands.
Data Validation & Update Cycle
Outputs face three-layer scrutiny: automated anomaly scans, peer review by a senior analyst, and, where gaps linger, rapid follow-up calls with prior respondents. Models refresh annually, yet major events, tariff shifts and OEM plant closures, trigger interim updates so clients receive the latest perspective.
Why Our Automotive Micro Motor Baseline Commands Reliability
Published figures seldom align because providers differ in scope definitions, variable selections, and refresh timing. By anchoring on vehicle-level installation realities and verifying ASPs directly with supply-chain voices, Mordor delivers a number buyers can trace back to observable levers.
In short, while other publishers either widen or narrow the lens, our disciplined scope, dual-path validation, and yearly refresh give decision-makers a balanced, repeatable baseline they can trust.
Benchmark comparison
| Market Size | Anonymized source | Primary gap driver |
|---|---|---|
| USD 16.23 B (2025) | Mordor Intelligence | |
| USD 17.29 B (2024) | Global Consultancy A | Includes hub motors and small industrial power-tool units, inflating totals |
| USD 2.93 B (2024) | Industry Association B | Counts only sub-100 W DC micro motors, excludes ADAS and comfort modules |
In short, while other publishers either widen or narrow the lens, our disciplined scope, dual-path validation, and yearly refresh give decision-makers a balanced, repeatable baseline they can trust.


Key Questions Answered in the Report
What is the current automotive micromotor market size?
The automotive micromotor market size reached USD 17.07 billion in 2026 and is projected to grow to about USD 21.97 billion by 2031.
Which power-consumption segment leads the automotive micromotor market?
The 12 to 24 V segment leads with 42.14% 2025 share, but Above 48 V platforms register the highest 5.61% CAGR through 2031.
Why are brushless micromotors gaining popularity?
Brushless designs offer higher efficiency, quieter operation, and longer service life, helping them capture 53.74% of 2025 revenue and grow at 5.32% CAGR.
How do rare-earth magnet prices affect micromotor suppliers?
Volatile neodymium and dysprosium prices can raise unit costs and disrupt supply.
Which region dominates automotive micromotor demand?
Asia-Pacific commands 48.10% of global revenue and is expanding at 6.03% CAGR, driven by China’s EV export strength and regional supply-chain depth.
Page last updated on:


