Automotive All-wheel-drive Market Size and Share
Market Overview
| Study Period | 2020 - 2031 |
|---|---|
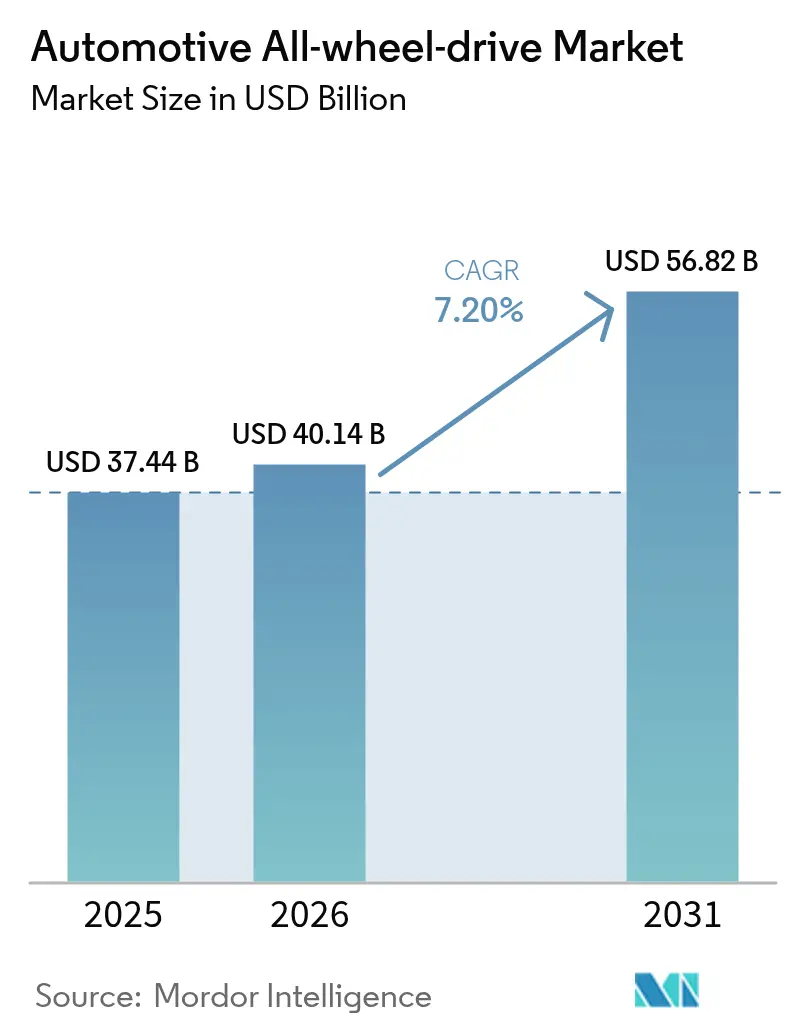
| Market Size (2026) | USD 40.14 Billion |
| Market Size (2031) | USD 56.82 Billion |
| Growth Rate (2026 - 2031) | 7.20% CAGR |
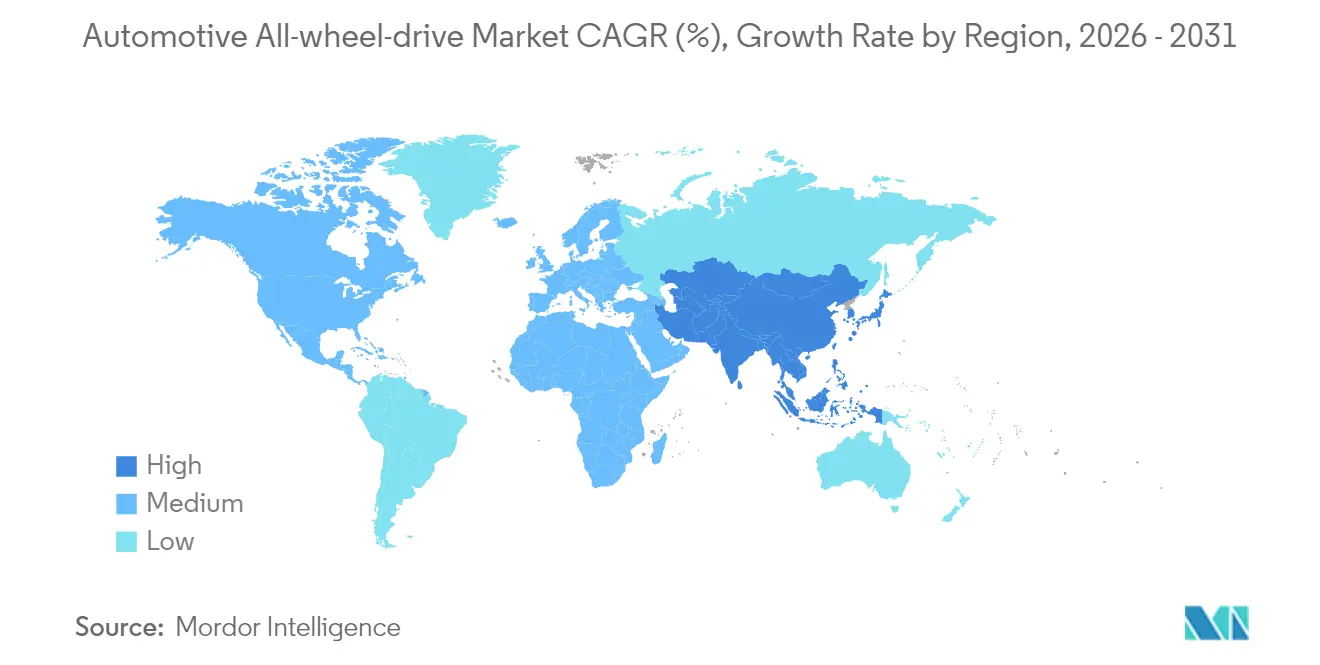
| Fastest Growing Market | Asia Pacific |
| Largest Market | North America |
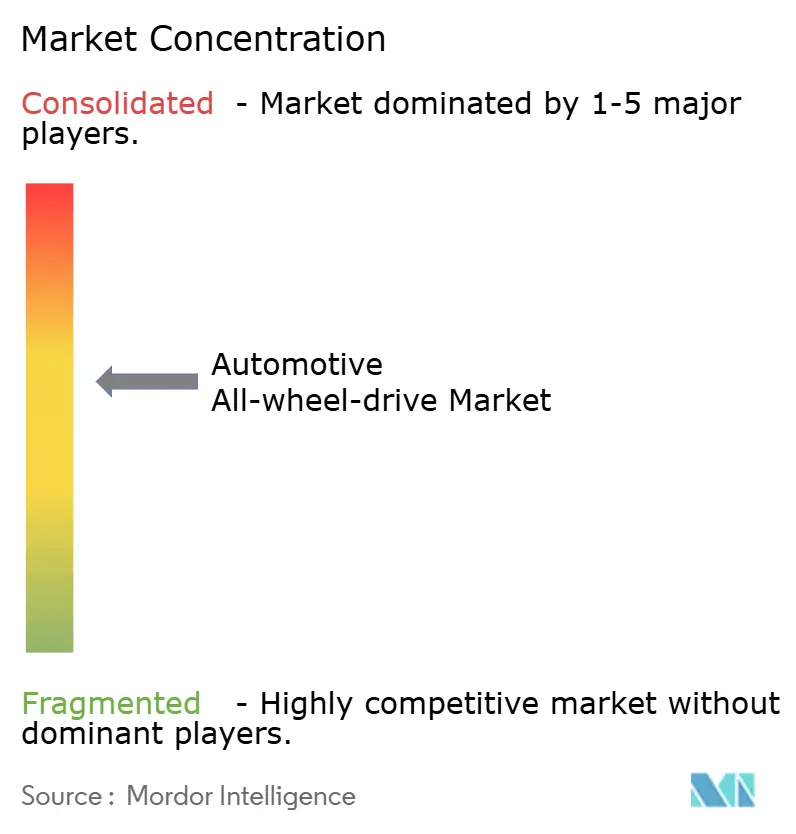
| Market Concentration | Medium |
Major Players *Disclaimer: Major Players sorted in no particular order Image © Mordor Intelligence. Reuse requires attribution under CC BY 4.0. | |
Automotive All-wheel-drive Market Analysis by Mordor Intelligence
The automotive all-wheel drive market size in 2026 is estimated at USD 40.14 billion, growing from 2025 value of USD 37.44 billion with 2031 projections showing USD 56.82 billion, growing at 7.20% CAGR over 2026-2031. Strengthening safety mandates, rapid SUV and crossover uptake, and the maturing economics of dual-motor electrified drivelines together underpin this expansion. OEMs now prioritize traction management integration from the earliest platform stages because advanced driver-assistance systems depend on predictable torque delivery for optimal crash-avoidance performance. Electrification also removes long-standing mechanical cost penalties by replacing transfer cases and shafts with software-controlled e-motors. Supply-chain re-engineering around rare-earth magnets and power semiconductors is becoming pivotal as AWD content per vehicle rises. Competitive dynamics increasingly reward vertically integrated suppliers that fuse driveline hardware with over-the-air software services, transforming AWD from a one-time hardware feature into a recurring revenue channel for data-driven performance upgrades.
Key Report Takeaways
- By vehicle type, passenger cars led with 65.12% of the automotive all-wheel drive market share in 2025, while commercial vehicles are projected to grow at a 7.75% CAGR through 2031.
- By propulsion, internal combustion engines accounted for 83.60% of the automotive all-wheel drive market size in 2025; battery electric vehicles record the strongest outlook at a 9.95% CAGR to 2031.
- By system type, part-time manual systems held a 59.10% share of the automotive all-wheel drive market size in 2025, whereas electric AWD is advancing at an 8.72% CAGR.
- By component, transfer cases commanded 36.30% revenue in 2025, and control units with embedded software are expanding at a 9.55% CAGR.
- By sales channel, the OEM-installed segment accounted for 91.10% of the automotive all-wheel drive market size in 2025; the aftermarket retrofit will record the strongest outlook at a 8.96% CAGR.
- By geography, North America captured 42.80% of the automotive all-wheel drive market share in 2025; Asia Pacific is growing fastest at an 8.33% CAGR.
Note: Market size and forecast figures in this report are generated using Mordor Intelligence’s proprietary estimation framework, updated with the latest available data and insights as of 2026.
Global Automotive All-wheel-drive Market Trends and Insights
Drivers Impact Analysis*
| Driver | ( ~ ) % Impact on CAGR Forecast | Geographic Relevance | Impact Timeline |
|---|---|---|---|
| Soaring SUV and CUV Demand Worldwide | +1.8% | Global, strongest in North America and Asia Pacific | Medium term (2-4 years) |
| Electrification-Driven Adoption of Dual-Motor e-AWD | +1.5% | Global, led by China and Europe | Long term (≥ 4 years) |
| Tightening Crash-Avoidance and Traction Safety Mandates | +1.2% | North America and EU, expanding to Asia Pacific | Short term (≤ 2 years) |
| Consumer Shift to Performance Handling in Premium Segments | +0.9% | North America, Europe, premium Asia markets | Medium term (2-4 years) |
| Climate Volatility Prompting OEM AWD Standardization | +0.8% | Global, emphasis on climate-vulnerable regions | Medium term (2-4 years) |
| OTA-Enabled Software Torque-Vectoring Architectures | +0.7% | Global, concentrated in connected-vehicle markets | Long term (≥ 4 years) |
| Source: Mordor Intelligence | |||
Soaring SUV and CUV Demand Worldwide
Global SUV and crossover output is forecast to hit 28 million units by 2030, and the share fitted with AWD is expected to climb from 45% in 2025 to 65% as traction systems shift from optional to default packaging. Buyers increasingly view AWD as a psychological safety premium even when driving predominantly on paved roads. Chinese brands now bundle AWD with competitive base pricing, lowering the historical cost barrier in emerging markets. OEMs frequently pair AWD with bundled ADAS suites, reinforcing safety credentials and boosting net margins. The utility mindset of consumers sustains year-round demand, making the automotive all-wheel drive market less dependent on winter seasonality.
Electrification-Driven Adoption of Dual-Motor e-AWD
Dual-motor BEVs achieve 9% better energy efficiency than single-motor layouts using add-on mechanical AWD according to SAE testing [1]SAE International, “Energy Efficiency Assessment of Dual-Motor AWD BEVs,” sae.org. Eliminating shafts and transfer cases cuts weight and unlocks precise torque control. Commercial operators benefit from lower maintenance and regenerative braking on all axles. Hyundai’s new hybrid platform illustrates how e-AWD bridges ICE and full BEV architecture while containing costs.
Tightening Crash-Avoidance and Traction Safety Mandates
The U.S. Federal Motor Vehicle Safety Standard 127 mandates automatic emergency braking on all light vehicles by September 2029 [2]U.S. National Highway Traffic Safety Administration, “FMVSS 127 Notice of Final Rule,” nhtsa.gov. Europe’s General Safety Regulation II took effect in July 2024 with similar requirements, encouraging integration of AWD so sensors function consistently across diverse road conditions. Insurers already reward AWD-equipped models with premium discounts, accelerating uptake. For fleet operators, the compliance cost of retrofitting two-wheel-drive vehicles is higher than specifying factory AWD, reinforcing demand in the commercial segment.
Consumer Shift to Performance Handling in Premium Segments
AWD installation rates in premium cars have exceeded 80% after a sharp rise from below 50% five years earlier. Younger luxury buyers prize dynamic handling over traditional comfort features. Electrified torque-vectoring further enhances engagement and lets OEMs monetize software performance packs post-sale. Mainstream brands mirror this strategy with sport-oriented AWD trims that encroach on traditional luxury territory, bolstering the automotive all-wheel drive market.
Restraints Impact Analysis*
| Restraint | ( ~ ) % Impact on CAGR Forecast | Geographic Relevance | Impact Timeline |
|---|---|---|---|
| Higher BOM Cost and Fuel/Energy Penalty vs 2WD | -1.1% | Global, Price-sensitive Markets | Short term (≤ 2 years) |
| Magnet and Semiconductor Supply Bottlenecks for E-actuators | -0.9% | Global, High Exposure to Chinese Supply | Short term (≤ 2 years) |
| Range-Loss Concern in Battery EVs | -0.8% | Global EV markets, Regions with Sparse Charging | Medium term (2-4 years) |
| Autonomous-Driving Shift toward Efficiency-Optimized Drivelines | -0.6% | Advanced AV Deployment Zones | Long term (≥ 4 years) |
| Source: Mordor Intelligence | |||
Higher BOM Cost and Fuel/Energy Penalty vs 2WD
Traditional AWD adds USD 1,500–3,000 to build cost and reduces ICE fuel economy by roughly 1–2 mpg according to Argonne simulations [3]Argonne National Laboratory, “Cost and Fuel Economy Impact of AWD on New Vehicles,” anl.gov. BEV range drops 10–15% in dual-motor versions, as demonstrated by the Hyundai Ioniq 5 data sheet. Manufacturers often convert AWD into standard equipment to dilute cost, yet this raises entry prices in value-focused segments. Battery prices continue to fall, but the near-term penalty remains a sales hurdle in emerging markets.
Magnet and Semiconductor Supply Bottlenecks for e-Actuators
China’s 2025 export restrictions on rare earth magnets disrupted European assembly lines and prompted warnings of production stoppages in North America. Electric AWD motors depend on neodymium-iron-boron magnets, while control units require specialized microcontrollers. The Alliance for Automotive Innovation highlighted potential shutdowns owing to China’s 90% share of global rare-earth refining. OEMs are pursuing localized mining, magnet recycling, and chip dual-sourcing, but new capacity will take several years.
*Our forecasts treat driver/restraint impacts as directional, not additive. The impact forecasts reflect baseline growth, mix effects, and variable interactions.
Segment Analysis
By Vehicle Type: Passenger Cars Lead, Commercial Fleets Accelerate
Passenger cars captured 65.12% of the automotive all-wheel drive market share in 2025, illustrating how SUVs, crossovers, and increasingly AWD-equipped sedans have moved traction management from niche option to mainstream expectation. OEMs pair AWD with bundled safety and infotainment packages, boosting transaction prices while satisfying regulatory test cycles that reward predictable torque delivery. Consumers value the year-round confidence AWD offers on wet or icy roads, and insurers often reflect that benefit in lower premiums, reinforcing adoption even in temperate regions. Premium marques also use software-defined torque vectoring to differentiate ride dynamics across trim levels, turning AWD capability into an experiential selling point that supports higher residual values.
Commercial vehicles post the fastest expansion at a 7.75% CAGR through 2031 as parcel, utility, and emergency fleets adopt AWD to ensure mission-critical uptime under varied payloads and weather conditions. Electrified axles simplify installations by eliminating transfer cases, lowering maintenance downtime, and meeting zero-emission mandates spreading across large urban centers. Fleet telematics confirm that electric AWD reduces wheel-spin-related tire wear and enhances regenerative braking efficiency, improving total cost of ownership despite higher upfront prices. Government incentives for low-emission commercial transport and stricter safety audits further accelerate specification rates, positioning AWD as a core requirement for future fleet procurement cycles.


By Propulsion Type: Electrification Redraws Cost–Benefit Lines
Internal combustion engines still represented 83.60% of the automotive all-wheel drive market size in 2025, but battery-electric powertrains are rising at a 9.95% CAGR as dual-motor layouts erase transfer-case costs and sharpen torque accuracy. ICE-centric platforms increasingly embed electric front or rear modules to offer hybrid AWD, future-proofing investments against tightening emissions rules. Reduced battery prices and government incentives jointly narrow the total-cost-of-ownership gap, prompting OEMs to launch AWD-equipped BEVs across mainstream price bands.Fuel-cell initiatives indicate fresh commercial potential: BMW’s collaboration with Toyota on a 2028 hydrogen SUV aims to pair long-range capability with electric AWD for heavy-duty or cold-weather routes. Dual-motor architectures also open software monetization paths, letting automakers sell performance upgrades over the air. In markets where carbon penalties inflate ICE running costs, these electrified systems gain further momentum, positioning e-AWD as the new baseline for traction, efficiency, and compliance.
By System Type: Software Overtakes Mechanical Complexity
Part-time manual systems remained volume leaders at 59.10% of the automotive all-wheel drive market size in 2025, thanks to affordability and straightforward servicing, particularly in light-duty commercial fleets. Full-time automatic solutions appeal to comfort-oriented consumers who value seamless engagement, and active mechanical vectoring adds electronic clutches to refine torque distribution under dynamic driving. The steady evolution of clutch designs keeps mechanical architectures relevant in cost-sensitive segments.Electric AWD, advancing at an 8.72% CAGR, delivers the sharpest growth as premium EVs shift toward pure software torque-vectoring that can be recalibrated through OTA updates. This capability transforms driveline hardware into an updatable service, creating an annuity stream for OEMs through subscription driving modes. Software-first architectures also shorten development cycles because engineers adjust algorithms instead of re-engineering hardware, a decisive advantage as model refresh intervals accelerate.
By Component: Electronic Control Units Capture Value
Transfer cases still generated 36.30% of component revenue in 2025, underlining their critical role in mechanical AWD systems installed across pickup trucks and heavy SUVs. However, their growth outlook is limited as electric axles and skateboard chassis remove central shafts and reduce part counts. Prop-shaft demand will therefore plateau, except where retrofit kits sustain niche mechanical upgrades in certain commercial fleets.Conversely, ECU- and software-driven subsystems are expanding at a 9.55% CAGR because predictive algorithms now orchestrate traction, braking, and stability functions in a single control domain. Intellectual property embedded in control firmware has become the principal competitive differentiator, allowing suppliers to command premium margins versus commodity metal castings. Vendors able to co-design embedded code, cloud analytics, and cybersecurity layers with OEM engineering teams are best positioned to capture future value as AWD functionality migrates from mechanical finesse to digital intelligence.

By Sales Channel: OEM Fitment Dominates, Aftermarket Finds Niches
Factory installation captured 91.10% of AWD sales in 2025 as high levels of electronics integration and warranty considerations keep driveline decisions within the automaker’s design authority. Tight coupling among traction control, power electronics, and ADAS subsystems makes post-sale modification increasingly complex. As OTA capabilities expand, OEMs can optimize driveline performance remotely, further reducing the incentive for aftermarket solutions.Even so, the aftermarket segment records a 8.96% CAGR, anchored in fleet retrofits and ICE-to-EV conversions that demand specialized AWD kits. Retrofitters succeed when they supply comprehensive solutions—mounting hardware, control software, and safety re-certification—rather than piecemeal parts. Growth hotspots include off-road recreation, armored vehicles, and rural delivery trucks where enhanced traction materially extends service life without requiring an entirely new vehicle purchase.
Geography Analysis
North America retained 42.80% of the automotive all-wheel drive market in 2025 with robust demand from pickups, SUVs, and fleet segments that confront snow, mixed terrain, and insurance rating incentives. U.S. regulators coupling AWD with mandated safety technologies reinforce uptake. Canada exhibits the highest AWD penetration among light vehicles because winter traction is a baseline expectation.Asia Pacific is the fastest-growing region at an 8.33% CAGR. Chinese OEMs embed AWD into mainstream exports that undercut traditional two-wheel-drive competitors on price, reshaping global perceptions of cost-effective traction. India’s introduction of the Maruti Suzuki e-Vitara, the country’s first mass-market AWD EV, highlights the democratization of advanced driveline capability. South Korea continues to scale e-AWD across Hyundai and Kia portfolios, while Japan leverages hybrid AWD heritage for global deployments.Europe shows steady but less dramatic growth, with electrified AWD as a favored route to meet Euro 7 emission goals while preserving performance. The continent’s premium marques differentiate through fine-grained torque vectoring, integrated with ADAS aligned to General Safety Regulation II. South America and Africa remain smaller today yet illustrate rising adoption on the back of infrastructure upgrades and import duty reductions that lower retail prices for AWD crossovers.

Regulatory Landscape
All-wheel-drive (AWD) demand is being shaped less by AWD-specific rules and more by vehicle-wide safety, emissions, and software/type-approval regimes that depend on predictable traction and tightly integrated control systems. In the European Union, the General Safety Regulation II took effect in July 2024, raising the baseline for safety functions that benefit from stable torque delivery, while UNECE UN Regulation No. 168 on Real Driving Emissions (RDE) entered into force on 26 September 2025, putting additional pressure on OEMs to manage drivetrain efficiency under real-world conditions.
In 2026, UNECE WP.29 continued advancing proposals for regulated automated driving systems (ADS) and related vehicle performance topics, alongside EU coordination of positions at WP.29 (including Council Decision (EU) 2026/1411). At the same time, US greenhouse-gas and CAFE standards for model years 2024 through 2026 remain a compliance anchor, supporting efficiency-focused drivetrain choices and accelerating the shift from mechanical AWD content toward electrified and software-controlled architectures that can meet safety and emissions targets without disproportionate fuel or energy penalties.
Value Chain Analysis
The AWD value chain begins with raw materials and electronic inputs (steel/aluminum castings, bearings, friction materials, and especially semiconductors and rare-earth magnets for e-axles and e-differentials). These feed into Tier-2 machining and electronics manufacturing, followed by Tier-1 integration of transfer cases, differentials/couplings, actuators, and control units with embedded software. Tier-1 suppliers such as BorgWarner, ZF Friedrichshafen, Magna International, JTEKT, and American Axle & Manufacturing deliver engineered modules to OEM platforms, where calibration, ADAS/stability integration, and validation account for most development effort. Distribution is dominated by OEM-installed fitment (91.10% of 2025 sales), while aftermarket retrofit is concentrated in fleets and specialized use cases that can support complete kits and re-certification.
Electrification is reorganizing the chain around software-defined torque management and e-motor components, increasing exposure to neodymium-iron-boron magnets and automotive-grade power electronics. This dependency showed up in 2025 when China introduced export restrictions (April 2025) that contributed to rare-earth magnet shortages and production disruptions, constraining downstream AWD program ramps. In response, OEMs and suppliers are pursuing dual-sourcing for chips, magnet recycling, and localized supply options, and program wins such as BorgWarner’s eXD projects in China reflect the growing role of electrified differentials and control software in the AWD module stack.
Competitive Landscape
The automotive all-wheel drive market remains moderately concentrated, dominated by BorgWarner, ZF Friedrichshafen, and Magna International, each leveraging decades of mechanical driveline expertise and deep OEM relationships to secure high-volume ICE and hybrid programs. Their portfolios still center on transfer cases, differentials, and coupling systems, but all three have recently increased R&D spending on e-axles and integrated inverter modules to stay relevant as electrification accelerates.
New entrants with software-centric capabilities are reshaping the field. Start-ups focused on inverter algorithms, torque-vectoring code, and cybersecurity sell directly to EV makers that prefer vertically integrated electronics over traditional tier-1 hardware. Technology firms also exploit OTA business models by packaging performance upgrades as subscription services, thereby shifting value capture from one-time hardware sales to recurring revenue streams. These dynamics force legacy suppliers to acquire or partner with embedded software specialists, speeding the convergence of mechanical and digital competencies.
Strategic consolidation underscores the transition. American Axle & Manufacturing’s USD 1.4 billion acquisition of GKN Automotive’s e-drive assets in 2024 signaled a race to assemble full-stack electrified driveline portfolios. Similar moves are likely as suppliers hedge against rare-earth magnet and semiconductor volatility through vertical integration and diversified sourcing. Ultimately, the winners will be those that marry cost-competitive hardware with adaptable software, ensuring AWD platforms can evolve across multiple propulsion cycles and regulatory regimes.
Automotive All-wheel-drive Industry Leaders
BorgWarner Inc.
JTEKT Corporation
GKN Automotive (Melrose)
ZF Friedrichshafen AG
Magna International Inc.
- *Disclaimer: Major Players sorted in no particular order

Market Opportunities and Future Outlook
The largest whitespace is cost-optimized electrified AWD that delivers traction benefits to high-volume platforms without the mass and packaging penalties of conventional transfer cases. Recent product and OEM actions point to low-voltage and hybrid-centric AWD architectures as a near-term pathway. Valeo commenced commercial production of a 48V 2-speed electric axle (with a software-synchronized dog clutch) for Dacia Hybrid-G 150 vehicles in June 2026, and Magna unveiled its DHD REX dedicated hybrid drive in March 2026, positioned to enable temporary electric AWD across B- through E-segment applications. Together, these moves broaden the addressable AWD market beyond premium dual-motor BEVs into mainstream hybrids and range-extended architectures where OEMs balance efficiency targets with year-round traction requirements.
A second opportunity area is software and control-unit value capture as AWD becomes a tightly regulated, type-approved software-defined function integrated with stability control and advanced safety systems. Europe’s July 2024 General Safety Regulation II and the broader UNECE WP.29 direction on regulated automated systems increase the premium on validated torque management, cybersecurity-ready ECUs, and updateable calibration strategies, creating room for suppliers that can provide integrated hardware plus embedded software rather than commodity mechanical parts. At the same time, supply-chain fragility around rare-earth magnets (highlighted by 2025 export restrictions) creates openings for redesigned motor topologies, magnet-thrifty solutions, and recycling-led sourcing models that reduce dependence on constrained inputs while supporting higher AWD content per vehicle.
Recent Industry Developments
- March 2026: Magna International unveiled its DHD REX dedicated hybrid drive system, designed to support a broad range of vehicle segments and enable temporary electric all-wheel drive capability. The platform approach expands AWD implementation options beyond traditional mechanical systems, bringing AWD functionality into hybrid and range-extended electric architectures.
- February 2026: BorgWarner secured its first 48V electric cross differential (eXD) program with a leading Chinese OEM, targeting integration into a 48V electrical/electronic architecture. The award indicates rising OEM interest in electrified torque-management modules that can deliver AWD-related traction benefits with lower-voltage electrification and software-driven control.
- October 2024: BorgWarner extended two transfer case contracts with a North American OEM for electro-mechanical on-demand and electric shift-on-the-fly two-speed transfer cases, with production tied to 2027-2028 truck platforms. The contract extensions reinforce continued demand for high-volume mechanical AWD content in pickups and large SUVs while suppliers fund transitions toward electrified driveline portfolios.


Research Methodology Framework and Report Scope
Market Definition and Coverage
This market covers revenue generated from automotive all-wheel-drive systems and related drivetrain modules that deliver torque to all four wheels in passenger and commercial vehicles, across OEM fitment and replacement demand, and across major regions.
Scope exclusions: It does not count full vehicle sales, financing, insurance, or non-automotive 4WD/AWD uses.
Segmentation Overview
- By Vehicle Type
- Passenger Cars
- Hatchbacks and Sedans
- SUVs and Crossovers
- Commercial Vehicles
- Light Commercial Vehicles
- Heavy Trucks and Buses
- Passenger Cars
- By Propulsion Type
- Internal-Combustion Engine (ICE)
- Hybrid Electric Vehicle (HEV)
- Battery Electric Vehicle (BEV)
- Fuel-Cell Electric Vehicle (FCEV)
- By System Type
- Part-Time/Manual AWD
- Full-Time/Automatic AWD
- Electric/e-AWD (Dual-Motor, Quad-Motor)
- Active Torque-Vectoring AWD
- By Component
- Transfer Case
- Differential (Center, Front, Rear)
- Coupling and Clutch Pack
- Prop-Shaft and Drive Shaft
- Control Unit and Software
- By Sales Channel
- OEM-Installed
- Aftermarket Retrofit
- By Geography
- North America
- United States
- Canada
- Rest of North America
- South America
- Brazil
- Argentina
- Rest of South America
- Europe
- Germany
- United Kingdom
- France
- Italy
- Spain
- Russia
- Rest of Europe
- Asia Pacific
- China
- Japan
- India
- South Korea
- Australia
- Rest of Asia Pacific
- Middle East and Africa
- Saudi Arabia
- United Arab Emirates
- Turkey
- South Africa
- Rest of Middle East and Africa
- North America
Data Sources, Market Sizing, and Validation
Desk Research
Desk research was used to build the baseline demand context and identify model variables that can be checked year over year. We relied on public vehicle production and registration time series, trade and tariff statistics, and technology adoption commentary, so the model was not driven by a single data point.
Common references included public sources such as OICA production statistics, national transport agencies for registrations, UN Comtrade for trade flows, EPA and EU emissions and efficiency rules, and SAE technical papers to understand drivetrain evolution. We also reviewed automaker annual reports and investor decks for AWD penetration commentary, along with reputable automotive press and association websites for platform and powertrain announcements. Paid subscriptions were used selectively for company financials and intelligence, patent databases, and vehicle sales and parc context where they helped cross-check directionality. The sources listed here are illustrative, and many other public and paid references were used to collect, verify, and clarify data points.
Primary Interviews and Surveys
Primary interviews and surveys focused on confirming AWD fitment rates, pricing movement, and the pace of electrification-driven AWD architectures, since those items can differ by region and vehicle class. We spoke with OEM-side contacts, drivetrain and module suppliers, distributors, and service-side experts, and then used their input to test assumptions across APAC, EMEA, and the Americas.
Distribution of primary research fieldwork respondents
| Company type | Respondent position | Region |
|---|---|---|
| Top tier: 27% | CXOs: 13% | APAC: 49% |
| Mid tier: 52% | Functional/Unit leaders: 29% | EMEA: 32% |
| Smaller Players: 21% | Managers: 58% | Americas: 19% |
Market-Sizing & Forecasting
Sizing starts with a top-down build that reconstructs the addressable AWD demand pool from light vehicle production and sales by region, then applies AWD penetration by vehicle mix and propulsion (ICE and electrified). To keep totals realistic, we used selective bottom-up approximations as a cross-check, such as sampled module ASP multiplied by estimated unit volumes for AWD-capable platforms, followed by channel checks on replacement share.
Key inputs that shaped the model included SUV and crossover mix shifts, AWD take-rate by vehicle category, the split between full-time and part-time systems, average system pricing by architecture, and the speed of electrified AWD adoption (including e-axle style solutions). Where granular pricing or take-rate gaps existed for smaller countries, we used proxy markets with similar vehicle mix and income levels, and then corrected them using interview feedback.
Forecasts were produced using scenario analysis supported by short-run time series smoothing on core indicators such as production outlook and penetration trajectories. The final growth path was adjusted only when multiple interviewees aligned on a change driver, including regulatory traction and safety expectations, platform refresh cycles, or cost-down trends for electrified AWD modules.
Data Validation & Update Cycle
Model outputs were checked against independent signals, including regional vehicle output trends, AWD share direction in key nameplates, and import-export movement for relevant drivetrain parts where they were visible in trade data. When the model produced sudden jumps, the underlying assumptions were re-tested, and outliers were flagged for a second analyst review before sign-off.
The work is refreshed annually, with interim updates added when material events occur, such as major platform launches, sharp production shocks, or policy changes that could shift AWD adoption. Before delivery, a final pass is completed to confirm that the latest public data and interview learnings are reflected in the numbers clients receive.
Mordor Intelligence's Automotive All Wheel Drive Market Size Compared With Other Published Estimates
It is normal to see different market sizes for automotive AWD, because publishers pick different year anchors, count different revenue points, and use different assumptions for what is included in an AWD system. Some studies also blend vehicle value with drivetrain value, which can increase totals even when unit volumes are similar.
In our checks, the biggest gaps usually came from whether electrified AWD modules are treated as complete system revenue or only counted when a traditional transfer case and driveline are present, and from whether figures are reported at factory gate versus a broader installed value chain. Refresh timing also matters because production and mix can change quickly, and updated penetration rates can move the total more than the headline CAGR suggests, a spread that becomes clearer when the electrified architecture shift is separated out as done by Mordor Intelligence.
Benchmark comparison
| Source | Market Size | Gaps in Research Methodology |
|---|---|---|
| Mordor Intelligence | USD 40.14 B (2026) | |
| Industry Publisher A | USD 43.16 B (2025) | Uses a different base year and is presented as factory-gate manufacturer revenue, which can shift totals versus models that emphasize installed-system value and a different penetration snapshot. |
| Industry Publisher B | USD 39.58 B (2024) | Anchored to an earlier year and a longer horizon, and the scope may blend more component-level cuts and application splits, which changes how system ASP and electrified AWD content are rolled up. |
Taken together, the spread is mainly explained by the year selected and the revenue point being measured, followed by how electrified AWD content is counted versus traditional mechanical layouts. By keeping assumptions tied to visible production, mix, and take-rate signals, the resulting market value stays traceable to a repeatable set of steps that can be rechecked when conditions change.


Key Questions Answered in the Report
What is the current value of the automotive all-wheel drive market?
The automotive all-wheel drive market size stands at USD 40.14 billion in 2026 and is forecast to reach USD 56.82 billion by 2031.
Why is electric AWD growing faster than mechanical AWD?
Dual-motor electric architectures remove heavy transfer cases, improve energy efficiency by 9%, and enable precise software-based torque control that supports over-the-air upgrades, driving an 8.72% CAGR in electric AWD systems.
Which region is expanding quickest in adopting AWD?
Asia Pacific registers the fastest adoption with an 8.33% CAGR as Chinese automakers standardize AWD on export models and Indian OEMs introduce their first mass-market AWD EVs.
How are tighter safety regulations influencing AWD demand?
U.S. FMVSS 127 and Europe’s General Safety Regulation II mandate advanced crash-avoidance features that perform best with predictable traction; insurers also reward AWD with premium reductions, accelerating factory installation rates.
Page last updated on:


