
Auto Loan Market Size and Share
Market Overview
| Study Period | 2020 - 2031 |
|---|---|
| Market Size (2026) | USD 1.98 Trillion |
| Market Size (2031) | USD 2.88 Trillion |
| Growth Rate (2026 - 2031) | 7.78 % |
| Fastest Growing Market | Asia Pacific |
| Largest Market | Asia Pacific |
| Market Concentration | Medium |
Major Players *Disclaimer: Major Players sorted in no particular order Image © Mordor Intelligence. Reuse requires attribution under CC BY 4.0. | |
Auto Loan Market Analysis by Mordor Intelligence
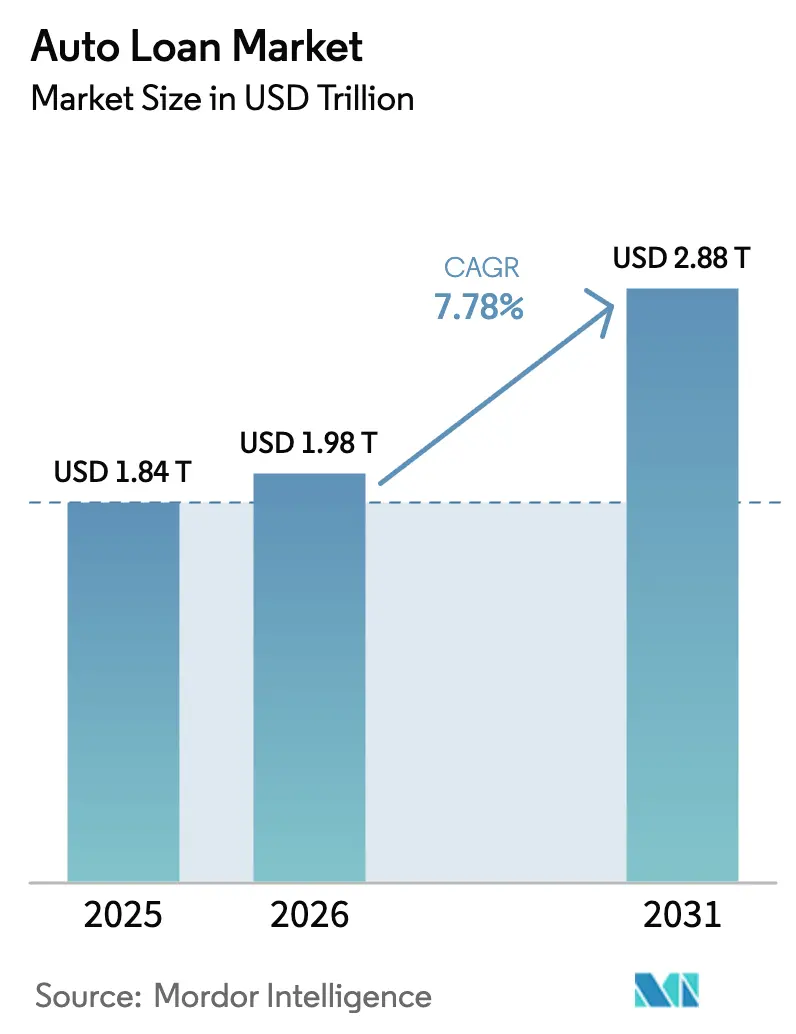
The Auto Loan Market size was valued at USD 1.84 trillion in 2025 and is estimated to grow from USD 1.98 trillion in 2026 to reach USD 2.88 trillion by 2031, at a CAGR of 7.78% during the forecast period (2026-2031).
This sustained growth mirrors the rapid digitization of retail lending, the rise of embedded-finance models across vehicle ecosystems, and the strategic push by original-equipment manufacturers (OEMs) to cement captive-finance capabilities. Lending platforms processed 29% more digital originations year over year in 2025 as consumers migrated from branch‐based to mobile application journeys[1]. OEM captives continue to wield rate-subsidy programs that counter high policy rates, while the sharp 9.59% CAGR in used-vehicle financing underscores affordability constraints. Asia-Pacific anchors demand, holding 33.89% of 2024 originations and leading future growth at 9.72% CAGR, underpinned by China’s down-payment liberalization and middle-class expansion. Intensifying regulatory oversight—such as the Consumer Financial Protection Bureau’s (CFPB) 2024 findings on add-on mis-selling—signals tighter compliance costs but also supports long-term borrower confidence.
Key Report Takeaways
- By vehicle type, passenger vehicles led with 80.75% of the Global auto loan market share in 2025; commercial vehicles are forecasted to accelerate at an 8.62% CAGR through 2031.
- By vehicle model, cars secured 82.30% of the Global auto loan market share in 2025, while motorcycles and scooters are poised for a 9.98% CAGR.
- By ownership, new vehicles captured 57.20% of the Global auto loan market size in 2025, and used vehicles are projected to grow at a 9.21% CAGR to 2031.
- By provider, banks held a 42.05% share of the Global auto loan market size in 2025, whereas fintech lenders are expanding at a 13.72% CAGR—the highest among all provider types.
- By tenure, 3-5-year loans captured a 60.95% share of the Global auto loan market size; loans longer than five years are advancing at a 10.62% CAGR.
Note: Market size and forecast figures in this report are generated using Mordor Intelligence’s proprietary estimation framework, updated with the latest available data and insights as of 2026.
Market Trends and Insights
Drivers Impact Analysis of Auto Loan Market*
| Driver | (~) % Impact on CAGR Forecast | Geographic Relevance | Impact Timeline |
|---|---|---|---|
| Rising demand for passenger vehicles | +1.8% | Global; strongest in Asia-Pacific | Medium term (2-4 years) |
| Quick digital loan processing | +1.5% | North America & Europe | Short term (≤ 2 years) |
| Expansion of used-vehicle financing | +1.2% | North America & Europe | Medium term (2-4 years) |
| Growth of OEM captive finance | +0.9% | Global mature markets | Long term (≥ 4 years) |
| Embedded finance with mobility apps | +0.7% | North America & Asia-Pacific | Long term (≥ 4 years) |
| AI-based credit scoring | +0.6% | Developed markets | Medium term (2-4 years) |
| Source: Mordor Intelligence | |||
Increasing Demand for Passenger Vehicles
Passenger‐vehicle originations contributed 81.23% of the 2024 market share and are growing at an 8.95% CAGR, buoyed by rapid urbanization across China, India, and Southeast Asia. Chinese OEMs are on course for a 33% global share by 2030, up from 21% in 2024, spurring captive-finance penetration in export markets. Electric vehicles (EVs) reinforce this trajectory; Asia accounts for 60% of global EV sales as China targets 45% EV penetration of new sales in 2025[1]. Lenders exploit these trends by tailoring residual-value programs for EVs and offering rate incentives that mirror battery warranties.
Quick Digital Loan Processing
Digital origination volumes grew 165% versus 2020, with single-page applications and soft-credit pulls reducing approval times to under two minutes. Capital One’s Auto Navigator provides pre-approved rates during vehicle search, while Upstart’s AI workflow lets dealers close a deal in less than one minute, automatically delivering FICO Auto Scores and fraud checks[2]. Over 70% of shoppers prefer completing finance steps at home, and dealers report 41% higher close ratios on pre-qualified leads. Platform lenders reap cost efficiencies as automated workflows cut manual underwriting steps and shrink acquisition cost per booked loan.
Expansion of Used-Vehicle Financing
High sticker prices—USD 48,000 average for new models in 2024—are pushing consumers into the used-vehicle channel. The Global auto loan market for used cars grows 9.59% annually as borrowers gravitate toward lower monthly outlays. Federal Reserve research attributes 40% of delinquency growth to larger loan amounts rather than higher coupon rates, stressing the importance of robust residual-value analytics. Specialized lenders refine inspection and valuation protocols to safeguard against hidden mechanical issues and price volatility.
OEM Captive-Finance Growth
Captives deepen penetration by bundling 0% financing and loyalty rebates. GM Financial, for example, posted USD 737 million in Q1 2024 earnings before taxes on retail-credit penetration of 39.9% despite heightened delinquencies. Detroit manufacturers leverage captive arms to counteract elevated benchmark yields, while Stellantis expands U.S. operations to protect dealership throughput. Captives’ data advantage across sales, servicing, and connected-vehicle telematics fuels precise credit‐risk segmentation that traditional banks struggle to match.
Restraints Impact Analysis of Auto Loan Market*
| Restraint | (~) % Impact on CAGR Forecast | Geographic Relevance | Impact Timeline |
|---|---|---|---|
| Rising interest rates | -1.4% | Developed markets | Short term (≤ 2 years) |
| Escalating vehicle prices | -1.1% | North America & Europe | Medium term (2-4 years) |
| Regulatory scrutiny on long-tenor loans | -0.8% | North America & Europe | Medium term (2-4 years) |
| Shift toward vehicle-subscription models | -0.3% | Developed markets | Long term (≥ 4 years) |
| Source: Mordor Intelligence | |||
Rising Interest Rates
Although the Federal Reserve trimmed rates by 25 bps in November 2024, auto APRs remain elevated and weigh on wallet share. Bankrate data confirm that higher policy rates directly translate into more expensive auto loans, especially for subprime tiers. Delinquencies now exceed pre-pandemic peaks, with the Federal Reserve noting performance deterioration across 2022-vintage loans[3]. Lenders are tightening score cutoffs and amplifying the use of alternative data to balance growth and risk.
Escalating Vehicle Prices
The USD 48,000 average transaction price is reshaping affordability math, extending loan tenures beyond five years. The CFPB highlights that negative equity affects more than 10% of new-vehicle borrowers, carrying an average USD 5,073 shortfall at trade-in. Higher principal amounts compress loan-to-value ratios and exacerbate default severity, prompting regulators to question balloon structures and add-on products.
*Our forecasts treat driver/restraint impacts as directional, not additive. The impact forecasts reflect baseline growth, mix effects, and variable interactions.
Auto Loan Market Segment Analysis
By Vehicle Type:
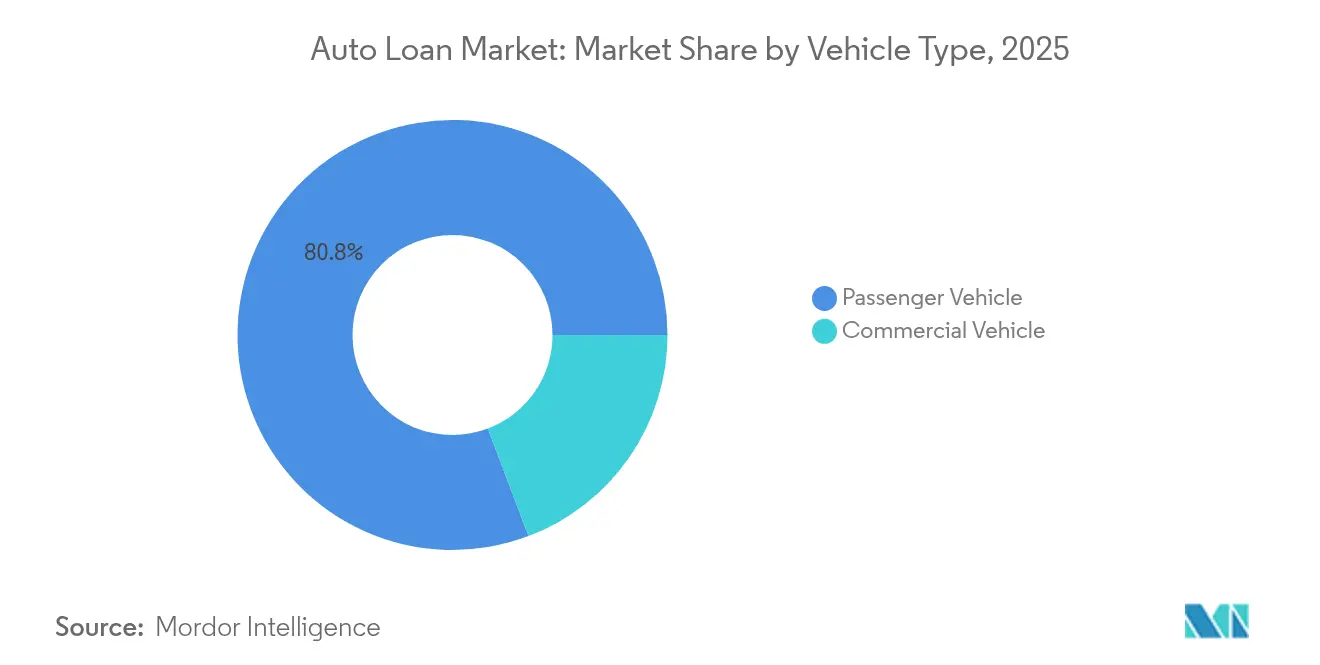
Passenger Dominance Drives Market ExpansionPassenger-vehicle loans accounted for an 80.75% share in the global auto loan market in 2025, and the segment is expected to advance at an 7.46% CAGR, embedding the Global auto loan market in household mobility budgets. The rise of compact SUVs and battery-electric models has broadened borrower profiles, enabling lenders to cross-sell insurance and service contracts. In contrast, commercial-vehicle financing remains cyclical, tied to freight volumes and e-commerce demand. Chinese fleet operators seeking cleaner trucks spur interest in green-finance lines backed by OEM warranties.
The segment contributes materially to the Global auto loan market size because it supports standardized underwriting matrices and robust collateral liquidity. As city congestion policies evolve, lenders develop shared-ownership pilot programs that securitize residual value across multiple users. Commercial-vehicle lenders, meanwhile, deploy telemetry-driven pay-as-you-drive structures that link repayment to mileage and load factors.

By Vehicle Model:
Cars Lead While Two-Wheelers AccelerateCars—hatchbacks, sedans, and SUVs—held 82.30% share in the global auto loan market in 2025, reflecting entrenched consumer preference and ample dealership financing infrastructure. Yet, motorcycles and scooters outpace with a 9.98% CAGR as urban riders seek affordable and nimble transport. Loan-ticket sizes in this sub-segment are lower, but origination volumes are high, contributing meaningfully to the Global auto loan market depth in India and Southeast Asia.
Financiers craft risk-based pricing for two-wheelers, balancing faster depreciation with higher recovery rates. Cargo three-wheelers and pickups are also joining fintech platforms that offer remote KYC and instant lien registration. Cars continue to dominate securitization pools, ensuring secondary-market liquidity and keeping risk premiums compressed relative to micro-mobility loans.
By Ownership:
Used-Vehicle Financing Gains MomentumNew Vehicles captured 57.20% of the Global auto loan market size in 2025, and the used vehicles segment is projected to grow 9.21% a year through 2031. Rising list prices, combined with elevated coupons, have tilted borrowers toward older but more affordable models. Risk models now incorporate telematics-based condition scores and live auction data to fine-tune advance rates.
The Global auto loan market size for used cars is expanding via e-commerce portals that link inspection services with instant credit decisions. Lenders mitigate residual-value risk by requiring GAP insurance and by shortening loan-to-term ratios relative to asset life. Negative-equity exposure is lower than for new cars, but heightened mechanical failure risk necessitates robust warranty partnerships.
By Provider Type:
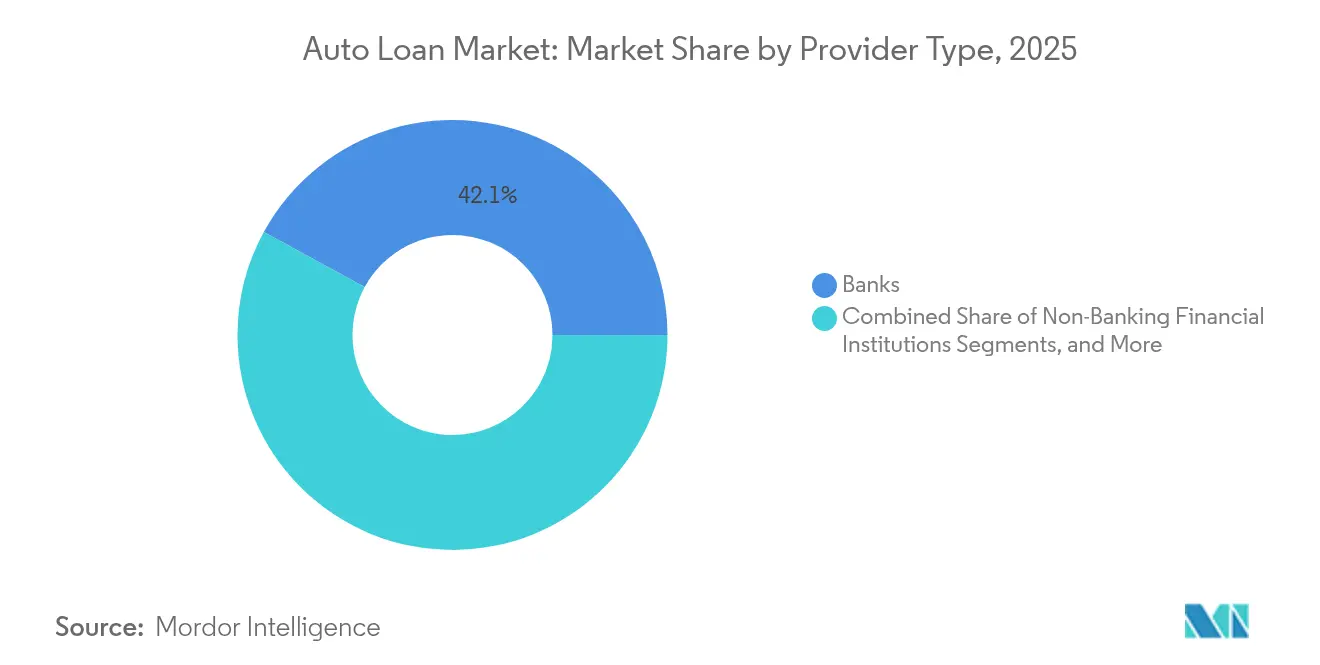
Fintech Disruption Challenges Traditional BankingBanks commanded a 42.05% share in the global auto loan market in 2025, but fintech lenders are scaling at a 13.72% CAGR, reshaping the Global auto loan market through AI-driven underwriting and embedded workflows. Platforms such as Upstart approve 35% more Black and 46% more Hispanic applicants than legacy scorecards, proving the inclusivity upside of alternative data.
Traditional institutions respond with co-branded alliances: Wells Fargo will begin retail financing for Volkswagen, Audi, and Ducati dealerships nationwide in April 2025, leveraging the automaker’s captive-style data while maintaining bank funding advantages. Independent finance companies carve niches in subprime used-vehicle lending, partnering with dealer groups to share default risk.
By Tenure:
Extended Terms Reflect Affordability PressuresContracts of 3-5 years represented 60.95% share in the global auto loan market in 2025, providing a familiar amortization pattern that balances monthly affordability and depreciation exposure. However, loans longer than five years are the fastest expanding cohort at an 10.62% CAGR, evidencing consumer willingness to trade total interest cost for lower monthly payments.
The shift lengthens portfolio-average life and stresses asset-liability management. Lenders hedge with residual-value insurance and price premiums for longer terms. Regulators scrutinize the practice, with the CFPB citing balloon structures that mask payment shocks at maturity. Short-tenor products survive among premium-brand buyers eager to cycle vehicles every 24-36 months, supporting certificated pre-owned supply for used-vehicle financiers.
Geography Analysis
APAC Auto Loan Market
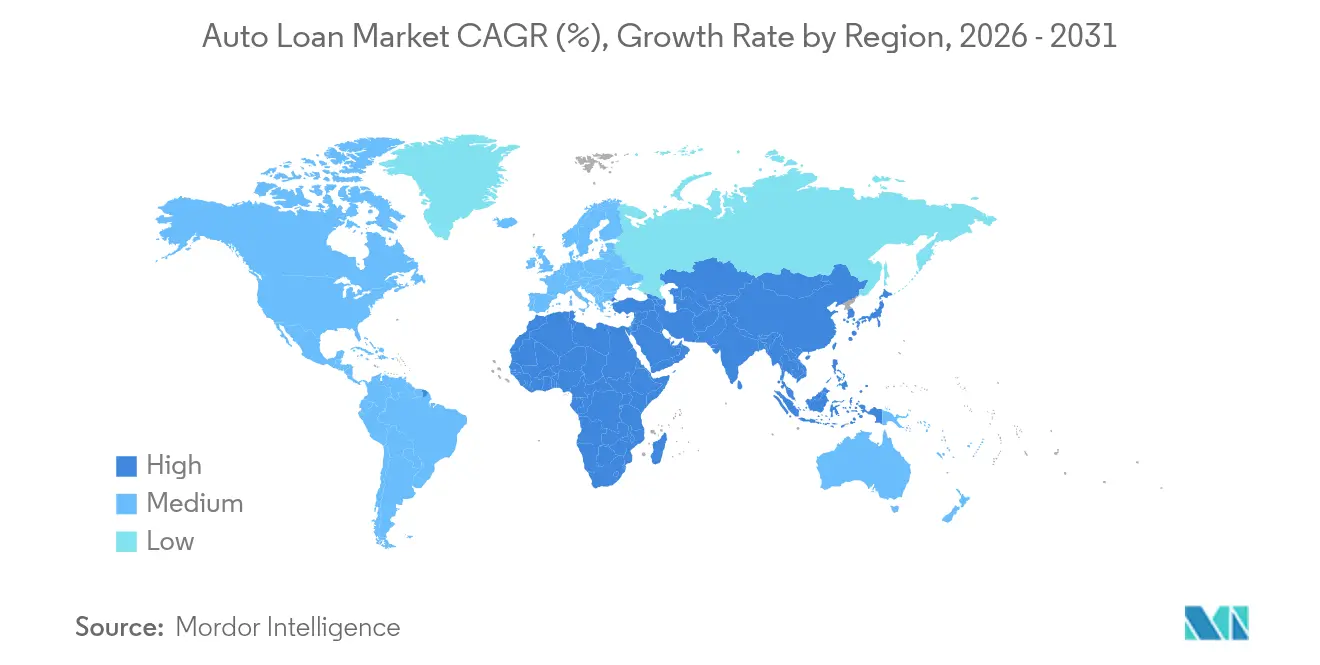
Asia-Pacific anchors the Global auto loan market with a 33.62% 2025 share and a 9.48% CAGR outlook. China’s April 2024 policy scrapping minimum down payments ignited credit demand and boosted showroom traffic. The region’s EV leadership, with 60% of global sales, pulls lenders toward battery-residual models and charging-subscription add-ons. India and ASEAN members liberalize e-KYC frameworks, enabling two-wheeler credit expansion via smartphone apps.
North America Auto Loan Market
North America remains mature yet fluid. The CFPB’s 2024 supervisory report spotlighted deceptive GAP-waiver and add-on sales, prompting lenders to overhaul disclosures. Average transaction prices at USD 48,000 steer consumers toward longer tenures and used inventory. Digital origination volumes climbed 29% in 2025, as lenders automate income verification and electronic lien filing. Federal Reserve policy keeps prime APRs high, squeezing marginal borrowers and lifting delinquencies above pre-pandemic levels.
EMEA Auto Loan Market
Europe contends with regulatory shake-ups. In the United Kingdom, potential GBP 28 billion in redress stemming from commission transparency litigation could reorder lender economics. Meanwhile, securitization volumes reached EUR 137 billion in 2024 as investors sought floating-rate assets. Continental banks upscale green-mobility portfolios, anticipating a USD 30-40 billion uplift to auto-finance gross value added by 2035. Middle East and Africa markets offer white-space growth: GCC banks capitalize on 3.5% GDP growth forecasts to extend Sharia-compliant auto products, while South Africa’s digital-on-boarding rules accelerate credit inclusion.
Mordor Intelligence provides coverage of the auto loan market across other key regional markets, including Europe, each with their regulatory frameworks and demand patterns. Detailed country-level analysis extends to France, China, India, Japan, United States, Brazil, United Kingdom, Russia, and Germany incorporating local coverage and market participation, as required.
Regulatory Landscape
Auto lending is governed by a layered consumer-credit framework, with core touchpoints across TILA, ECOA (Regulation B), FCRA, FDCPA, and SCRA that shape disclosures, pricing, adverse-action notices, credit reporting, servicing conduct, and collections. In the United States, the Consumer Financial Protection Bureau (CFPB) remains a central supervisor for lenders, while its statutory limits on regulating motor vehicle dealers keep a portion of dealer-driven finance and add-on sales outside direct CFPB coverage, sustaining a compliance split between lender controls and dealer practices.
Regulatory attention continues to focus on fair lending, add-on products such as GAP-related offerings, and longer-tenor structures that can create payment-shock and negative-equity risks. Alongside federal oversight, state-level enforcement activity is rising as attorneys general and state legislatures step into perceived gaps, increasing the need for multi-jurisdiction policy management, dealer oversight, and consistent customer treatment across channels as digital origination expands and lenders rely more on third-party data and model vendors.
Value Chain Analysis
The auto-loan value chain begins with demand generation and origination (OEM captive channels, dealer F&I desks, direct-to-consumer digital funnels, and embedded offers during vehicle search). It then progresses through identity verification and data gathering (income, bureau files, alternative data, and vehicle valuation). Underwriting and pricing translate these inputs into approval decisions and contract terms, followed by funding through deposits (banks), balance-sheet and warehouse facilities (nonbanks), and securitization structures that recycle capital to support new originations.
Post-origination activities include lien perfection and title management, customer servicing (payments, extensions, hardship programs), and delinquency management, including early-stage collections through recovery and remarketing. Revenue expansion and risk control increasingly depend on adjacent products and services managed in the servicing layer, including F&I products and insurance partnerships. At the same time, vendor oversight for technology platforms, model governance, and dealer-originated variables has become more operationally central as lenders push for faster digital decisions and consistent compliance controls across thousands of dealer relationships.
Competitive Landscape
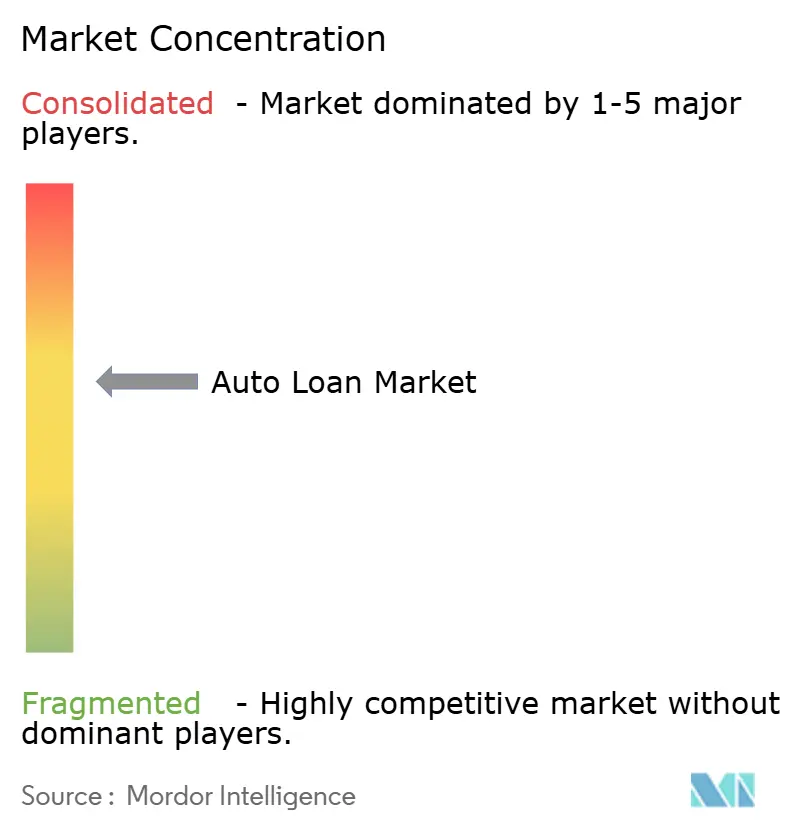
Competition in the Global auto loan market is intensifying as distribution migrates online and regulation tightens. The market is moderately fragmented, with the top five lenders jointly controlling slightly more than half of the outstanding balances, while a long tail of regional banks, fintechs, and credit unions occupies the remainder. Banks hold the largest position but grapple with aging core systems and higher capital charges. Fintech platforms operate asset-light models, funding loans via marketplace investors or warehouse lines, enabling rapid share capture in thin-file segments.
OEM captives exploit customer-lifecycle data to cross-sell maintenance plans and insurance. GM Financial's renewed push for an Industrial Loan Company charter underscores the quest for funding advantages traditionally held by banks. Hyundai Capital America’s partnership with Root Inc. pairs telematics-powered insurance with finance, deepening wallet penetration. Embedded-finance entrants weave credit offers into ride-hailing and e-commerce checkout flows, widening borrower funnels at near-zero marginal acquisition cost.
Barriers to entry rise as compliance burdens mount. Only lenders with robust model-risk management can satisfy regulators’ expectations for AI transparency. Strategic responses include partnerships—Wells Fargo with Volkswagen Financial Services—technology investments such as Capital One’s Chat Concierge, and niche plays like pay-per-mile financier Zeti. Players that harness data at scale while preserving borrower protections are positioned to thrive.
Auto Loan Industry Leaders
-
Ally Financial
-
Wells Fargo
-
JPMorgan Chase Auto
-
Capital One
-
Bank of America
- *Disclaimer: Major Players sorted in no particular order
Auto Loan Market Companies Covered in this Report
- Ally Financial
- Wells Fargo
- JPMorgan Chase Auto
- Capital One
- Bank of America
- BNP Paribas Personal Finance
- Crédit Agricole Auto Bank
- HDFC Bank
- ICICI Bank
- Mashreq Bank
- Toyota Financial Services
- Ford Motor Credit Company
- GM Financial
- Santander Consumer USA
- Hyundai Capital
- Daimler Mobility AG
- Volkswagen Financial Services
- PSA Banque (Stellantis Financial Services)
- Axis Bank
- Barclays
Market Opportunities and Future Outlook
Digitized and dealer-embedded origination is a clear whitespace for scale and conversion improvements, especially where lenders can combine pre-qualification, valuation, and faster funding into a single journey. Market evidence supports this throughput angle: Ally Financial reported record application volume of 4.6 million consumer applications in Q2 2026 and maintained relationships with about 21,000 dealers, illustrating how distribution breadth and workflow automation translate into measurable pipeline depth.
Opportunities also cluster in higher-complexity credit decisions and product design where lenders can differentiate on data and servicing, including used-vehicle loans driven by affordability, longer-tenor structures that require tighter negative-equity and residual-value controls, and EV-specific financing linked to battery health and warranty constructs. As state-level consumer-protection activity rises alongside ongoing federal supervision, lenders with repeatable compliance operations such as dealer oversight, transparent add-on disclosures, and auditable AI and model governance can gain traction with OEMs, dealer groups, and platform partners focused on consistent customer outcomes across channels.
Recent Industry Developments in Auto Loan Market
- April 2026: Wells Fargo expands its partnership with Volkswagen Financial Services U.S. to extend co-branded purchase financing, including Ducati motorcycles. The expansion strengthens the captive-finance channel and OEM-linked auto loan origination. It reinforces long-term financing partnerships to stabilize volumes amid cyclical auto demand.
- April 2026: Ally Financial, Q1 2026 auto finance originations increased 13% year over year. The rise signals demand and originations strength in auto lending. It demonstrates resilience in Ally’s originations despite market softness in overall auto sales.
- February 2026: Ally Financial issued 758.28 million in asset-backed notes via Ally Auto Receivables Trust 2026-1. The notes provide liquidity for auto lending and support continued origination capacity. It provides funding runway to sustain growth and manage credit risk through securitization.
Auto Loan Market Report Scope and Research Methodology
Market Definition and Coverage
For this study, the auto loan market is defined as the value of outstanding auto loan balances used to finance passenger and commercial vehicles through banks, credit unions, captive finance arms, and other regulated lenders, captured in USD for each year.
Scope exclusions: We exclude vehicle leases, dealer floorplan finance, short term bridge credit, and lending that is mainly for insurance, warranties, or other add-ons.
Segments Covered in This Report
- By Vehicle Type
- Passenger Vehicle
- Commercial Vehicle
- By Vehicle Model
- Motorcycles/Scooters
- Auto-rickshaws/Cargo 3Ws
- Cars (Hatchbacks, Sedans, SUVs, etc.)
- Pickups and Small Vans
- Trucks and Buses
- Others
- By Ownership
- New Vehicles
- Used Vehicles
- By Provider Type
- Banks
- Non-Banking Financial Institutions
- Original Equipment Manufacturers
- Other Provider Types (Fintech Companies)
- By Tenure
- Less than 3 Years
- 3-5 Years
- More than 5 years
- By Region
- North America
- United States
- Canada
- Mexico
- South America
- Brazil
- Argentina
- Chile
- Colombia
- Rest of South America
- Europe
- United Kingdom
- Germany
- France
- Spain
- Italy
- Benelux (Belgium, Netherlands, and Luxembourg)
- Nordics (Sweden, Norway, Denmark, Finland, and Iceland)
- Rest of Europe
- Asia-Pacific
- China
- India
- Japan
- South Korea
- Australia
- South-East Asia (Singapore, Indonesia, Malaysia, Thailand, Vietnam, and Philippines)
- Rest of Asia-Pacific
- Middle East and Africa
- United Arab Emirates
- Saudi Arabia
- South Africa
- Nigeria
- Rest of Middle East and Africa
- North America
Data Sources, Market Sizing, and Validation
Desk Research
Desk research starts with public credit and macro datasets that help us anchor the demand pool and the interest rate cycle. Key sources include the Federal Reserve Consumer Credit statistical release (G.19), the Federal Reserve Financial Accounts of the United States (Z.1), and related series accessed through the Federal Reserve Bank of St. Louis data portal, which help track auto loan levels and net flows over time.
We then add the vehicle and household context that influences lending behavior year to year. Sources such as the US Bureau of Labor Statistics (inflation and income indicators), the US Bureau of Economic Analysis (personal income and consumption context), and US transportation and motor vehicle agency releases (vehicle activity indicators) are used to sanity-check our assumption directions. We also use Congressional Research Service briefs to confirm policy and market structure context, and review company filings, investor presentations, and reputable business press. When additional support is needed, we selectively use paid subscriptions for company financials and patent databases. The desk sources listed above are illustrative, and other public datasets and documents were also used to collect, validate, and clarify inputs.
Primary Interviews and Surveys
Primary work focuses on validating how outstanding balances build from new and used vehicle financing, and how terms shift as rates and vehicle prices move. We speak with lender and origination stakeholders, risk and servicing specialists, and industry advisors across major regions so assumptions on average ticket size, loan term mix, refinancing behavior, and credit performance can be grounded before finalizing the model.
Distribution of primary research fieldwork respondents
| Company type | Respondent position | Region |
|---|---|---|
| Top tier: 26% | CXOs: 12% | APAC: 47% |
| Mid tier: 57% | Functional/Unit leaders: 35% | EMEA: 34% |
| Smaller Players: 17% | Managers: 53% | Americas: 19% |
Market-Sizing & Forecasting
The sizing logic starts from a top-down build where consumer credit and financial accounts signals are used to reconstruct auto loan outstanding balances by year, followed by region splits that reflect observed lending structures and vehicle activity. To keep the totals realistic, we corroborate them with selective bottom-up approximations such as sampled average balance per loan multiplied by estimated active loan counts, plus lender balance roll ups where public disclosures make this feasible.
A few inputs do most of the heavy lifting in the model because they directly shape balances. These include vehicle sales volumes and average transaction prices (new and used), average loan term and down payment patterns, benchmark interest rate paths that influence payment affordability, and delinquency and charge-off trends that affect net balance persistence. Where bottom-up disclosure gaps exist, they are filled using peer ratios for similar lender types, and the result is then re-checked against aggregate credit series to ensure the total is not distorted.
For forecasting, we run scenario analysis and align it to variable level expectations gathered in interviews. Rate direction, vehicle price normalization, and underwriting tightness are treated as the main levers, and we only carry forward the chosen path if it stays consistent with the historical relationship between sales, prices, and outstanding balances.
Data Validation & Update Cycle
Validation is done in several passes so the final number is not driven by a single dataset or one strong assumption. We compare outputs against independent signals such as aggregate consumer credit levels, net flow direction, and affordability indicators, then review any variance that looks too large to be explained by rates or vehicle prices.
Before sign-off, the model and its assumptions go through an internal analyst review, and re-contact is triggered when a key input shifts materially or when a public release revises historical series. Reports are refreshed annually, with interim updates when major rate moves, regulatory changes, or sharp credit performance swings occur. Right before delivery, an analyst performs a fresh pass on recent releases so clients receive an updated view aligned with the latest available data.
Mordor Intelligence's Auto Loan Market Estimate Compared With Other Published Estimates
Published market values for auto loans do not always match because the underlying measuring stick is not the same across sources, and the timing can also differ. Some figures reflect outstanding balances at a point in time, while others are closer to annual financing activity, which can make two reasonable numbers look far apart.
Federal Reserve consumer credit levels, Z.1 balance series, and open-loan count indicators are the evidence checks that keep Mordor Intelligence's estimate tied to outstanding balances while excluding leasing and dealer floorplan finance from the market total. Differences also come from whether used and new vehicle loans are treated consistently across regions, how currency conversion timing is handled, and whether the latest rate and delinquency shifts are incorporated or left on an older base year.
Benchmark comparison
| Source | Market Size | Gaps in Research Methodology |
|---|---|---|
| Mordor Intelligence | USD 1.84 T (2025) | |
| Policy Briefing C | USD 1.67 T (2025) | Represents outstanding auto loan debt for a single country and is not a global roll-up, which keeps the total lower when compared with multi-region aggregation in USD. |
| Industry Dashboard D | USD 2.05 T (2026) | May blend annual origination momentum with balance estimation and apply faster average loan size progression, which can push the outstanding balance level higher for the stated year. |
The spread across the table is mainly explained by geography coverage and whether the number represents balances or annual financing activity. By keeping the model traceable to public balance series, and then stress-testing it with loan terms, vehicle prices, and lender mix checks, the final market size stays transparent and repeatable across update cycles.
Key Questions Answered in the Report
What is the current size of the Global auto loan market?
The market is valued at USD 1.98 trillion in 2026 and is forecasted to reach USD 2.88 trillion by 2031, reflecting an 7.78% CAGR.
Why are used-vehicle loans growing faster than new-vehicle loans?
Record USD 48,000 new-car prices and higher interest rates are driving borrowers toward affordable used options, pushing used-loan originations to a 9.21% CAGR.
How are fintech lenders disrupting traditional auto finance?
Fintechs deploy AI-based credit models that approve more thin-file borrowers and deliver sub-one-minute decision times, fueling a 13.72% CAGR in their loan books.
How are regulators affecting long-tenor auto loans?
Bodies such as the CFPB are scrutinizing balloon and 7-year terms for consumer detriment, prompting lenders to tighten disclosures and adjust pricing.
What strategies help lenders mitigate rising delinquency risks?
Tactics include alternative data underwriting, residual-value insurance, and embedding GAP coverage to cushion negative-equity exposures.