Market Overview
| Study Period | 2020 - 2031 |
|---|---|
| Forecast Data Period | 2026 - 2031 |
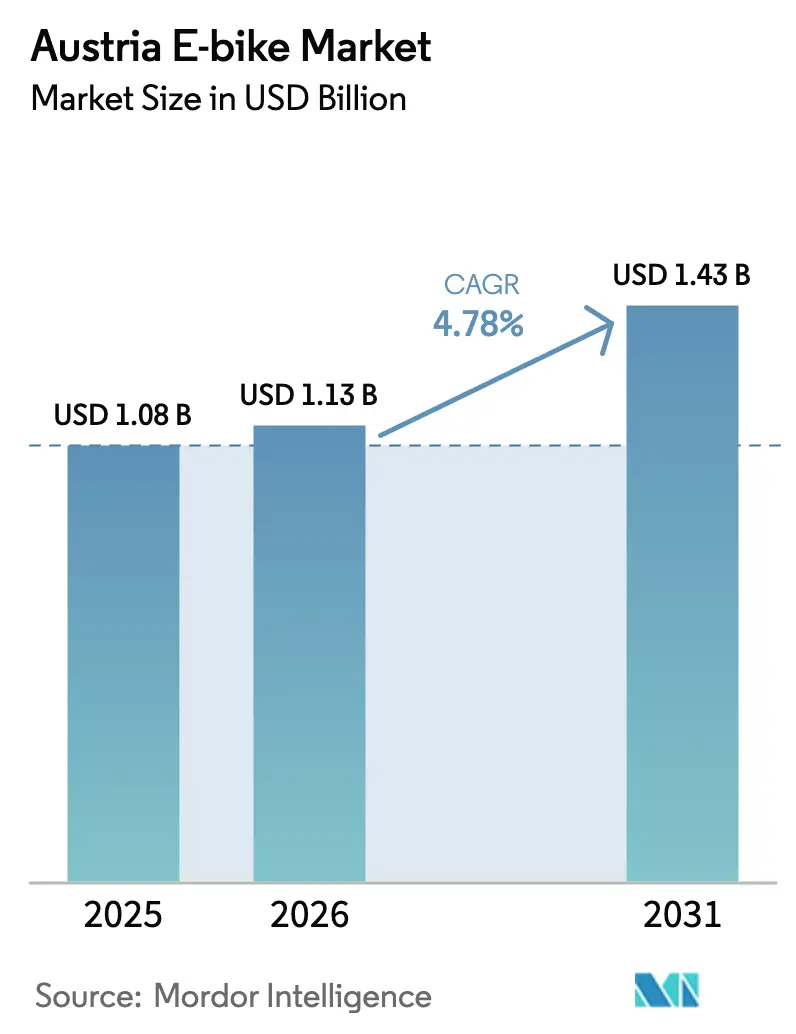
| Base Year Market Size (2025) | USD 1.08 Billion |
| Market Size (2026) | USD 1.13 Billion |
| Market Size (2031) | USD 1.43 Billion |
| Growth Rate (2026 - 2031) | 4.78% CAGR |
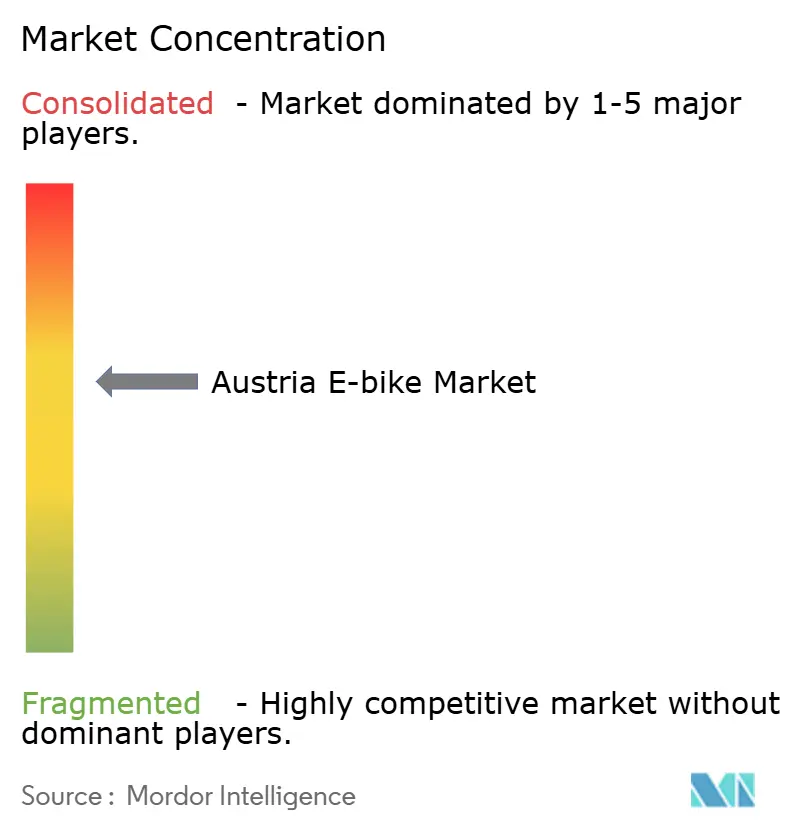
| Market Concentration | Medium |
Major Players*Disclaimer: Major Players sorted in no particular order Image © Mordor Intelligence. Reuse requires attribution under CC BY 4.0. | |
Austria E-bike Market Analysis by Mordor Intelligence
The Austrian E-bike Market size was valued at USD 1.08 billion in 2025 and estimated to grow from USD 1.13 billion in 2026 to reach USD 1.43 billion by 2031, at a CAGR of 4.78% during the forecast period (2026-2031). This trajectory keeps Austria among Europe’s front-runners as electric bicycles account for most of the total bicycle unit sales and significant sales value in 2024. Policy incentives, high fuel prices, and corporate leasing schemes combine with alpine tourism demand to pull new riders into the Austrian e-bike market. At the same time, domestic manufacturers leverage premium positioning to protect margins. Mid-drive systems, high-capacity lithium-ion batteries, and belt drives illustrate the performance orientation that distinguishes Austrian buying patterns from many flatter European markets. Infrastructure build-out, especially in Vienna and Salzburg, underpins growth, though rural charging gaps and price sensitivity temper near-term upside.
Key Report Takeaways
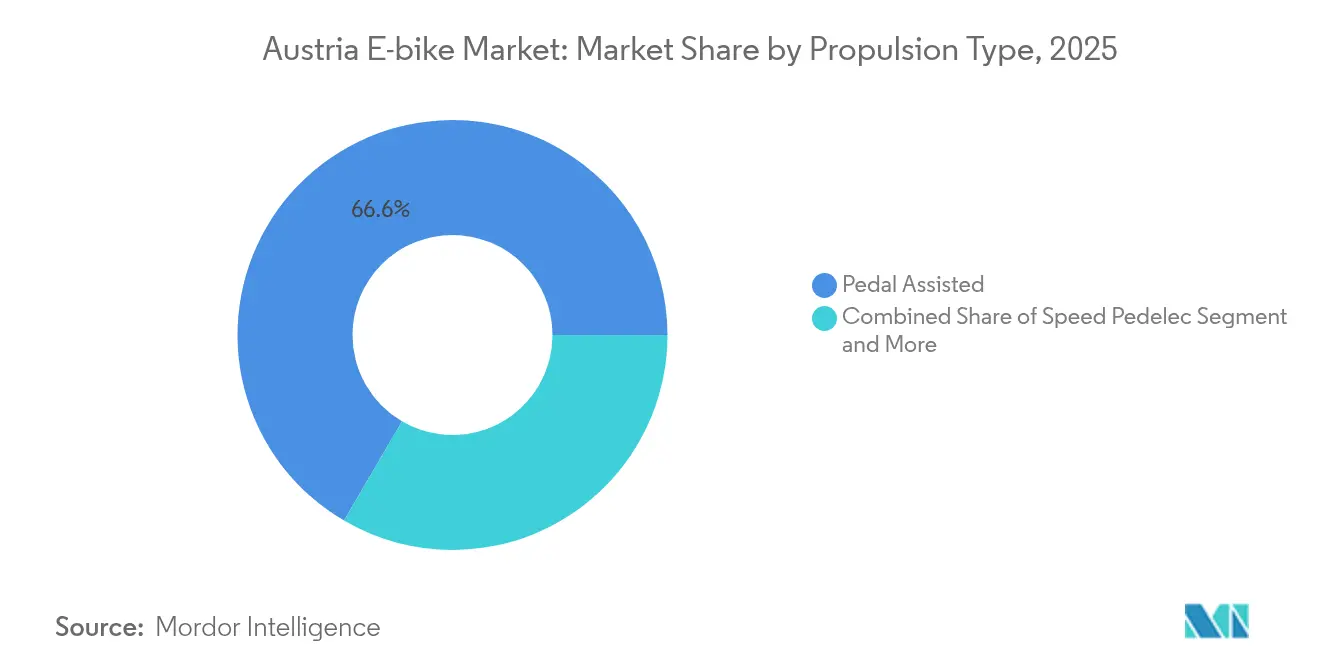
- By propulsion type, Pedal Assisted models led with 66.58% of the Austrian e-bike market share in 2025, while Speed Pedelecs posted the highest projected CAGR at 4.84% through 2031.
- By application, city/urban bikes captured 46.25% of the revenue share in 2025; cargo/utility is forecast to expand at a 4.96% CAGR by 2031.
- By battery type, lithium-ion commanded an 86.74% share of the Austrian e-bike market in 2025 and is advancing at a 5.02% CAGR through 2031.
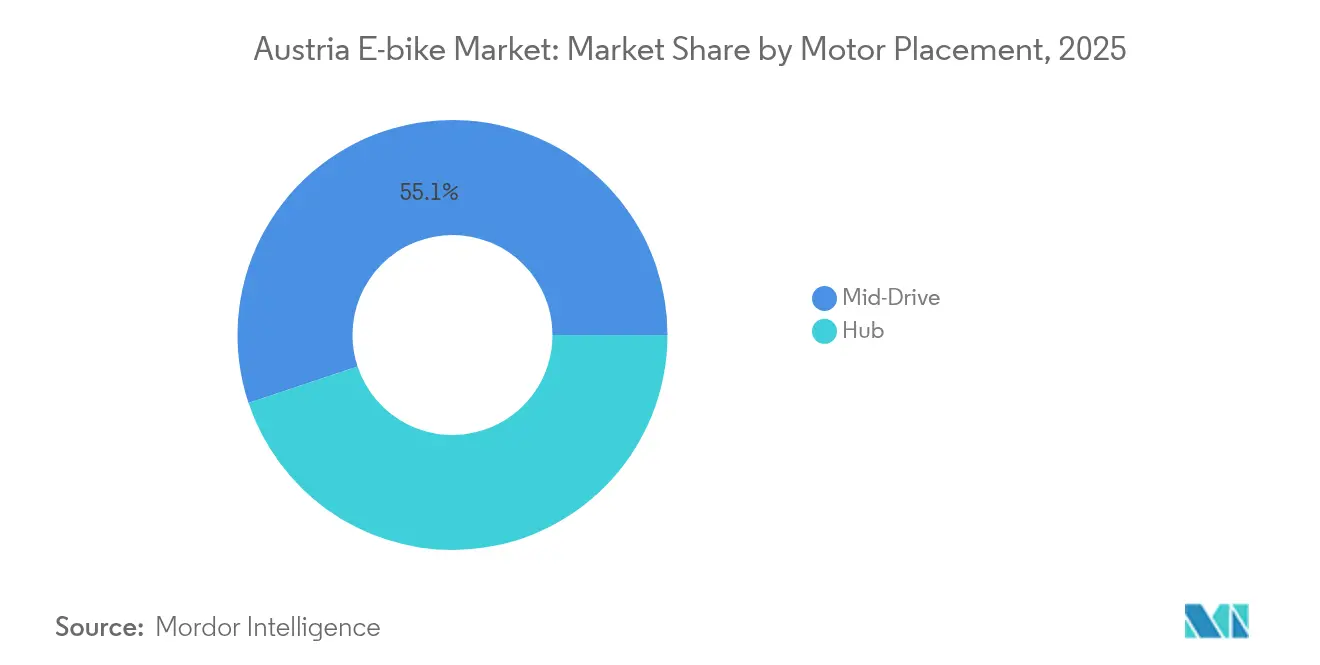
- By motor placement, mid-drive systems accounted for 55.12% of 2025 shipments; mid-drive is also growing at a 4.88% CAGR.
- By drive system, chain drives held 72.95% of sales in 2025, whereas belt drives grew fastest at 4.81% CAGR on low-maintenance appeal.
- By motor power, units rated below 250 W represented 53.88% share in 2025; the 351-500 W class shows 4.99% CAGR as commuters seek higher torque.
- By price band, the USD 1,500-2,499 bracket led with 30.98% revenue in 2025; the USD 3,500-5,999 tier grows quickest at 4.85% CAGR, signaling premiumization.
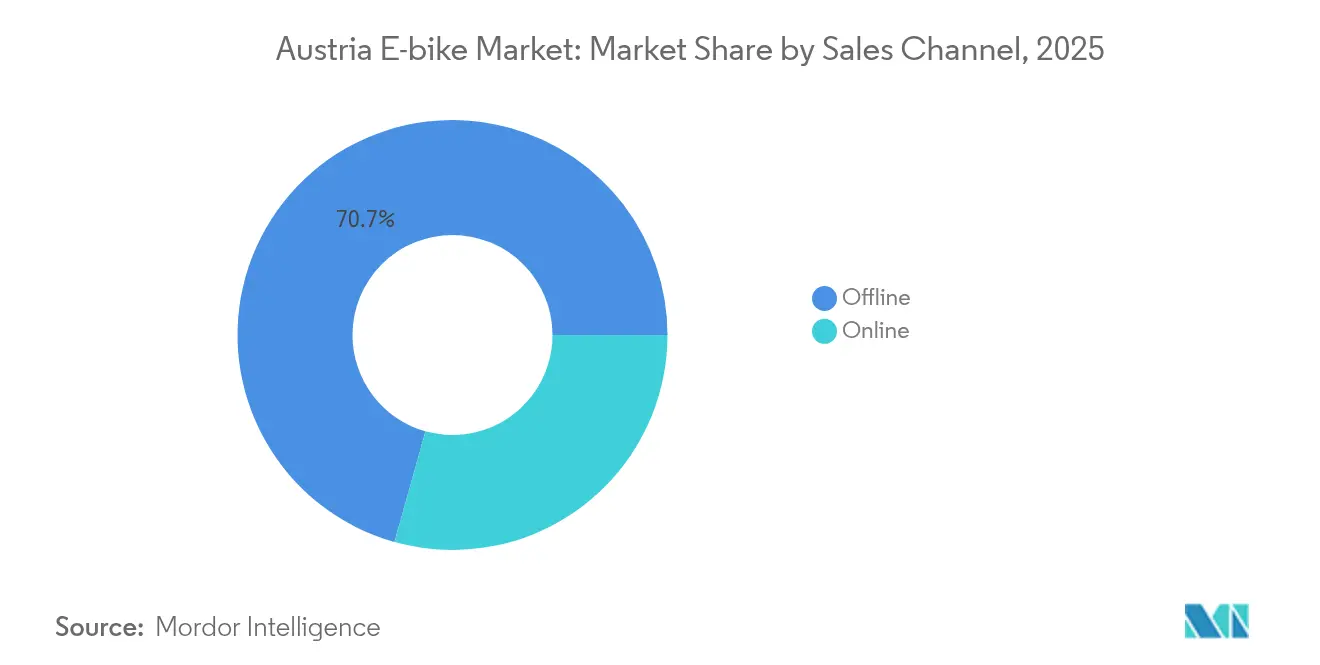
- By sales channel, offline retail accounted for 70.65% of 2025 turnover; pure online sales accelerated at a 4.9% CAGR as buyers gained confidence in virtual fittings.
- By end use, Personal & Family riding dominated with 67.12% of demand in 2025; Commercial Delivery is expanding at a 4.93% CAGR due to low-emission rules in Austrian cities.
Note: Market size and forecast figures in this report are generated using Mordor Intelligence’s proprietary estimation framework, updated with the latest available data and insights as of 2026.
Austria E-bike Market Trends and Insights
Drivers Impact Analysis*
| Driver | (~) % Impact on CAGR Forecast | Geographic Relevance | Impact Timeline |
|---|---|---|---|
| Subsidies and Tax Incentives | +1.2% | National, with higher uptake in Vienna, Salzburg | Short term (≤ 2 years) |
| Protected Cycling Infrastructure | +0.8% | National, concentrated in urban centers | Medium term (2-4 years) |
| Rising Fuel Prices | +0.7% | National, stronger impact in commuter regions | Short term (≤ 2 years) |
| Tourism-Driven Trekking Demand | +0.6% | Alpine regions, tourist destinations | Long term (≥ 4 years) |
| Corporate E-Bike Leasing | +0.5% | National, focused on business districts | Medium term (2-4 years) |
| High-Capacity Removable Batteries | +0.4% | National, technology-driven adoption | Medium term (2-4 years) |
| Source: Mordor Intelligence | |||


Purchase Subsidies & Tax Incentives
Austria layers federal and regional support to cut effective acquisition costs by as much as two-fifths for qualifying models [1]“Cycling Master Plan,” Federal Ministry for Climate Action, bmk.gv.at . The klimaaktiv mobil scheme pays up to EUR 850 (USD 983) per private buyer, while Vienna and Salzburg add EUR 200-500 (USD 231-578) top-ups that especially benefit high-priced cargo bikes. Corporations deploy JobRäder-style leasing to offer staff premium models through salary-sacrifice arrangements that lower payroll taxes. These incentives accelerate early-cycle penetration and make the Austrian e-bike market more resilient when discretionary spending softens. Long-term continuity hinges on yearly federal budget negotiations and Länder priorities balancing climate goals with other fiscal pressures.
Expansion of Protected Cycling Infrastructure
In 2024, Austria had an extensive network of cycling routes, but only a small proportion met "safe" design standards, particularly outside Vienna and Vorarlberg. With federal targets aiming to significantly increase the modal share by 2030, Austria plans substantial investments in segregated lanes and charging points. Urban initiatives in Vienna are integrating e-bike sharing with rail hubs, providing commuters with practical alternatives to cars. However, insufficient infrastructure in rural areas limits the adoption of e-bikes among long-distance riders. Accelerated expansion of cycling lanes in the coming years is essential to meet the growing demand for Speed Pedelecs, which are currently restricted from many conventional paths.
Rising Fuel Prices & Commuting Costs
Diesel surpassed fair price per liter in 2025, renewing interest in alternatives for trips under 15 km [2]“Fuel Price Monitor 2025,” E-Control Austria, econtrol.at. Employers now reimburse e-bike mileage, creating parity with car allowances. Austrian Federal Railways imposes a EUR 2 bike fee on long-distance trains, pushing commuters toward door-to-door e-bike travel. Volatile global oil markets keep this driver potent, though macro relief in energy prices could temper its contribution to Austria's e-bike market expansion.
Alpine Tourism-Driven Trekking Demand
The National Tourism Board reports significant cycling overnights in 2024, more than one-fifth of which involved e-bikes on alpine routes [3]“Cycling Tourism Key Figures 2024,” Austrian National Tourist Office, austria.info . Resort operators partner with local dealers to offer battery swap networks and rental fleets, converting visitors into purchasers once back home. This driver boosts mid-drive and high-capacity battery demand while extending seasonality in mountain towns. Climate variability, however, can compress peak weeks and expose rental operators to weather risks.
Restraints Impact Analysis*
| Restraint | (~) % Impact on CAGR Forecast | Geographic Relevance | Impact Timeline |
|---|---|---|---|
| High Upfront Cost | -0.9% | National, stronger impact in price-sensitive segments | Short term (≤ 2 years) |
| Sparse Public Charging Infrastructure | -0.6% | National, acute in rural areas | Medium term (2-4 years) |
| Emerging Insurance and Registration Rules | -0.4% | National, concentrated in urban commuter markets | Medium term (2-4 years) |
| Mid-Drive Motor Supply Constraints | -0.3% | National, affecting premium and performance segments | Short term (≤ 2 years) |
| Source: Mordor Intelligence | |||
High Upfront Cost
In 2025, average retail prices for e-bikes significantly increased compared to the much lower prices of non-electric bikes in earlier years. While subsidies provide some relief, they are insufficient to fully address the financial strain for students, seniors, and single-car households living outside major cities. Financing options remain limited, with only a small proportion of Austrian bike shops offering lease-to-own plans. Furthermore, annual service packages add to the cost burden for owners transitioning from traditional bikes, who generally expect lower maintenance expenses. Although Asian imports offer more affordable alternatives, they raise concerns about the availability of spare parts and compliance with long-term safety standards, contributing to consumer hesitation in Austria's e-bike market.
Sparse Public Charging Infrastructure
While Vienna hosts numerous public e-bike chargers, a significant majority of Austrian municipalities lack any dedicated plugs. This shortfall hampers multi-stop tourism in Tyrol and extends commutes in Lower Austria. The absence of standardized payment apps not only fragments the user experience but also raises capital costs for local councils. Furthermore, Austria's national e-mobility policy leans heavily towards cars, sidelining e-bike charging with no consistent guidelines. As a result, investors are hesitant to proceed, stifling the growth of Austria's e-bike market beyond its urban centers.
*Our forecasts treat driver/restraint impacts as directional, not additive. The impact forecasts reflect baseline growth, mix effects, and variable interactions.
Segment Analysis
By Propulsion Type: Speed Pedelecs Navigate Regulatory Complexity
In 2025, Pedal-Assist units held 66.58% of Austria's e-bike market share due to legal clarity, broad retailer inventories, and consumer comfort with moderate assist speeds. Their dominance anchors category volumes, but Speed Pedelecs, though only a niche today, post a forecast 4.84% CAGR, the highest within propulsion formats.
Speed Pedelecs attract 15-30 km commuters who value 45 km/h performance even under Austria’s moped-class rules requiring licensing, insurance, and number plates. Regulatory reforms remain uncertain, but employer fleets and delivery services validate their economics, reinforcing the Austrian e-bike market’s shift toward higher-power offerings. Throttle-assisted variants stay peripheral because EU law compels pedal input for continuous power, limiting appeal among fitness-minded Austrian riders.


By Application Type: Cargo Solutions Drive Urban Innovation
City/Urban bikes produced 46.25% of 2025 revenue, mirroring Austria’s dense settlement pattern and sizable daily commutes within 10 km. Established operators in Vienna, Graz, and Linz rely on these models for eco-friendly last-mile journeys.
Cargo/Utility e-bikes, however, will post a 4.96% CAGR through 2031 as supermarkets, parcel couriers, and young families adopt long-tail and three-wheeler formats capable of hauling 150 kg payloads. Low-emission zones and congestion charges accelerate adoption, enhancing overall Austria e-bike market resilience to fuel shocks. Trekking/Mountain demand remains robust and is fueled by alpine tourism branding and an expanding network of e-MTB trails. Yet, growth moderates as penetration milestones are reached in core resort areas.
By Battery Type: Lithium-Ion Dominance Faces Sustainability Pressures
Lithium-ion packs contributed 86.74% of 2025 deliveries and are forecast to grow 5.02% CAGR on surging energy density and falling per-Wh costs. Their dominance shapes every product decision, from frame geometry to price band positioning, making them central to Austria's e-bike market performance narratives.
Lead-acid persists mainly in campus shuttles and utility trikes, where upfront price overshadows weight penalties, whereas LiFePO4 variants gain interest among safety-conscious public sector buyers. EU Battery Regulation provisions on recycled content and carbon footprint reporting will raise compliance costs, but Austrian research consortia have already piloted closed-loop recycling, creating potential local supply advantages.
By Motor Placement: Mid-Drive Systems Suit Alpine Terrain
Mid-drive motors secured a 55.12% share in 2025 because torque delivery at the crankset tackles Austria’s gradients without overheating. The segment is also growing at a CAGR of 4.88% through 2031. Riders prize natural weight distribution and efficient battery usage on mountain climbs, reinforcing this design’s leadership in the Austrian e-bike market.
Hub motors continue to appeal to fleet and budget models where simplicity trumps hill performance. Innovative dual-hub set-ups appear in cargo bikes seeking traction redundancy on winter streets, hinting at specialized growth pockets even as mid-drive remains mainstream.
By Drive Systems: Belt Drive Gains Premium Traction
Chain drives still command 72.95% of unit sales, underpinned by ubiquitous service know-how and low part costs. Value-oriented family riders and rental fleets select chains to minimize acquisition expense.
Belt drives are moving from novelty to premium norm, growing 4.81% CAGR as commuters embrace grease-free operation and 20,000-km service intervals. When paired with internal gear hubs, belts provide near-silent propulsion, a feature corporate buyers integrate into wellness branding. Their expansion lifts average selling prices and aligns with the Austrian e-bike market’s premiumization theme.
By Motor Power: Performance Demands Drive Higher Wattage
Models below 250 W remained the mainstream in 2025 with 53.88% market share, but the 351-500 W band is the quickest-growing at 4.99% CAGR. This shift underscores riders’ desire for robust hill starts and safer overtakes without breaching EU-mandated continuous power caps.
Manufacturers exploit controller algorithms that permit brief peak outputs above rated limits, effectively widening usable torque envelopes. Demand is strongest among commuters on peri-urban routes involving 300-400 m elevation gains and among cargo couriers hauling heavy payloads, directing the Austrian e-bike market R&D toward heat management and drivetrain durability.
By Price Band: Premiumization Reflects Quality Expectations
The USD 1,500-2,499 tier led in 2025 faces flat volume growth as first-time buyers stretch budgets for longer-range or lightweight builds with 30.98% market share. Subsidies compress real outlays, nudging buyers into the USD 3,500-5,999 band, which should grow at a 4.85% CAGR.
Premiumization thrives on connected display ecosystems, anti-theft GPS, and in-tube batteries that preserve classic silhouettes while delivering 120 km ranges. Economic headwinds could slow high-ticket sales, but corporate leases and tourism fleets continue to underpin volume for top-tier suppliers in the Austrian e-bike market.
By Sales Channel: Digital Transformation Accelerates
Brick-and-mortar (offline) outlets handle 70.65% of turnover because Austrian buyers value test rides and personalized fitting. Specialized e-bike boutiques offer diagnostic tools and firmware updates, building loyalty through after-sales services.
E-commerce, growing 4.9% CAGR, benefits from factory-direct strategies promising 5-day delivery and 30-day return windows. Virtual showroom tech lets shoppers compare geometry and battery specs at home. Retailers respond with click-and-collect and mobile service vans, blending physical support with digital convenience to maintain relevance across the Austrian e-bike market.
By End Use: Commercial Applications Expand Rapidly
Personal and family riding remained dominant, with a 67.12% share in 2025, as health, leisure, and utility motivations merge. Multi-generation households often treat e-bikes as car substitutes for errands within 8 km, creating sustained baseline demand.
Commercial Delivery posts the fastest 4.93% CAGR, catalyzed by same-day e-grocery and parcel services that aim to meet emission targets while dodging congested curbside parking fines. Municipal procurement of maintenance fleets further diversifies B2B opportunities, cementing another pillar of growth in the Austrian e-bike market.
Geography Analysis
Austria's alpine landscape carves out distinct demand patterns. In recent years, Vienna has achieved significant coverage of "safe" cycling infrastructure, elevating its e-bike density to one of the highest levels in the country. Salzburg, driven by its tourism, boasts a robust bike-bus intermodal system. In the western regions, Tyrol and Vorarlberg lead with the highest adoption of mid-drive e-bikes, capitalizing on the torque advantages for steep alpine climbs. In contrast, Lower Austria and Burgenland, with their agricultural backroads and fewer protective lanes, see a more gradual e-bike uptake.
Austria's e-bike industry thrives on domestic production, notably from KTM's plant in Mattighofen, which has been a major contributor to the market. The revenue from these exports helps balance out the costs of imported components, providing a buffer against trade imbalances, especially in light of a significant dip in EU-wide e-bike imports in recent times. Austrian e-bikes, especially the premium models, find a ready market in neighboring Germany and Italy, underscoring a strong cross-border brand reputation that channels R&D investments back into Austria.
Policies further accentuate regional disparities. Vienna's incentive for cargo bikes, which is notably higher than the federal limit, has catalyzed micro-logistics initiatives, now being mirrored in Graz and Innsbruck. Yet, rural areas hold back, waiting for national charging standards before making financial commitments. As a result, e-bike adoption in these regions lags behind the national average, but there's optimism for growth once funding becomes available.
Competitive Landscape
The Austrian e-bike market is a battleground for both homegrown brands and European giants. Leading the charge is KTM, which harnesses its circular powerflow frame, fine-tuned for Bosch Performance CX drives, to dominate domestic production. Further sweetening the deal, KTM rolls out over-the-air firmware updates through its MyKTM app, bolstering customer loyalty. Meanwhile, CUBE, hailing from Germany and operating out of Wels, boasts a diverse lineup from basic hardtails to premium carbon models, leveraging aggressive bundle pricing in collaboration with tour operators.
In recent years, strategic maneuvers have highlighted the push for ecosystem cohesion. Bosch expanded its training footprint in Austria, certifying a significant number of mechanics on the latest Gen 4 motor diagnostics. Shimano teamed up with Vienna’s public transport to streamline operations, piloting battery swap lockers that significantly reduce courier wait times. ZF made waves with its lightweight full-assist unit, targeting urban step-through frames that prioritize weight parity with traditional bikes.
Online competition heats up as Canyon and VanMoof introduce direct-to-consumer sales, complete with doorstep servicing, putting pressure on conventional dealers. In response, Austrian retailers are sweetening the pot, offering extended service plans and theft insurance. Yet, the industry grapples with supply-chain uncertainties; a chip shortage for motor controllers has stretched lead times considerably, nudging KTM to diversify its PCB assembly sources within the EU. Notably, the leading brands command a significant share of unit sales, indicating a moderately concentrated market, yet leaving ample space for niche players, especially in cargo and lightweight segments.
Austria E-bike Industry Leaders
CUBE Bikes
KTM Bike Industries
Riese & Müller
Scott Sports
Trek Bicycle Corporation
- *Disclaimer: Major Players sorted in no particular order

Recent Industry Developments
- May 2024: In Austria and Germany, ZF introduced a 1.8 kg full-assist drive unit, specifically designed for lightweight urban models. This innovation aims to enhance the performance and efficiency of urban bicycles, catering to the growing demand for lightweight and sustainable transportation solutions in these regions.
- January 2024: KTM debuted the Macina SX series, equipped with Bosch Performance SX motors, successfully reducing the total bike weight to under 18 kg. This launch highlights KTM's commitment to integrating advanced motor technology to meet consumer preferences for lighter and more efficient e-bikes.


Austria E-bike Market Report Scope
Pedal Assisted, Speed Pedelec, Throttle Assisted are covered as segments by Propulsion Type. Cargo/Utility, City/Urban, Trekking are covered as segments by Application Type. Lead Acid Battery, Lithium-ion Battery, Others are covered as segments by Battery Type.By Propulsion Type
| Pedal Assisted |
| Speed Pedelec |
| Throttle Assisted |
By Application Type
| Cargo/Utility |
| City/Urban |
| Trekking/Mountain |
By Battery Type
| Lead Acid Battery |
| Lithium-ion Battery |
| Others |
By Motor Placement
| Hub (Front/Rear) |
| Mid-Drive |
By Drive Systems
| Chain Drive |
| Belt Drive |
By Motor Power
| Less than 250 W |
| 250–350 W |
| 351–500 W |
| 501–600 W |
| More than 600 W |
By Price Band
| Up to USD 1,000 |
| USD 1,000–1,499 |
| USD 1,500–2,499 |
| USD 2,500–3,499 |
| USD 3,500–5,999 |
| Above USD 6,000 |
By Sales Channel
| Online | |
| Offline | Specialized E-Bike Retailers |
| Traditional Bike Shops | |
| Department Stores & Sporting Goods Chains |
By End Use
| Commercial Delivery | Retail & Goods Delivery |
| Food & Beverage Delivery | |
| Service Providers | |
| Personal & Family Use | |
| Institutional | |
| Others |
| By Propulsion Type | Pedal Assisted | |
| Speed Pedelec | ||
| Throttle Assisted | ||
| By Application Type | Cargo/Utility | |
| City/Urban | ||
| Trekking/Mountain | ||
| By Battery Type | Lead Acid Battery | |
| Lithium-ion Battery | ||
| Others | ||
| By Motor Placement | Hub (Front/Rear) | |
| Mid-Drive | ||
| By Drive Systems | Chain Drive | |
| Belt Drive | ||
| By Motor Power | Less than 250 W | |
| 250–350 W | ||
| 351–500 W | ||
| 501–600 W | ||
| More than 600 W | ||
| By Price Band | Up to USD 1,000 | |
| USD 1,000–1,499 | ||
| USD 1,500–2,499 | ||
| USD 2,500–3,499 | ||
| USD 3,500–5,999 | ||
| Above USD 6,000 | ||
| By Sales Channel | Online | |
| Offline | Specialized E-Bike Retailers | |
| Traditional Bike Shops | ||
| Department Stores & Sporting Goods Chains | ||
| By End Use | Commercial Delivery | Retail & Goods Delivery |
| Food & Beverage Delivery | ||
| Service Providers | ||
| Personal & Family Use | ||
| Institutional | ||
| Others | ||


Market Definition
- By Application Type - E-bikes considered under this segment include city/urban, trekking, and cargo/utility e-bikes. The common types of e-bikes under these three categories include off-road/hybrid, kids, ladies/gents, cross, MTB, folding, fat tire, and sports e-bike.
- By Battery Type - This segment includes lithium-ion batteries, lead-acid batteries, and other battery types. The other battery type category includes nickel-metal hydroxide (NiMH), silicon, and lithium-polymer batteries.
- By Propulsion Type - E-bikes considered under this segment include pedal-assisted e-bikes, throttle-assisted e-bikes, and speed pedelec. While the speed limit of pedal and throttle-assisted e-bikes is usually 25 km/h, the speed limit of speed pedelec is generally 45 km/h (28 mph).
| Keyword | Definition |
|---|---|
| Pedal Assisted | Pedal-assist or pedelec category refers to the electric bikes that provide limited power assistance through torque-assist system and do not have throttle for varying the speed. The power from the motor gets activated upon pedaling in these bikes and reduces human efforts. |
| Throttle Assisted | Throttle-based e-bikes are equipped with the throttle assistance grip, installed on the handlebar, similarly to motorbikes. The speed can be controlled by twisting the throttle directly without the need to pedal. The throttle response directly provides power to the motor installed in the bicycles and speeds up the vehicle without paddling. |
| Speed Pedelec | Speed pedelec is e-bikes similar to pedal-assist e-bikes as they do not have throttle functionality. However, these e-bikes are integrated with an electric motor which delivers power of approximately 500 W and more. The speed limit of such e-bikes is generally 45 km/h (28 mph) in most of the countries. |
| City/Urban | The city or urban e-bikes are designed with daily commuting standards and functions to be operated within the city and urban areas. The bicycles include various features and specifications such as comfortable seats, sit upright riding posture, tires for easy grip and comfortable ride, etc. |
| Trekking | Trekking and mountain bikes are special types of e-bikes that are designed for special purposes considering the robust and rough usage of the vehicles. These bicycles include a strong frame, and wide tires for better and advanced grip and are also equipped with various gear mechanisms which can be used while riding in different terrains, rough grounded, and tough mountainous roads. |
| Cargo/Utility | The e-cargo or utility e-bikes are designed to carry various types of cargo and packages for shorter distances such as within urban areas. These bikes are usually owned by local businesses and delivery partners to deliver packages and parcels at very low operational costs. |
| Lithium-ion Battery | A Li-ion battery is a rechargeable battery, which uses lithium and carbon as its constituent materials. The Li-Ion batteries have a higher density and lesser weight than sealed lead acid batteries and provide the rider with more range per charge than other types of batteries. |
| Lead Acid Battery | A lead acid battery refers to sealed lead acid battery having a very low energy-to-weight and energy-to-volume ratio. The battery can produce high surge currents, owing to its relatively high power-to-weight ratio as compared to other rechargeable batteries. |
| Other Batteries | This includes electric bikes using nickel–metal hydroxide (NiMH), silicon, and lithium-polymer batteries. |
| Business-to-Business (B2B) | The sales of e-bikes to business customers such as urban fleet and logistics company, rental/sharing operators, last-mile fleet operators, and corporate fleet operators are considered under this category. |
| Business-to-Customers (B2C) | The sales of electric scooters and motorcycles to direct consumers is considered under this category. The consumers acquire these vehicles either directly from manufacturers or from other distributers and dealers through online and offline channel. |
| Unorganized Local OEMs | These players are small local manufacturers and assemblers of e-bikes. Most of these manufacturers import the components from China and Taiwan and assemble them locally. They offer the product at low cost in this price sensitive market which give them advantage over organized manufacturers. |
| Battery-as-a-Service | A business model in which the battery of an EV can be rented from a service provider or swapped with another battery when it runs out of charge |
| Dockless e-Bikes | Electric bikes that have self-locking mechanisms and a GPS tracking facility with an average top speed of around 15mph. These are mainly used by bike-sharing companies such as Bird, Lime, and Spin. |
| Electric Vehicle | A vehicle which uses one or more electric motors for propulsion. Includes cars, scooters, buses, trucks, motorcycles, and boats. This term includes all-electric vehicles and hybrid electric vehicles |
| Plug-in EV | An electric vehicle that can be externally charged and generally includes all-electric vehicles as well as plug-in hybrids. In this report we use the term for all-electric vehicles to differentiate them from plug-in hybrid electric vehicles. |
| Lithium-Sulphur Battery | A rechargeable battery that replaces the liquid or polymer electrolyte found in current lithium-ion batteries with sulfur. They have more capacity than Li-ion batteries. |
| Micromobility | Micromobility is one of the many modes of transport involving very-light-duty vehicles to travel short distances. These means of transportation include bikes, e-scooters, e-bikes, mopeds, and scooters. Such vehicles are used on a sharing basis for covering short distances, usually five miles or less. |
| Low Speed Electric Vehicls (LSEVs) | They are low speed (usually less than 25 kmph) light vehicles that do not have an internal combustion engine, and solely use electric energy for propulsion. |


Research Methodology
Mordor Intelligence follows a four-step methodology in all its reports.
- Step-1: Identify Key Variables: To build a robust forecasting methodology, the variables and factors identified in Step-1 are tested against available historical market numbers. Through an iterative process, the variables required for market forecast are set and the model is built based on these variables.
- Step-2: Build a Market Model: Market-size estimations for the historical and forecast years have been provided in revenue and volume terms. Market revenue is calculated by multiplying the volume demand with volume-weighted average battery pack price (per kWh). Battery pack price estimation and forecast takes into account various factors affecting ASP, such as inflation rates, market demand shifts, production costs, technological developments, and consumer preferences, providing estimations for both historical data and future trends.
- Step-3: Validate and Finalize: In this important step, all market numbers, variables, and analyst calls are validated through an extensive network of primary research experts from the market studied. The respondents are selected across levels and functions to generate a holistic picture of the market studied.
- Step-4: Research Outputs: Syndicated Reports, Custom Consulting Assignments, Databases & Subscription Platforms


