
Market Overview
| Study Period | 2021 - 2031 |
|---|---|
| Forecast Data Period | 2026 - 2031 |
| Historical Data Period | 2021 - 2024 |
| Growth Rate | 6.45 % |
| Market Concentration | Medium |
Major Players *Disclaimer: Major Players sorted in no particular order Image © Mordor Intelligence. Reuse requires attribution under CC BY 4.0. | |
Australia Power EPC Market Analysis by Mordor Intelligence
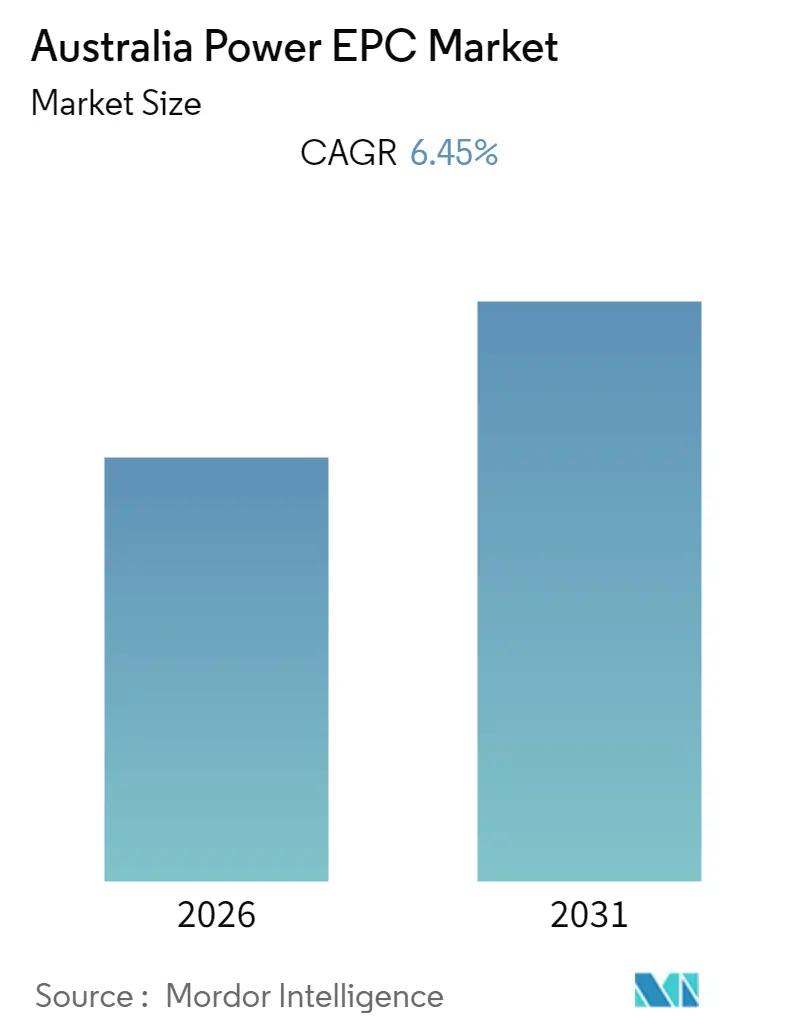
The Australia Power EPC Market is expected to register a CAGR of greater than 6.45% during the forecast period.
- Due to its high installation share, increasing renewable energy installations are expected to dominate the Australian power EPC market during the forecast period.
- According to the Australian Energy Market Operator, regions like Queensland and New South Wales are expected to witness significant growth in energy demand, creating opportunities in the energy market in the long run.
- An increase in thermal-based generation is expected to drive the growth of the Australian power EPC market during the forecast period.
Note: Market size and forecast figures in this report are generated using Mordor Intelligence’s proprietary estimation framework, updated with the latest available data and insights as of 2026.
Market Trends and Insights
Increasing Renewable Energy Installations are Expected to Dominate the Market
- Australia has one of the highest average solar radiation per square meter, one of the highest per capita consumption of residential rooftop solar, and leading solar PV technology in the world but still lags behind the rest of the world in terms of mid-scale and large-scale solar developments.
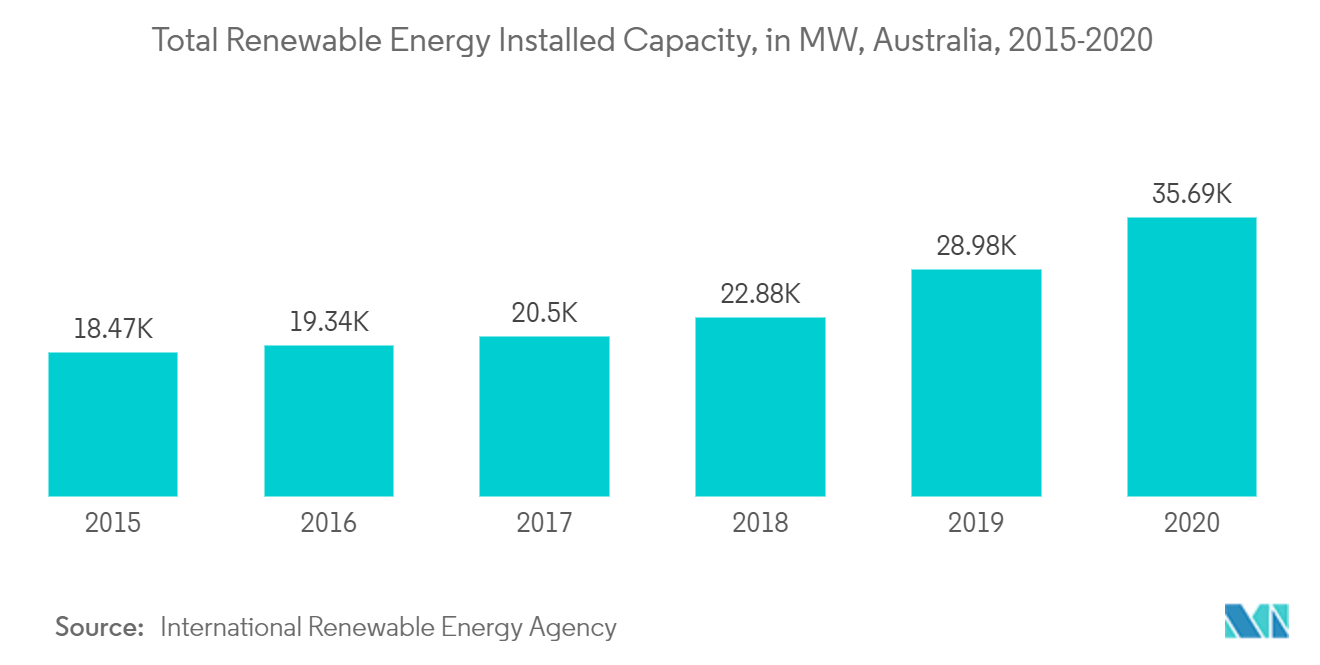
- In 2020, Australia's renewable energy installed capacity stood at 6,710 MW. The share of solar stood at around 35.8% of the total renewable electricity generation. Therefore, the country is expected to witness the increasing deployment of solar PV, which leads to an increase in power EPC contracts in the region.
- In May 2021, Vestas won a 157 MW order from Neoen to deliver the engineering, procurement, and construction (EPC) of Kaban Green Power Hub in Far North Queensland, Australia. The wind power project will feature 28 Vestas V162-5.6 MW turbines from the EnVentus platform.
- Moreover, in May 2020, Sterling and Wilson Solar (SWSL), along with its Australian subsidiary, secured an engineering, procurement, and construction (EPC) contract valued at USD 525 million to build a renewable energy park in Australia.
- The country has seen significant growth in renewable energy installations due to the above points. This further culminates in the improvement of the Australian power EPC market.
Increase in Thermal-based Generation May Drive the Market
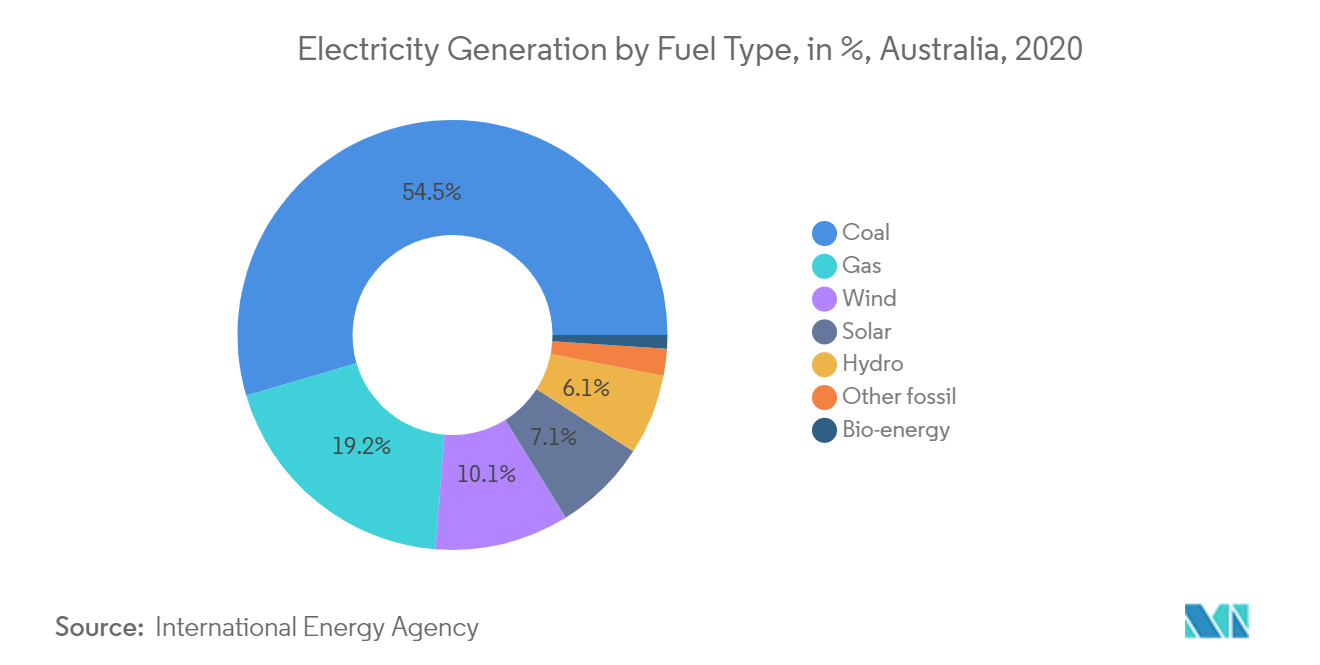
- Power generation in Australia is dominated by fossil fuels, including oil, gas, and coal. In 2020, coal was dominating power generation. However, the country is continuously decreasing the share of coal in power generation.
- Additionally, coal plants, which are the primary source of electricity generation in Australia, accounted for around 54% of electricity generation in 2020.
- In 2020, the government announced 12 new power projects, including natural gas, pumped hydropower, and one coal-fired plant, to increase power supply and bring down energy prices. The projects are expected to boost the EPC contracts in the future significantly.
- In January 2020, the government announced its plan to underwrite two gas power plants: APA Group's proposed 220MW generator in Dandenong, Victoria, and Quinbrook's proposed 132MW facility in Gatton, Queensland.
- Moreover, Energy Australia is planning to construct a gas-fired power station, Marulan Power Station, at Marulan near Goulburn in New South Wales. The project is likely to increase EPC contracts in the coming years.
- Owing to the above points, the increase in therma- based power generation may lead to the growth of the Australian power EPC market during the forecast period.
Regulatory Landscape
Australia's power EPC activity sits within the National Electricity Market (NEM) governance framework. The Australian Energy Market Commission (AEMC) maintains the National Electricity Rules (NER), while the Australian Energy Regulator (AER) enforces compliance and administers transmission and distribution revenue determinations. For project delivery, NER Chapter 5 is a central anchor because it governs network connection, planning, and augmentation processes that EPC contractors must design and build against, including negotiated technical standards for new connections.
Rule and policy activity in 2025-2026 tightened market design around flexibility and reliability. This includes the commencement of changes from the National Electricity Amendment (Integrating price-responsive resources into the NEM) Rule 2024 (effective 31 March 2026) and the Reliability Standard and Settings Review (2026), which recommended a reliability standard of 0.003% expected unserved energy for 2028-2032. For renewable developments, federal frameworks such as the Renewable Energy (Electricity) Act 2000 (compilation effective 1 January 2026) and the Offshore Electricity Infrastructure Act 2021 (for offshore wind feasibility and commercial licensing) shape certification, licensing, and approval pathways, while state planning instruments (for example, NSW transmission guidance) interact with EPBC Act requirements for major transmission and generation approvals.
Value Chain Analysis
The Australia power EPC value chain covers early-stage development and approvals, grid-connection studies under the NER, detailed engineering, procurement of major equipment (turbines, PV modules, inverters, transformers, switchgear), construction and commissioning, and long-term operations handover. Delivery depends closely on network businesses and market bodies, with AEMO planning signals (notably the 2026 Integrated System Plan) informing transmission and system needs. Transmission owners and operators such as Transgrid and Powerlink sponsor large build programs that translate into multi-year EPC packages across lines, substations, and grid-support plant.
Execution is increasingly coordinated around Renewable Energy Zones and major backbone projects, which pulls EPC contractors into multi-stakeholder interfaces (land access, environmental approvals, connection works, and energization sequencing). Powerlink's CopperString program, including the Flinders Substation receiving Ministerial Infrastructure Designation approval in December 2025 and associated workforce accommodation works, illustrates how packaging can extend beyond the network footprint. Transgrid's EnergyConnect interconnector program similarly drives EPC demand, with project substations progressing, including the Dinawan substation schedule milestone referenced for end-Q1 2026. Substation and high-voltage connection capability (for example, solutions up to 500 kV) is a differentiator, while contracting strategy also reflects constraints flagged in national infrastructure assessments, including workforce capacity and approval timelines that affect procurement lead times and the use of framework partners and local supply chains.
Competitive Landscape
The Australian power EPC market is moderately consolidated. Some of the major companies include Origin Energy Ltd, Stanwell Corporation Limited, InterGen Services Inc., EnergyAustralia Holdings Ltd, and AGL Energy Limited.
Australia Power EPC Industry Leaders
-
Origin Energy Ltd
-
Stanwell Corporation Limited
-
InterGen Services Inc
-
EnergyAustralia Holdings Ltd
-
AGL Energy Limited.
- *Disclaimer: Major Players sorted in no particular order

Australia Power EPC Market Companies Covered in this Report
- Origin Energy Ltd
- Stanwell Corporation Limited
- InterGen Services Inc.
- EnergyAustralia Holdings Ltd
- AGL Energy Limited
- Rio Tinto Limited
- NRG Energy Inc.
- Sumitomo Corporation
Market Opportunities and Future Outlook
Current EPC contractor whitespace sits at the intersection of utility-scale renewables, firming, and the grid works needed to connect them. AEMO's 2026 Integrated System Plan frames the build task around large additions of grid-scale wind and solar and storage through 2050. It also highlights distribution-level network developments, including a $600 million spend item, intended to unlock capacity and manage voltage, which expands the addressable EPC scope beyond transmission into distribution augmentations and advanced connection solutions.
Near-term project flow for EPC packaging is supported by 2026 investment and approvals across solar, BESS, and enabling substations. In Q1 2026, 1.1 GW of large-scale renewables were approved and 946 MW reached final investment decision, with a further 2.4 GW reaching FID after the quarter. Named project evidence also supports the pipeline for hybrid and grid-forming assets, including federal environmental approval in July 2026 for Spark Renewables' Dinawan solar and battery project in New South Wales (also linked to CIS underwriting), and financial close in May 2026 for Edify Energy's Smoky Creek and Guthrie's Gap solar-battery hybrid projects in Queensland, with an EPC contract awarded to DT Infrastructure. In parallel, rule changes enabling price-responsive resources (effective 31 March 2026) and National CER Roadmap work on device requirements widen the opportunity set for EPC firms working on grid integration, protection and control, and commissioning for flexible generation, storage, and network support assets.
Recent Industry Developments in Australia Power EPC Market
- July 2026: Spark Renewables secured federal approval under the EPBC Act for the Dinawan solar and battery project in New South Wales. The approval advanced a large hybrid project toward construction readiness, supporting the buildout of grid-scale solar plus storage packages that typically require integrated EPC across generation, BESS, and connection works.
- May 2026: Edify Energy reached financial close for the Smoky Creek and Guthrie's Gap solar-battery hybrid projects in Queensland, and DT Infrastructure was named on the EPC delivery scope. The shift from development to funded execution increases near-term contracting volumes for hybrid plant construction and associated grid-connection infrastructure.
- March 2026: AGL Energy reached final investment decision on the 220 MW Kwinana Gas Power Generation 2 (K2) project in Western Australia. The project adds a firming-oriented thermal EPC workload alongside renewables-heavy programs, reinforcing parallel demand for flexible capacity projects and their balance-of-plant and connection packages.
Australia Power EPC Market Report Scope and Research Methodology
Market Definition and Coverage
For this study, the Australia power EPC market is defined as the value of engineering, procurement, and construction work delivered for power generation projects and for transmission and distribution infrastructure within Australia.
Scope exclusions: We exclude pure operations and maintenance services, routine minor repairs, and standalone equipment sales that are not tied to an EPC delivery scope.
Segments Covered in This Report
- Power Generation
- Thermal
- Renewables
- Others
- Power Transmission and Distribution (T&D)
Data Sources, Market Sizing, and Validation
Desk Research
Desk research is used to set the project pipeline view and the operating context in Australia, before assumptions are put into the sizing model. We typically referenced public sources such as the Australian Energy Regulator, Australian Energy Market Operator planning publications, Clean Energy Council statistics, Australian Bureau of Statistics construction indicators, and government budget and infrastructure program releases.
Along with this, we reviewed company annual reports, investor presentations, and press releases to understand contract language, delivery timelines, and typical scope splits between engineering, major equipment, and site works. When needed, paid subscriptions for company financials and intelligence, patent databases, and shipment level trade databases were used to cross-check contractor activity, equipment import patterns, and technology adoption signals. The examples listed above are not exhaustive, and many other sources were also referred to for data collection, validation, and clarification.
Primary Interviews and Surveys
Primary work was used to confirm what is actually being bid and awarded, and then to pressure-test pricing and schedule assumptions that desk sources do not show clearly. We spoke with EPC-facing stakeholders such as developers, utilities, grid owners, engineering contractors, and key subcontractor groups, and feedback was balanced across major Australian project regions.
To avoid a single perspective driving the final number, responses were compared across buyer and supplier viewpoints, and any large deviations were followed up again before assumptions were locked.
Distribution of primary research fieldwork respondents
| Company type | Respondent position |
|---|---|
| Top tier: 35% | CXOs: 15% |
| Mid tier: 48% | Functional/Unit leaders: 27% |
| Smaller Players: 17% | Managers: 58% |
Market-Sizing & Forecasting
Sizing is built using a combined top-down and bottom-up approach, where national and state level build-out signals are first reconstructed and then checked against what contractors and buyers are seeing in live tenders. The top-down part is anchored on expected additions and upgrades in generation and in network build (such as new lines, substations, and major augmentation works), which are then converted into EPC value using typical cost ranges and EPC scope shares.
A few practical inputs that matter in this market include announced and committed project pipeline by technology, grid connection and commissioning timelines, typical EPC contract structure (lump sum versus split packages), equipment and materials cost movements, and the share of work that is self-performed versus subcontracted. Where public data is patchy, gaps are handled by using ranges agreed with interviewees, followed by narrowing the range based on recent award patterns and comparable project benchmarks.
For forecasting, we leaned on scenario analysis supported by trend checks on macro drivers such as capacity retirements, new renewable and storage build intensity, transmission investment cadence, and financing conditions. The forecast path is then sanity-checked using selective bottom-up approximations like sampled project cost per MW for generation and sampled cost per kilometer and per bay for networks, adjusted for local labor and procurement conditions.
Data Validation & Update Cycle
Validation is done in layers so the final totals do not depend on one assumption. Model outputs are compared with independent market signals such as project award announcements, construction activity indicators, and grid program milestones, and then any sharp jumps are reviewed line by line to explain the driver.
Before sign-off, the work goes through multi-step internal reviews, and we re-contact interviewees when variances appear that cannot be explained by pipeline movement or pricing shifts. Reports are refreshed annually, with interim updates when material events occur such as major policy changes, large project cancellations, or step-changes in input costs. Right before delivery, a final pass is completed so clients receive the latest updated view rather than an older snapshot.
Mordor Intelligence's Australia Power Epc Market Size Versus Other Published Estimates
Published numbers for Australia power EPC do not always match because different teams draw the boundary around EPC differently and they also pick different years for pricing and currency conversion. The gap can widen further when a forecast uses a single cost curve even though equipment prices and labor availability can move sharply across project cycles.
The spread is often driven by what gets counted as EPC value (full project value versus contractor delivered scope only), whether transmission and distribution is included consistently, and how project timing is treated when schedules slip. A refresh-led model helps here because assumptions on award timing, cost escalation, and currency timing are revisited during update cycles, which then keeps the total closer to what is being bid and built, a step applied by Mordor Intelligence.
Benchmark comparison
| Source | Market Size | Gaps in Research Methodology |
|---|---|---|
| Mordor Intelligence | USD 0.00 B (2026) | |
| Regional Consultancy A | USD 6.50 B (2023) | This figure is anchored to an earlier base year and appears to use a narrower regional cut within Australia, which can miss national grid programs and later-cycle projects. It also does not clearly separate EPC delivered scope from adjacent owner costs, which can shift the stated value. |
| Industry Publisher B | USD 12.80 B (2026) | The estimate is presented as a high-growth view and seems to include a wider set of power sources and enabling works, which can pull in adjacent infrastructure value beyond contracted EPC. Differences in cost escalation and currency timing assumptions for imported equipment can also change the same-year USD total. |
Overall, the comparison shows that timing choices, scope boundary choices, and how pricing is updated are the main practical reasons the numbers drift apart. By keeping EPC scope tied to project delivery milestones and by re-checking cost and timing inputs during refresh points, the resulting market size stays traceable to a clear demand pool and repeatable calculation steps.
Key Questions Answered in the Report
What is the current Australia Power EPC Market size?
The Australia Power EPC Market is projected to register a CAGR of 6.45% during the forecast period (2026-2031)
Who are the key players in Australia Power EPC Market?
Origin Energy Ltd, Stanwell Corporation Limited, InterGen Services Inc, EnergyAustralia Holdings Ltd and AGL Energy Limited. are the major companies operating in the Australia Power EPC Market.
What years does this Australia Power EPC Market cover?
The report covers the Australia Power EPC Market historical market size for years: 2021, 2022, 2023, 2024 and 2025. The report also forecasts the Australia Power EPC Market size for years: 2026, 2027, 2028, 2029, 2030 and 2031.