Market Overview
| Study Period | 2020 - 2031 |
|---|---|
| Forecast Data Period | 2026 - 2031 |
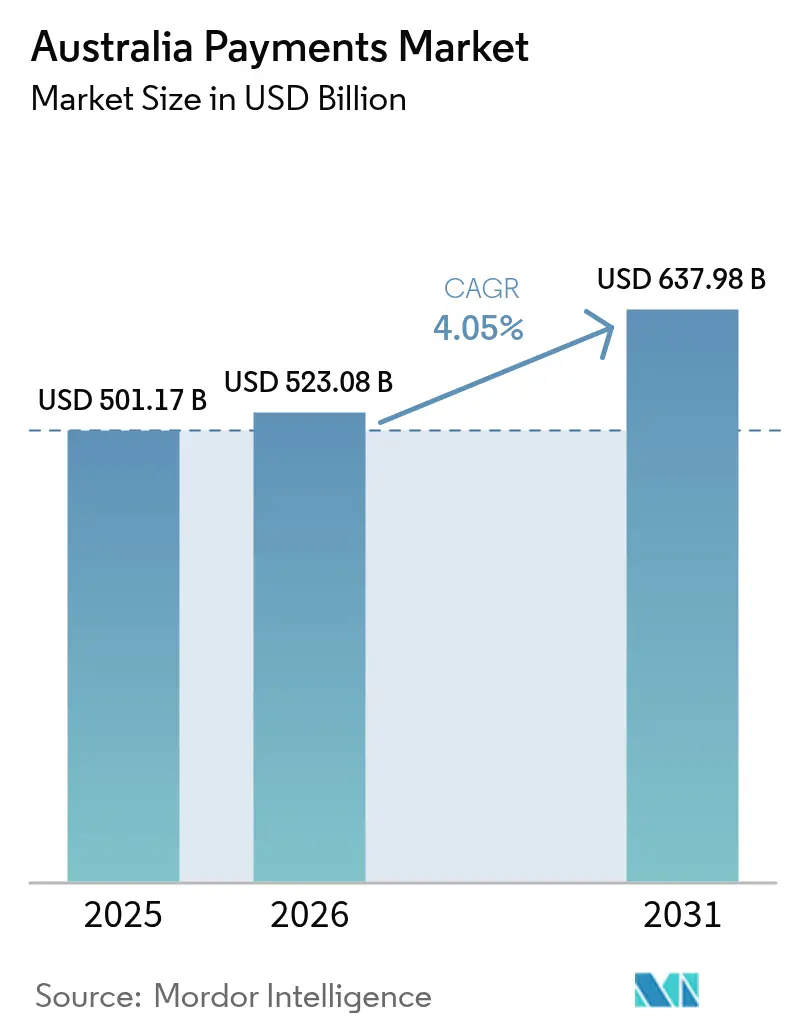
| Base Year Market Size (2025) | USD 501.17 Billion |
| Market Size (2026) | USD 523.08 Billion |
| Market Size (2031) | USD 637.98 Billion |
| Growth Rate (2026 - 2031) | 4.05% CAGR |
| Market Concentration | Medium |
Major Players *Disclaimer: Major Players sorted in no particular order Image © Mordor Intelligence. Reuse requires attribution under CC BY 4.0. | |
Australia Payments Market Analysis by Mordor Intelligence
The Australia payments market size is projected to expand from USD 501.17 billion in 2025 and USD 523.08 billion in 2026 to USD 637.98 billion by 2031, registering a CAGR of 4.05% between 2026 to 2031. Demand is tilting toward real-time settlement as the New Payments Platform (NPP) scales, marketplace merchants tighten checkout flows, and consumers favor contactless and mobile wallets over legacy rails. Four large banks still anchor issuance and acquiring, yet their pricing power is slipping as fintech providers use cloud processing, instant settlement, and software integrations to win new merchants. Open Banking’s Consumer Data Right is nurturing account-to-account initiation that bypasses card interchange, while ISO 20022 messaging enriches payment data and lowers reconciliation overhead for corporates. Meanwhile, fraud exposure and interchange-fee reform are putting near-term pressure on profit pools, encouraging incumbents to accelerate tokenization, network routing, and embedded-finance offerings.
Key Report Takeaways
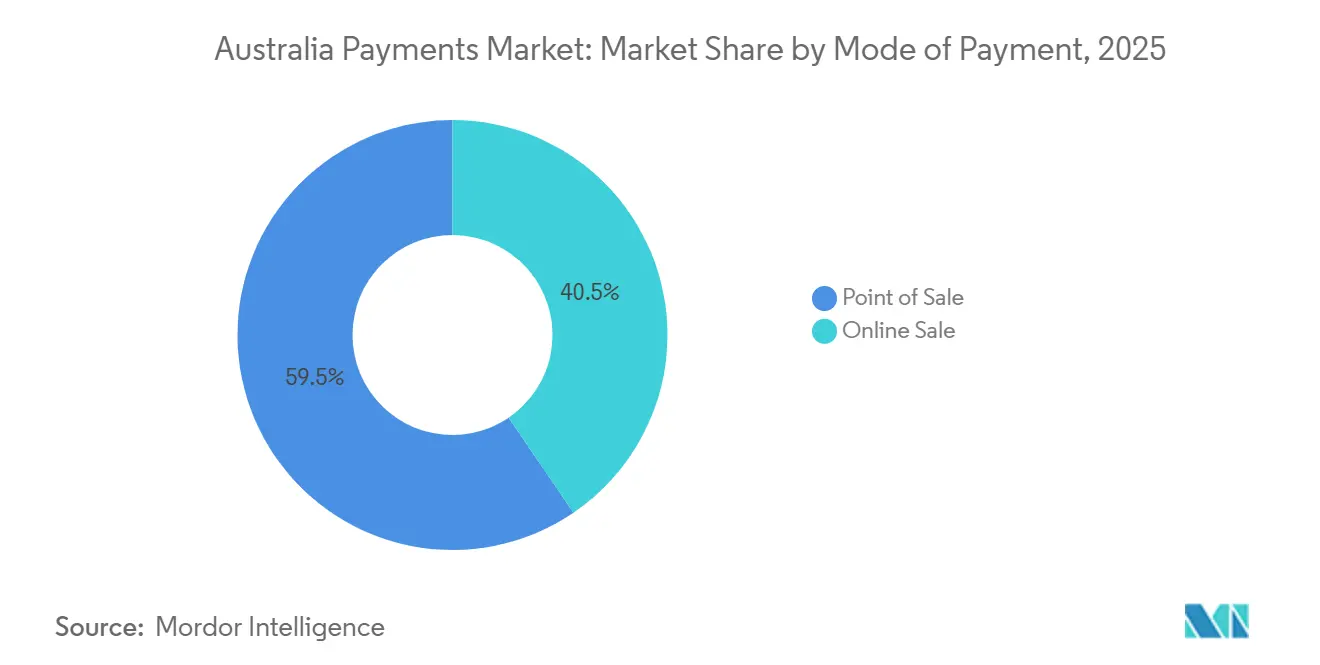
- By mode of payment, point-of-sale channels commanded 59.51% of value in 2025, while online sales channels are advancing at a 17.43% CAGR to 2031.
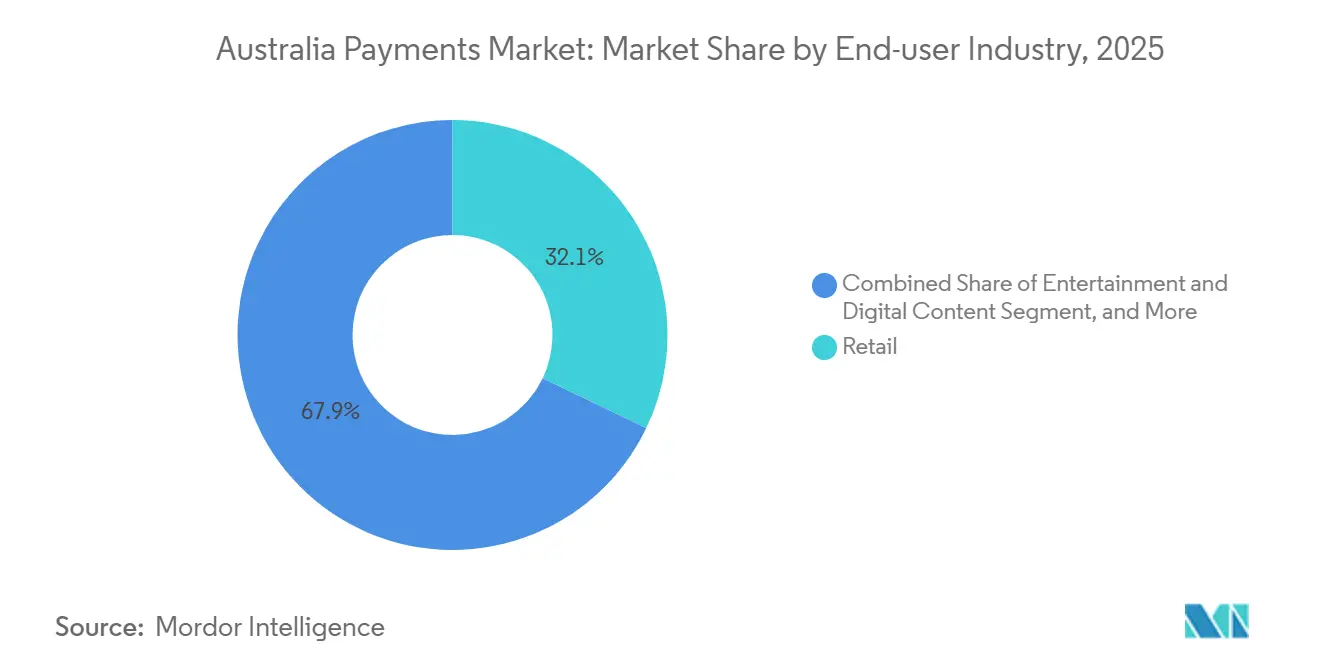
- By end-user industry, retail held 32.12% revenue share in 2025, and entertainment and digital content are expanding at a 16.76% CAGR through 2031.
Note: Market size and forecast figures in this report are generated using Mordor Intelligence’s proprietary estimation framework, updated with the latest available data and insights as of 2026.
Australia Payments Market Trends and Insights
Drivers Impact Analysis*
| Driver | (~) % Impact on CAGR Forecast | Geographic Relevance | Impact Timeline |
|---|---|---|---|
| Expansion of E-commerce and Marketplaces | +1.5% | National, strong in New South Wales and Victoria | Medium term (2-4 years) |
| Growth in Contactless Card Usage | +1.2% | National, led by Sydney, Melbourne, Brisbane urban centers | Short term (≤ 2 years) |
| Roll-out of New Payments Platform (NPP) | +0.8% | National, early enterprise uptake in financial hubs | Medium term (2-4 years) |
| Instant Salary-Access Services | +0.3% | National, dense in retail and hospitality employers | Long term (≥ 4 years) |
| Open Banking API Monetization | +0.2% | National, early traction in New South Wales, Victoria | Long term (≥ 4 years) |
| ISO 20022 Migration Enhancing Data-rich Flow | +0.2% | National, corporate and wholesale segments | Medium term (2-4 years) |
| Source: Mordor Intelligence | |||


Expansion of E-commerce and Marketplaces
Online retail sales reached AUD 62.3 billion (USD 41.1 billion) in 2025, a 14.2% lift over 2024 as platforms embedded one-click checkout that shaved 18% off cart abandonment.[1]Australian Bureau of Statistics, “Retail Trade, Australia,” abs.gov.au Marketplace operators rely on headless commerce stacks that dynamically route to the lowest-cost acquirer or the network with the highest authorization rate. Buy Now Pay Later (BNPL) penetration climbed to 31% of online transactions, reflecting millennial and Gen Z resistance to revolving credit. Cross-border e-commerce added AUD 3.2 billion (USD 2.11 billion) as Alipay and WeChat Pay integrations catered to Chinese visitors, though foreign-exchange reporting rules remain a friction point. Least-cost routing on dual-network debit cards saved merchants an estimated AUD 120 million (USD 79 million) in 2025, reinforcing incentives to steer volume toward EFTPOS.
Growth in Contactless Card Usage
Contactless accounted for 93% of card-present payments in 2025, the highest global penetration.[2]Australian Payments Network, “Australian Payments Statistics,” auspaynet.com.au Limits rose to AUD 250 (USD 165) without a signature, while mobile wallets supplied 47% of contactless volume. Issuers prefer digital provisioning to cut physical-card costs and enable device-based tokenization that curbs fraud. Commonwealth Bank disclosed that 68% of its credit-card spend flowed through Apple Pay or Google Pay in 2025. Widespread tap-and-go adoption is prompting merchants to consolidate NFC, QR, and account-to-account acceptance into a single terminal, reducing hardware duplication.
Roll-out of New Payments Platform (NPP)
NPP processed 1.24 billion transactions worth AUD 1.1 trillion (USD 726 billion) in 2025, up 35% year-over-year.[3]New Payments Platform Australia, “Platform Statistics,” nppa.com.au PayTo overlay agreements hit 18 million, offering a real-time, low-cost substitute for card-on-file billing. Corporate take-up lags because legacy ERP systems cannot translate ISO 20022 messages, yet a June 2026 deadline will force Tier 1 banks to provide connectivity, potentially unlocking AUD 200 billion (USD 132 billion) in supply-chain payments.
Instant Salary-Access Services
Earned-wage platforms advanced AUD 812 million (USD 536 million) in 2025, serving 340,000 shift and gig workers. APIs plug directly into payroll, compute accrued pay in real time, and deliver funds within minutes for a flat fee. Liquidity risk moves from employers to fintechs, who securitize receivables or fund advances from the balance sheet. The Australian Securities and Investments Commission clarified that the model is not consumer credit if no interest accrues. Employers in quick-service restaurants and warehousing positions offer on-demand pay as a retention perk in tight labor markets.
Restraints Impact Analysis*
| Restraint | (~) % Impact on CAGR Forecast | Geographic Relevance | Impact Timeline |
|---|---|---|---|
| Interchange Fee Regulation Pressure | -0.5% | National, all card-based transactions | Medium term (2-4 years) |
| Rising Fraud and Chargeback Costs | -0.4% | National, higher in online channels | Short term (≤ 2 years) |
| Payment-rail Outages Risk Perception | -0.2% | National, concentrated in real-time payment users | Short term (≤ 2 years) |
| De-banking of High-risk Merchants | -0.1% | National, cryptocurrency and remittance sectors | Long term (≥ 4 years) |
| Source: Mordor Intelligence | |||
Interchange Fee Regulation Pressure
The Reserve Bank’s 2025 consultation proposed trimming the weighted-average credit-card fee to 0.65% and debit to 0.15%, shifting AUD 450 million (USD 297 million) per year from issuers to merchants.[4]Reserve Bank of Australia, “Review of Retail Payments Regulation,” rba.gov.au Least-cost routing already diverted AUD 120 million (USD 79 million) of interchange in its first year. Schemes are responding by pushing single-network debit and exclusive neobank issuance deals, moves that fragment acceptance and blunt routing mandates. Issuers warn that lower interchange will erode rewards economics and push premium cardholders to offshore programs, yet regulators appear intent on converging toward European-style caps by 2028. The pressure is accelerating issuer experiments with subscription pricing and embedded lending at checkout.
Rising Fraud and Chargeback Costs
Fraud losses hit AUD 532 million (USD 351 million) in 2025, up 22% on the prior year, with 58% tied to authorized push-payment scams. Real-time rails compress detection windows to seconds, leaving limited recovery options. A voluntary Scam-Safe Accord reimburses victims up to AUD 10,000 (USD 6,600) but excludes crypto and foreign remittances. Card-not-present fraud forced merchants to absorb AUD 187 million (USD 123 million) in chargebacks and spurred mandatory 3-D Secure for purchases above AUD 50 (USD 33). The Reserve Bank is canvassing a liability-shift model akin to that of the United Kingdom, which would increase compliance costs by up to AUD 100 million (USD 66 million) annually.
*Our forecasts treat driver/restraint impacts as directional, not additive. The impact forecasts reflect baseline growth, mix effects, and variable interactions.
Segment Analysis
By Mode Of Payment: Online-First Strategies Dilute Card Dominance
Point-of-sale channels captured 59.51% of transaction value in 2025, yet online channels are expanding at a 17.43% CAGR to 2031 as checkout orchestration steers flows toward the cheapest rail and the highest authorization rate. Debit cards processed 64% of card volume in 2025, while credit cards concentrated on higher-ticket travel and luxury purchases. Digital wallets already account for 31% of in-store spend and 28% of online spend, signaling that device-based tokenization is eroding physical-card reliance. Buy Now Pay Later (BNPL) handled AUD 19.2 billion (USD 12.7 billion) in 2025, and its share of the Australia payments market size is projected to rise in tandem with QR code and virtual-card acceptance. Legacy gateway providers face margin pressure as software-as-a-service platforms embed native payments and promise instant settlement.
Merchants are upgrading to unified acceptance hardware that reads NFC, QR, and PayID prompts, trimming duplicate terminal costs and letting staff pivot between contactless and account-to-account flows. Least-cost routing is expected to swing an additional eight percentage points of debit volume to eftpos by 2027, compressing interchange and amplifying the Australia payments market share of real-time account transfers. Cash on delivery retreated to 2.1% of online orders after courier surcharges, reinforcing the convenience gap between instant digital confirmation and manual settlement. Should PayTo gain standard support in major e-commerce carts, subscription merchants are poised to abandon card-on-file for mandate-based debits that settle in under a minute. Collectively, these shifts confirm that online-first strategies are reshaping channel economics faster than headline transaction totals suggest.

By End-User Industry: Digital Content Monetization Outpaces Retail
Retail maintained a 32.12% slice of 2025 payment value given the scale of grocery, apparel, and home goods, yet entertainment and digital content revenue is advancing at a 16.76% CAGR through 2031. Streaming platforms processed more than 18 million local subscriptions in 2025, using tokenized credentials that auto-update expiry dates and reduce involuntary churn. Telehealth, virtual fitness, and in-app gaming purchases are migrating to recurring billing, raising the Australia payments market size allocated to micro-transactions and subscription bundles. Hospitality and travel rebounded to 18.4% of spend as tourism recovered, with foreign-issued cards supplying 41% of sector volume and lifting acquirer demand for dynamic-currency conversion.
Government and utilities segments are pivoting from BPAY and direct debit to PayTo mandates, trimming dishonor fees and accelerating refund cycles. Healthcare gap payments reached AUD 1.8 billion (USD 1.19 billion) in 2025 as integrated practice-management systems tokenized cards at appointment booking. Universities processed AUD 340 million (USD 224 million) of tuition through BNPL plans, illustrating how installment models are diffusing into essential services. These changes are set to raise the Australia payments market share of digital-first verticals while gradually reducing cash and check dependence. As recurring, in-app, and cross-border use cases scale, retail’s proportional dominance is likely to slip even if its absolute spend continues to climb.

Geography Analysis
New South Wales accounted for roughly one-third of the Australia payments market in 2025, powered by Sydney’s financial hubs and high contactless fare adoption where 78% of transit rides tapped cards or phones. Victoria provided about 25% of the back of Melbourne’s dense retail and hospitality footprints, which led uptake of BNPL and QR acceptance among small businesses. Queensland delivered 20%, buoyed by domestic and international tourism; Alipay and WeChat Pay alone processed AUD 1.1 billion (USD 726 million) in tourist spend.
Western Australia plus South Australia, Tasmania, the Northern Territory, and the Australian Capital Territory together supplied the remaining 20%. Miners in Western Australia issued thousands of virtual procurement cards to streamline supplier settlements. South Australia’s digital government push shifted 87% of citizen transactions online, exploiting NPP refunds for speed. Tasmania and Northern Territory still rely on cash for 12% of volume, but mobile POS from Tyro and Square is closing the acceptance gap. The Australian Capital Territory processed USD 5.41 billion in federal procurement, 64% of which was via purchasing cards integrated with e-invoicing.
Queensland’s rapid adoption of QR and contactless among hospitality merchants positions it for the highest regional growth, while Western Australia’s corporate virtual-card programs are enlarging the Australia payments market size for commercial payments. Regional differences in rail preference, acceptance hardware, and real-time uptake will shape product roadmaps for issuers and acquirers through the forecast horizon.
Competitive Landscape
The four major banks controlled 75% of card issuance and 68% of acquiring revenue in 2025, but competitive intensity is rising as fintechs target underserved niches. Tyro processed USD 25.5 billion and gained 9.2% of new merchants by offering same-day settlement and integrated health-claim terminals. Stripe’s partnership with Xero embedded acceptance into accounting software for 180,000 small businesses, cutting traditional acquirers from the workflow. Adyen launched issuing to let platforms distribute virtual expense cards, processing USD 118.8 million in its first quarter.
Product differentiation is shifting from headline rates toward data-rich value adds. Block extends working-capital loans based on processing history and financed USD 792 million during 2025. Visa and Mastercard are investing in tokenization and biometrics to preserve credentials as real-time rails steal volume. Wise leverages multi-currency accounts to offer cheaper FX and real-time NPP settlement that undercuts banks by 180 basis points.
Account-to-account orchestration and PayTo mandate management remain white space, with only 5% of recurring volume converted by December 2025. Fintechs that simplify ISO 20022 mapping, instant confirmation, and reconciliation can peel volume from both card networks and direct-debit incumbents. Competitive response will dictate whether top-four bank share erodes toward 60% by 2031 or stabilizes via embedded-finance partnerships.
Australia Payments Industry Leaders
Commonwealth Bank of Australia
Westpac Banking Corporation
National Australia Bank Ltd.
Australia and New Zealand Banking Group Ltd.
PayPal Holdings Inc.
- *Disclaimer: Major Players sorted in no particular order


Recent Industry Developments
- February 2026: Commonwealth Bank of Australia launched StepPay, a real-time installment product that processed AUD 120 million (USD 85.34 million) in its first month.
- January 2026: Stripe committed AUD 85 million (USD 60.45 million) to expand its Sydney engineering hub for localized payment-orchestration tools.
- December 2025: Mastercard and Australia Post piloted biometric fingerprint cards for contactless purchases above AUD 250 (USD 177.79).
- November 2025: Tyro Payments acquired Medipass for AUD 42 million (USD 29.87 million), embedding instant health-fund rebates into POS terminals.


Australia Payments Market Report Scope
The Australia Payments Market Report is Segmented by Mode of Payment (Point of Sale including Card Payments, Digital Wallets, and Other; Online Sale including Card Payments, Digital Wallets, and Other Online Sales), End-user Industry (Retail, Entertainment and Digital Content, Healthcare, Hospitality and Travel, Government and Utilities, and Other), and Geography (New South Wales, Victoria, Queensland, Western Australia, Rest of Regions). The Market Forecasts are Provided in Terms of Value (USD).
By Mode of Payment
| Point of Sale | Card Payments |
| Debit Cards | |
| Credit Cards | |
| Bank Financing Prepaid Cards | |
| Digital Wallets (includes Mobile Wallet) | |
| Other Point of Sale | |
| Online Sale | Card Payments |
| Debit Cards | |
| Credit Cards | |
| Bank Financing Prepaid Cards | |
| Digital Wallets | |
| Other Online Sales (includes Cash on Delivery, Bank Transfer, and Buy Now Pay Later) |
By End-user Industry
| Retail |
| Entertainment and Digital Content |
| Healthcare |
| Hospitality and Travel |
| Government and Utilities |
| Other End-user Industries |
| By Mode of Payment | Point of Sale | Card Payments |
| Debit Cards | ||
| Credit Cards | ||
| Bank Financing Prepaid Cards | ||
| Digital Wallets (includes Mobile Wallet) | ||
| Other Point of Sale | ||
| Online Sale | Card Payments | |
| Debit Cards | ||
| Credit Cards | ||
| Bank Financing Prepaid Cards | ||
| Digital Wallets | ||
| Other Online Sales (includes Cash on Delivery, Bank Transfer, and Buy Now Pay Later) | ||
| By End-user Industry | Retail | |
| Entertainment and Digital Content | ||
| Healthcare | ||
| Hospitality and Travel | ||
| Government and Utilities | ||
| Other End-user Industries | ||


Key Questions Answered in the Report
How large will electronic payments in Australia be by 2031?
The Australia payments market is forecast to reach USD 637.98 billion by 2031 at a 4.05% CAGR.
Which payment rail is growing fastest in Australia?
Online channels routed through orchestration layers are expanding at 17.43% a year, while real-time NPP transfers logged a 35% volume jump in 2025.
What share of in-person card payments use contactless?
Contactless penetration hit 93% of card-present transactions in 2025, the highest level globally.
How are interchange-fee reforms affecting issuers?
Proposed caps could redirect about USD 297 million annually from issuers to merchants, prompting banks to rethink rewards and fee structures.
Which state processes the most payments?
New South Wales contributes roughly 35% of national payment value thanks to Sydney’s dense retail and financial centers.
What role do Buy Now Pay Later services play?
BNPL handled AUD 19.2 billion in 2025, representing 31% of online transactions and expanding into in-store QR code acceptance.
Page last updated on:


