Market Overview
| Study Period | 2018 - 2031 |
|---|---|
| Forecast Data Period | 2026 - 2031 |
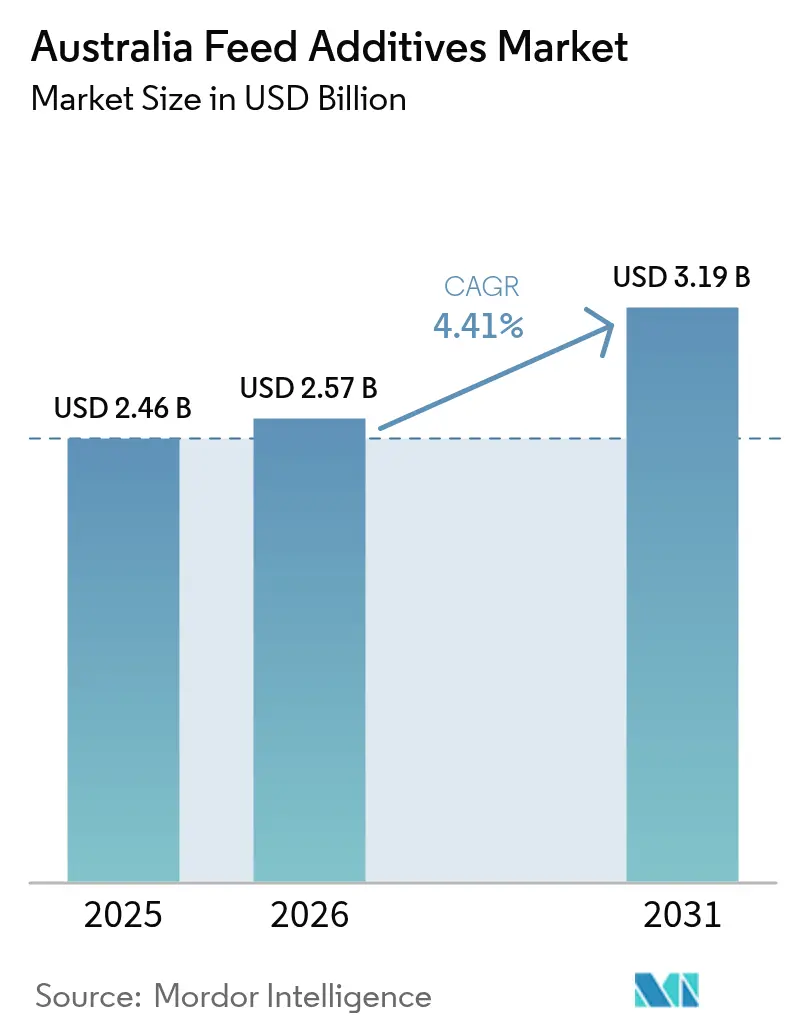
| Base Year Market Size (2025) | USD 2.46 Billion |
| Market Size (2026) | USD 2.57 Billion |
| Market Size (2031) | USD 3.19 Billion |
| Growth Rate (2026 - 2031) | 4.41% CAGR |
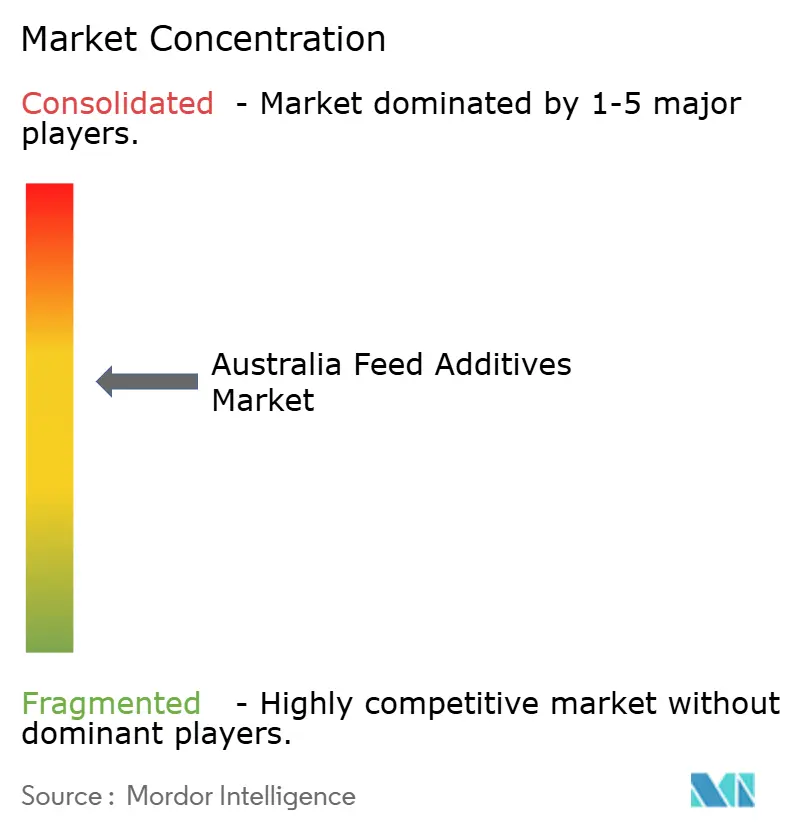
| Market Concentration | Medium |
Major Players *Disclaimer: Major Players sorted in no particular order Image © Mordor Intelligence. Reuse requires attribution under CC BY 4.0. | |
Australia Feed Additives Market Analysis by Mordor Intelligence
The Australia feed additives market size was valued at USD 2.46 billion in 2025 and estimated to grow from USD 2.57 billion in 2026 to reach USD 3.19 billion by 2031, at a CAGR of 4.41% during the forecast period (2026-2031). This steady expansion reflects the country’s pivot from antibiotic-dependent feeding toward precision nutrition programs that lift feed conversion efficiency while meeting tightening safety rules. Demand also tracks Australia’s broader push to modernize agriculture, where feed now absorbs the largest share of domestically grown grain and accounts for 65% of total poultry production costs. Intensifying protein consumption, consolidation of commercial feed mills, and government grants for feed efficiency upgrades jointly propel uptake of high-value functional additives. Meanwhile, the regulatory climate favors suppliers able to navigate the Australian Pesticides and Veterinary Medicines Authority (APVMA) process and to verify additive performance across diverse production systems. Supply-chain risks around imported amino acids and vitamins persist, yet new methane-reducing formulations and precision water-dosage technologies offer pathways to unlock fresh revenue streams within the Australia feed additives market.
Key Report Takeaways
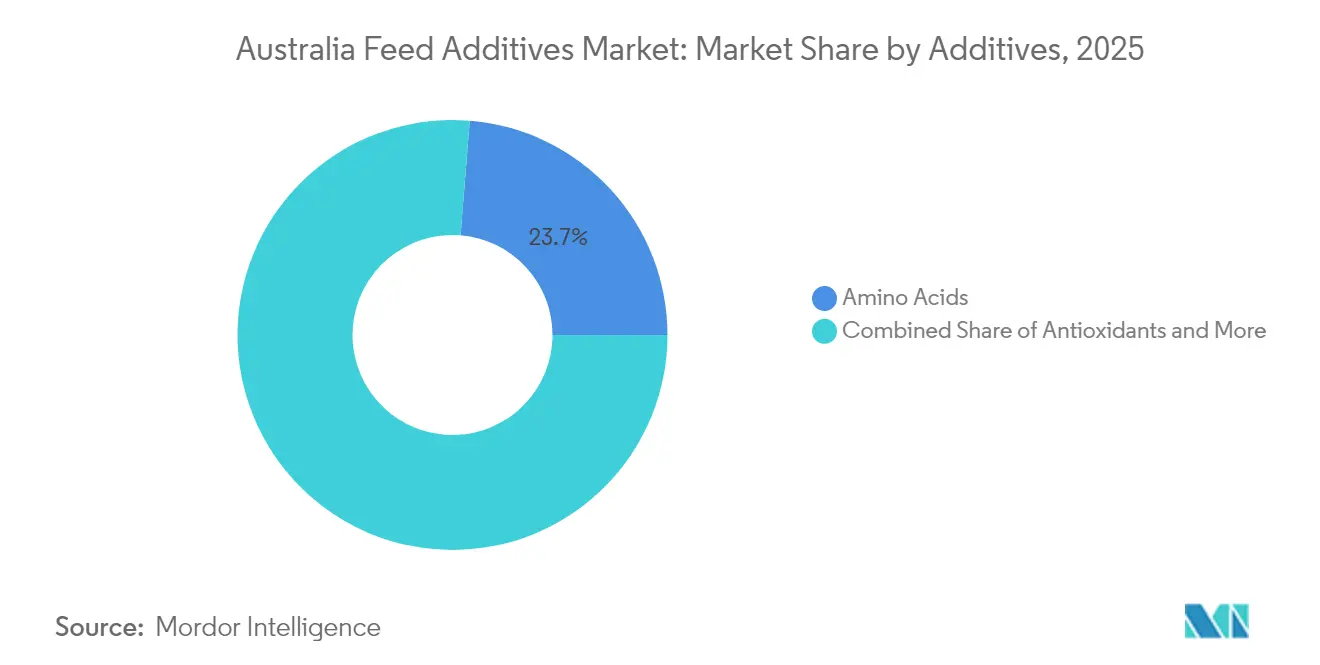
- By additive, amino acids led with 23.72% of the Australia feed additives market share in 2025, while antioxidants are projected to expand at a 4.44% CAGR to 2031.
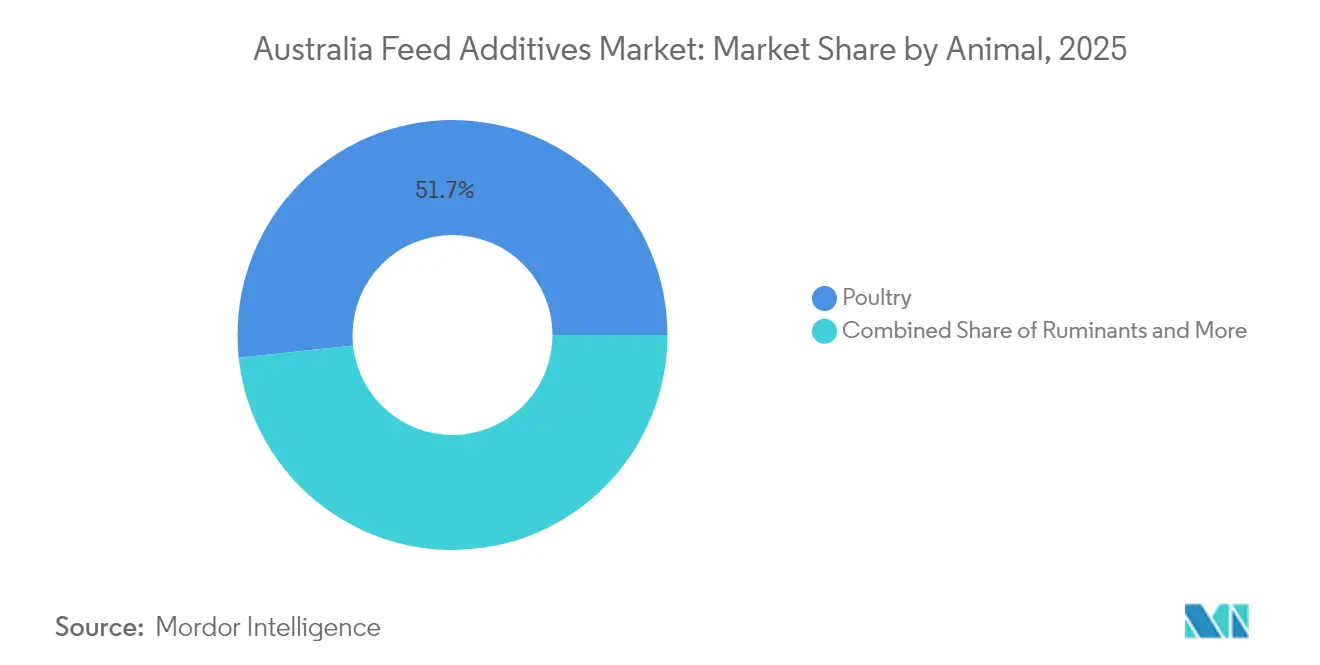
- By animal, poultry held 51.68% of the Australia feed additives market share in 2025, while ruminants are forecast to expand at a 4.63% CAGR through 2031.
Note: Market size and forecast figures in this report are generated using Mordor Intelligence’s proprietary estimation framework, updated with the latest available data and insights as of 2026.
Australia Feed Additives Market Trends and Insights
Drivers Impact Analysis*
| Driver | (~) % Impact on CAGR Forecast | Geographic Relevance | Impact Timeline |
|---|---|---|---|
| Ban on Antibiotic Growth Promoters Fuels Demand for Alternative Additives | +1.8% | National, concentrated in intensive livestock regions | Short term (≤ 2 years) |
| Rising Domestic Demand for High-Protein Meat and Seafood Boosts Feed Efficiency Focus | +1.5% | National, with a higher impact in coastal aquaculture zones | Medium term (2-4 years) |
| Consolidation of Large Commercial Feed Mills Increases Functional-Additive Inclusion | +1.2% | National, concentrated in grain belt regions | Medium term (2-4 years) |
| Government Feed Conversion Efficiency Grants Accelerate Innovative Additive Uptake | +0.9% | National, with priority for drought-affected regions | Short term (≤ 2 years) |
| Rapid Adoption of Native Seaweed Extracts to Cut Enteric Methane in Cattle | +0.8% | National, concentrated in beef cattle regions | Long term (≥ 4 years) |
| Growth of On-Farm Precision-Mixing Systems Enabling Micro-Dosed Nutraceutical Additives | +0.6% | National, concentrated in intensive production areas | Medium term (2-4 years) |
| Source: Mordor Intelligence | |||
Ban on Antibiotic Growth Promoters Fuels Demand for Alternative Additives
Australia's comprehensive antibiotic stewardship framework has created an irreversible shift toward functional feed additives that support animal health without compromising antimicrobial resistance strategies. The Australian Veterinary Association's 2024 guidelines reinforced restrictions on prophylactic antibiotic use, particularly in intensive livestock systems where historical reliance on growth promoters reached 76% of all veterinary antimicrobial applications through feed channels. This regulatory tightening has accelerated the adoption of prebiotics, probiotics, and phytogenic compounds that deliver comparable growth performance while maintaining feed-to-food safety integrity. The transition particularly benefits organic acid producers and enzyme manufacturers, as these alternatives demonstrate proven efficacy in maintaining gut health and nutrient utilization efficiency without generating antimicrobial residues.
Rising Domestic Demand for High-Protein Meat and Seafood Boosts Feed Efficiency Focus
Australian protein consumption patterns increasingly favor high-quality meat and seafood products, driving livestock producers to optimize feed conversion ratios through targeted additive strategies. Domestic aquaculture production has emerged as a particular growth driver, with barramundi and salmon farming operations requiring specialized amino acid profiles and digestibility enhancers to achieve competitive feed conversion rates below 1.5:1. This demand shift has elevated the importance of precision nutrition approaches that can deliver consistent protein deposition while minimizing environmental nitrogen excretion. Feed mills are responding by incorporating advanced enzyme cocktails and encapsulated amino acids that release nutrients in synchronization with animal metabolic cycles, creating sustained demand for high-value additive formulations.
Consolidation of Large Commercial Feed Mills Increases Functional-Additive Inclusion
The Australian feed manufacturing sector's consolidation around major players like Ridley Corporation and integrated producers has standardized the inclusion of functional additives across larger production volumes. Commercial feed mills now manufacture approximately 50% of Australia's 13 million tons of annual compound feed production, with these facilities increasingly equipped with precision dosing systems and quality assurance protocols that favor consistent additive inclusion. This consolidation trend reduces the transaction costs associated with additive procurement and technical support, while enabling mills to justify investments in specialized handling equipment for sensitive compounds like probiotics and enzymes. The scale economies achieved through consolidated purchasing also improve the economic viability of premium additives that might be cost-prohibitive for smaller, on-farm mixing operations.
Government Feed Conversion Efficiency Grants Accelerate Innovative Additive Uptake
Australia's National Agricultural Innovation Agenda has allocated targeted funding for feed conversion efficiency improvements, creating financial incentives for livestock producers to adopt advanced additive technologies. The 2024 grant program specifically supports research and demonstration projects that can quantify improvements in feed utilization efficiency, with successful applicants receiving up to AUD 500,000 (USD 335,000) for a multi-year trial [1].Source: Department of Agriculture, Fisheries and Forestry, “Feed Conversion Efficiency Grants,” agriculture.gov.au This government support has been particularly influential in accelerating the adoption of methane-reducing additives and precision feeding systems that require substantial upfront investments but deliver measurable environmental and economic benefits. The grant structure also encourages collaboration between additive manufacturers, research institutions, and commercial producers, fostering innovation pathways that might not emerge through market forces alone.
Restraints Impact Analysis*
| Restraint | (~) % Impact on CAGR Forecast | Geographic Relevance | Impact Timeline |
|---|---|---|---|
| Stringent Australian Pesticides and Veterinary Medicines Authority (APVMA) Approval Timelines Prolong Product Launches | -1.4% | National, affecting all market participants | Long term (≥ 4 years) |
| Volatile Import Prices for Key Amino Acids Linked to Chinese Supply Concentration | -1.1% | National, concentrated in intensive livestock regions | Short term (≤ 2 years) |
| Producer Skepticism Toward the Return on Investment (ROI) of Next-Generation Phytogenic Blends | -0.7% | National, concentrated in traditional farming regions | Medium term (2-4 years) |
| Limited Cold-Chain Capacity for Liquid Probiotic Products in Remote Regions | -0.5% | Remote and northern Australia regions | Medium term (2-4 years) |
| Source: Mordor Intelligence | |||
Stringent Australian Pesticides and Veterinary Medicines Authority (APVMA) Approval Timelines Prolong Product Launches
The Australian Pesticides and Veterinary Medicines Authority's rigorous evaluation process for new feed additives creates substantial barriers to market entry, with approval timelines typically extending 18-24 months for novel compounds and formulations. This regulatory bottleneck particularly impacts innovative additive categories like precision-fermented amino acids and encapsulated probiotics, where manufacturers must demonstrate both efficacy and safety through extensive feeding trials and residue studies [2]Source: Australian Pesticides and Veterinary Medicines Authority, “Guidance on Feed Additive Registration,” apvma.gov.au. The extended approval process creates first-mover disadvantages for companies investing in cutting-edge technologies, as competitors can observe market responses and regulatory feedback before committing resources to similar applications. Additionally, the regulatory uncertainty discourages smaller companies from pursuing Australian market entry, effectively consolidating market opportunities among established players with sufficient resources to navigate complex approval processes.
Volatile Import Prices for Key Amino Acids Linked to Chinese Supply Concentration
Australia's heavy dependence on Chinese amino acid imports creates significant price volatility that directly impacts feed formulation costs and additive adoption rates. Chinese suppliers control approximately 70% of global methionine and lysine production, with price fluctuations of 20-30% occurring within quarterly periods due to environmental regulations, energy costs, and trade policy changes. This supply concentration risk became particularly acute during 2024, when production disruptions at major Chinese facilities led to amino acid price increases that forced Australian feed mills to reformulate diets and reduce inclusion rates of premium additives. The price volatility creates planning challenges for livestock producers and feed manufacturers, who struggle to maintain consistent additive programs when input costs fluctuate unpredictably.
*Our forecasts treat driver/restraint impacts as directional, not additive. The impact forecasts reflect baseline growth, mix effects, and variable interactions.
Segment Analysis
By Additive: Amino Acids Drive Precision Nutrition
Amino acids captured 23.72% market share in 2025, positioning this segment as the cornerstone of Australia's feed additive landscape through 2031. The dominance reflects intensive livestock operations' shift toward precision nutrition strategies that optimize protein synthesis while minimizing nitrogen excretion and environmental impact. Lysine and methionine represent the largest volume applications, particularly in poultry and swine diets, where these limiting amino acids directly influence feed conversion efficiency and carcass quality.
Antioxidants emerge as the fastest-growing segment with 4.44% CAGR through 2031, driven by antioxidant reduction mandates and growing recognition of gut microbiome management in animal health and performance. Antioxidants such as citric acid are crucial in reducing the colonization of pathogens and limiting the production of toxic metabolites, thereby improving the availability of protein, calcium, phosphorus, magnesium, and zinc. The segment dynamics reflect a broader industry transition from commodity-based supplementation toward targeted, science-based additive programs that address specific physiological and environmental challenges.


By Animal: Poultry Leads Intensive Applications
Poultry applications dominated with 51.68% market share in 2025, reflecting the sector's advanced adoption of precision feeding technologies and automated additive delivery systems. The poultry industry's integration of feed weighing, blending, and monitoring systems enables consistent inclusion of sensitive additives like enzymes and probiotics, while the sector's controlled production environment supports the economic justification for premium additive programs. The aquaculture market is driven by expanding salmon and barramundi production, which requires specialized amino acid profiles and digestibility enhancers to achieve competitive feed conversion ratios.
Ruminants emerge as the fastest-growing segment at 4.63% CAGR, driven by ruminant applications that face unique challenges related to extensive grazing systems and variable feed quality, yet opportunities exist in methane-reducing additives and precision water supplementation technologies that can deliver consistent benefits across diverse production environments. Swine operations represent a stable but mature market segment, with growth primarily driven by genetic improvements that require more precise nutritional support. The animal segmentation trends reflect Australia's agricultural structure, where intensive livestock operations near population centers drive additive adoption, while extensive grazing systems require specialized delivery technologies to achieve economic viability.
Geography Analysis
Australia's feed additives market exhibits distinct regional patterns that reflect the country's diverse agricultural landscape and infrastructure capabilities. The eastern grain belt regions of New South Wales, Victoria, and southern Queensland concentrate the majority of commercial feed manufacturing and intensive livestock operations, creating dense demand for sophisticated additive programs that can optimize feed conversion efficiency in controlled production environments. These regions benefit from established distribution networks, technical support services, and regulatory expertise that enable rapid adoption of innovative additive technologies. The proximity to major ports also facilitates cost-effective import of key ingredients like amino acids and vitamins, while supporting export-oriented livestock operations that require internationally competitive production systems.
Northern Australia presents distinct challenges and opportunities for feed additive applications, with extensive cattle operations requiring specialized delivery systems that can function reliably in remote locations with limited infrastructure. The region's tropical climate creates unique nutritional challenges, including higher mineral requirements and increased susceptibility to heat stress, driving demand for targeted supplementation programs. Water-based delivery systems like DIT AgTech's uDOSE technology have gained traction in these regions, enabling precise nutrient delivery without requiring frequent animal handling or sophisticated feed mixing equipment. The northern regions also present opportunities for methane-reducing additives, as extensive beef operations face increasing pressure to demonstrate environmental stewardship and carbon footprint reduction .
Western Australia's agricultural regions combine intensive livestock operations with extensive grazing systems, creating diverse market opportunities for feed additive applications. The state's isolation from eastern manufacturing centers creates logistical challenges that favor shelf-stable additive formulations and regional distribution strategies. The region's strong export orientation and proximity to Asian markets create demand for high-quality animal products that justify premium additive programs. The state's mining industry also creates unique opportunities for livestock operations that can utilize mining infrastructure and water resources, potentially supporting specialized feeding systems that incorporate advanced additive technologies.
Competitive Landscape
The Australia feed additives market demonstrates moderate concentration with established multinational players, including IFF(Danisco Animal Nutrition), DSM-Firmenich, SHV (Nutreco NV), Lonza Group Ltd., and Solvay S.A. Market leadership requires navigating APVMA's complex approval processes while maintaining technical support capabilities across Australia's diverse agricultural regions and production systems. Cargill and DSM-Firmenich exemplify successful strategies that combine global R&D capabilities with local manufacturing and distribution assets, enabling rapid response to regulatory changes and customer requirements.
Emerging opportunities exist for specialized companies that can address niche applications like methane reduction, precision water supplementation, and cold-chain-free probiotic delivery. The regulatory framework creates barriers to entry but also provides sustained competitive advantages for companies that successfully navigate approval processes and establish market presence.
Technology adoption patterns suggest that competitive success will increasingly depend on digital integration capabilities, as precision feeding systems and telemetry-enabled monitoring become standard practice in intensive livestock operations. Companies like DIT AgTech demonstrate how specialized technology platforms can capture value by enabling precise delivery of high-value additives that were previously impractical in extensive production systems.
Australia Feed Additives Industry Leaders
IFF(Danisco Animal Nutrition)
SHV (Nutreco NV)
Lonza Group Ltd.
Solvay S.A.
DSM-Firmenich
- *Disclaimer: Major Players sorted in no particular order

Recent Industry Developments
- July 2025: DSM-Firmenich secured ABB automation systems for its new Bovaer production facility in Scotland, with the methane-reducing additive already commercially available in Australia and likely to benefit from increased global production capacity.
- January 2023: Novus International has acquired the biotechnology company Agrivida to advance the development of new feed additives. This acquisition follows a two-year commercial partnership between Novus and Agrivida, during which Novus supported the sale of Agrivida's flagship product, GRAINZYME.
- June 2022: Delacon and Cargill collaborated to establish a global plant-based phytogenic feed additives business for enhanced animal nutrition. The partnership has helped in extensive feed additives expertise as well as an increase in the global presence.


Australia Feed Additives Market Report Scope
Additive
| Acidifiers | By Sub Additive | Fumaric Acid |
| Lactic Acid | ||
| Propionic Acid | ||
| Other Acidifiers | ||
| Amino Acids | By Sub Additive | Lysine |
| Methionine | ||
| Threonine | ||
| Tryptophan | ||
| Other Amino Acids | ||
| Antibiotics | By Sub Additive | Bacitracin |
| Penicillins | ||
| Tetracyclines | ||
| Tylosin | ||
| Other Antibiotics | ||
| Antioxidants | By Sub Additive | Butylated Hydroxyanisole (BHA) |
| Butylated Hydroxytoluene (BHT) | ||
| Citric Acid | ||
| Ethoxyquin | ||
| Propyl Gallate | ||
| Tocopherols | ||
| Other Antioxidants | ||
| Binders | By Sub Additive | Natural Binders |
| Synthetic Binders | ||
| Enzymes | By Sub Additive | Carbohydrases |
| Phytases | ||
| Other Enzymes | ||
| Flavors & Sweeteners | By Sub Additive | Flavors |
| Sweeteners | ||
| Minerals | By Sub Additive | Macrominerals |
| Microminerals | ||
| Mycotoxin Detoxifiers | By Sub Additive | Binders |
| Biotransformers | ||
| Phytogenics | By Sub Additive | Essential Oil |
| Herbs & Spices | ||
| Other Phytogenics | ||
| Pigments | By Sub Additive | Carotenoids |
| Curcumin & Spirulina | ||
| Prebiotics | By Sub Additive | Fructo Oligosaccharides |
| Galacto Oligosaccharides | ||
| Inulin | ||
| Lactulose | ||
| Mannan Oligosaccharides | ||
| Xylo Oligosaccharides | ||
| Other Prebiotics | ||
| Probiotics | By Sub Additive | Bifidobacteria |
| Enterococcus | ||
| Lactobacilli | ||
| Pediococcus | ||
| Streptococcus | ||
| Other Probiotics | ||
| Vitamins | By Sub Additive | Vitamin A |
| Vitamin B | ||
| Vitamin C | ||
| Vitamin E | ||
| Other Vitamins | ||
| Yeast | By Sub Additive | Live Yeast |
| Selenium Yeast | ||
| Spent Yeast | ||
| Torula Dried Yeast | ||
| Whey Yeast | ||
| Yeast Derivatives |
By Animal
| Aquaculture | By Sub Animal | Fish |
| Shrimp | ||
| Other Aquaculture Species | ||
| Poultry | By Sub Animal | Broiler |
| Layer | ||
| Other Poultry Birds | ||
| Ruminants | By Sub Animal | Beef Cattle |
| Dairy Cattle | ||
| Other Ruminants | ||
| Swine | ||
| Other Animals |
| Additive | Acidifiers | By Sub Additive | Fumaric Acid |
| Lactic Acid | |||
| Propionic Acid | |||
| Other Acidifiers | |||
| Amino Acids | By Sub Additive | Lysine | |
| Methionine | |||
| Threonine | |||
| Tryptophan | |||
| Other Amino Acids | |||
| Antibiotics | By Sub Additive | Bacitracin | |
| Penicillins | |||
| Tetracyclines | |||
| Tylosin | |||
| Other Antibiotics | |||
| Antioxidants | By Sub Additive | Butylated Hydroxyanisole (BHA) | |
| Butylated Hydroxytoluene (BHT) | |||
| Citric Acid | |||
| Ethoxyquin | |||
| Propyl Gallate | |||
| Tocopherols | |||
| Other Antioxidants | |||
| Binders | By Sub Additive | Natural Binders | |
| Synthetic Binders | |||
| Enzymes | By Sub Additive | Carbohydrases | |
| Phytases | |||
| Other Enzymes | |||
| Flavors & Sweeteners | By Sub Additive | Flavors | |
| Sweeteners | |||
| Minerals | By Sub Additive | Macrominerals | |
| Microminerals | |||
| Mycotoxin Detoxifiers | By Sub Additive | Binders | |
| Biotransformers | |||
| Phytogenics | By Sub Additive | Essential Oil | |
| Herbs & Spices | |||
| Other Phytogenics | |||
| Pigments | By Sub Additive | Carotenoids | |
| Curcumin & Spirulina | |||
| Prebiotics | By Sub Additive | Fructo Oligosaccharides | |
| Galacto Oligosaccharides | |||
| Inulin | |||
| Lactulose | |||
| Mannan Oligosaccharides | |||
| Xylo Oligosaccharides | |||
| Other Prebiotics | |||
| Probiotics | By Sub Additive | Bifidobacteria | |
| Enterococcus | |||
| Lactobacilli | |||
| Pediococcus | |||
| Streptococcus | |||
| Other Probiotics | |||
| Vitamins | By Sub Additive | Vitamin A | |
| Vitamin B | |||
| Vitamin C | |||
| Vitamin E | |||
| Other Vitamins | |||
| Yeast | By Sub Additive | Live Yeast | |
| Selenium Yeast | |||
| Spent Yeast | |||
| Torula Dried Yeast | |||
| Whey Yeast | |||
| Yeast Derivatives | |||
| By Animal | Aquaculture | By Sub Animal | Fish |
| Shrimp | |||
| Other Aquaculture Species | |||
| Poultry | By Sub Animal | Broiler | |
| Layer | |||
| Other Poultry Birds | |||
| Ruminants | By Sub Animal | Beef Cattle | |
| Dairy Cattle | |||
| Other Ruminants | |||
| Swine | |||
| Other Animals | |||


Market Definition
- FUNCTIONS - For the study, feed additives are considered to be commercially manufactured products that are used to enhance characteristics such as weight gain, feed conversion ratio, and feed intake when fed in appropriate proportions.
- RESELLERS - Companies engaged in reselling feed additives without value addition have been excluded from the market scope, to avoid double counting.
- END CONSUMERS - Compound feed manufacturers are considered to be end-consumers in the market studied. The scope excludes farmers buying feed additives to be used directly as supplements or premixes.
- INTERNAL COMPANY CONSUMPTION - Companies engaged in the production of compound feed as well as the manufacturing of feed additives are part of the study. However, while estimating the market sizes, the internal consumption of feed additives by such companies has been excluded.
| Keyword | Definition |
|---|---|
| Feed additives | Feed additives are products used in animal nutrition for purposes of improving the quality of feed and the quality of food from animal origin, or to improve the animals’ performance and health. |
| Probiotics | Probiotics are microorganisms introduced into the body for their beneficial qualities. (It maintains or restores beneficial bacteria to the gut). |
| Antibiotics | Antibiotic is a drug that is specifically used to inhibit the growth of bacteria. |
| Prebiotics | A non-digestible food ingredient that promotes the growth of beneficial microorganisms in the intestines. |
| Antioxidants | Antioxidants are compounds that inhibit oxidation, a chemical reaction that produces free radicals. |
| Phytogenics | Phytogenics are a group of natural and non-antibiotic growth promoters derived from herbs, spices, essential oils, and oleoresins. |
| Vitamins | Vitamins are organic compounds, which are required for normal growth and maintenance of the body. |
| Metabolism | A chemical process that occurs within a living organism in order to maintain life. |
| Amino acids | Amino acids are the building blocks of proteins and play an important role in metabolic pathways. |
| Enzymes | Enzyme is a substance that acts as a catalyst to bring about a specific biochemical reaction. |
| Anti-microbial resistance | The ability of a microorganism to resist the effects of an antimicrobial agent. |
| Anti-microbial | Destroying or inhibiting the growth of microorganisms. |
| Osmotic balance | It is a process of maintaining salt and water balance across membranes within the body's fluids. |
| Bacteriocin | Bacteriocins are the toxins produced by bacteria to inhibit the growth of similar or closely related bacterial strains. |
| Biohydrogenation | It is a process that occurs in the rumen of an animal in which bacteria convert unsaturated fatty acids (USFA) to saturated fatty acids (SFA). |
| Oxidative rancidity | It is a reaction of fatty acids with oxygen, which generally causes unpleasant odors in animals. To prevent these, antioxidants were added. |
| Mycotoxicosis | Any condition or disease caused by fungal toxins, mainly due to contamination of animal feed with mycotoxins. |
| Mycotoxins | Mycotoxins are toxin compounds that are naturally produced by certain types of molds (fungi). |
| Feed Probiotics | Microbial feed supplements positively affect gastrointestinal microbial balance. |
| Probiotic yeast | Feed yeast (single-cell fungi) and other fungi used as probiotics. |
| Feed enzymes | They are used to supplement digestive enzymes in an animal’s stomach to break down food. Enzymes also ensure that meat and egg production is improved. |
| Mycotoxin detoxifiers | They are used to prevent fungal growth and to stop any harmful mold from being absorbed in the gut and blood. |
| Feed antibiotics | They are used both for the prevention and treatment of diseases but also for rapid growth and development. |
| Feed antioxidants | They are used to protect the deterioration of other feed nutrients in the feed such as fats, vitamins, pigments, and flavoring agents, thus providing nutrient security to the animals. |
| Feed phytogenics | Phytogenics are natural substances, added to livestock feed to promote growth, aid in digestion, and act as anti-microbial agents. |
| Feed vitamins | They are used to maintain the normal physiological function and normal growth and development of animals. |
| Feed flavors and sweetners | These flavors and sweeteners help to mask tastes and odors during changes in additives or medications and make them ideal for animal diets undergoing transition. |
| Feed acidifiers | Animal feed acidifiers are organic acids incorporated into the feed for nutritional or preservative purposes. Acidifiers enhance congestion and microbiological balance in the alimentary and digestive tracts of livestock. |
| Feed minerals | Feed minerals play an important role in the regular dietary requirements of animal feed. |
| Feed binders | Feed binders are the binding agents used in the manufacture of safe animal feed products. It enhances the taste of food and prolongs the storage period of the feed. |
| Key Terms | Abbreviation |
| LSDV | Lumpy Skin Disease Virus |
| ASF | African Swine Fever |
| GPA | Growth Promoter Antibiotics |
| NSP | Non-Starch Polysaccharides |
| PUFA | Polyunsaturated Fatty Acid |
| Afs | Aflatoxins |
| AGP | Antibiotic Growth Promoters |
| FAO | The Food And Agriculture Organization of the United Nations |
| USDA | The United States Department of Agriculture |


Research Methodology
Mordor Intelligence follows a four-step methodology in all our reports.
- Step-1: IDENTIFY KEY VARIABLES: In order to build a robust forecasting methodology, the variables and factors identified in Step-1 are tested against available historical market numbers. Through an iterative process, the variables required for market forecast are set and the model is built on the basis of these variables.
- Step-2: Build a Market Model: Market-size estimations for the forecast years are in nominal terms. Inflation is not a part of the pricing, and the average selling price (ASP) is kept constant throughout the forecast period.
- Step-3: Validate and Finalize: In this important step, all market numbers, variables and analyst calls are validated through an extensive network of primary research experts from the market studied. The respondents are selected across levels and functions to generate a holistic picture of the market studied.
- Step-4: Research Outputs: Syndicated Reports, Custom Consulting Assignments, Databases & Subscription Platforms


