
Market Overview
| Study Period | 2020 - 2031 |
|---|---|
| Forecast Data Period | 2026 - 2031 |
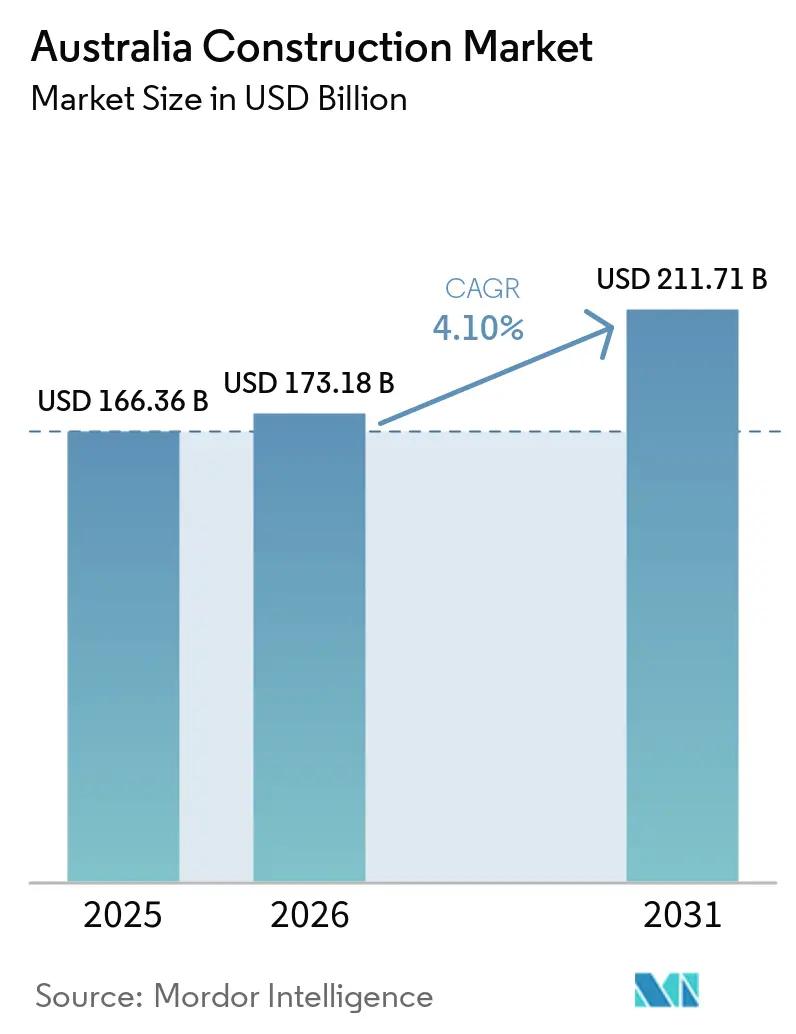
| Base Year Market Size (2025) | USD 166.36 Billion |
| Market Size (2026) | USD 173.18 Billion |
| Market Size (2031) | USD 211.71 Billion |
| Growth Rate (2026 - 2031) | 4.10 % |
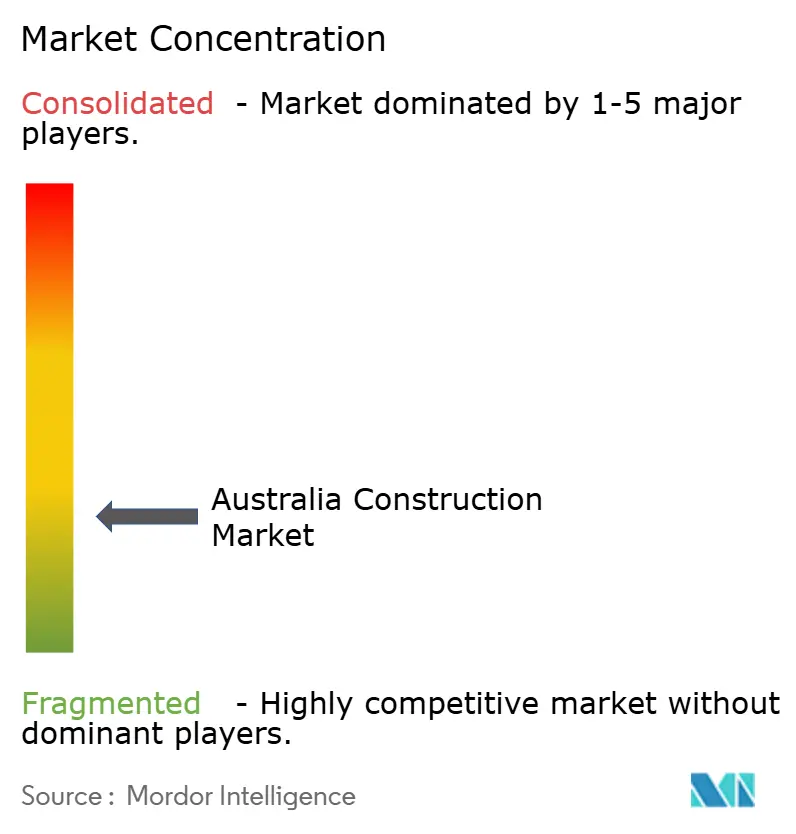
| Market Concentration | Low |
Major Players *Disclaimer: Major Players sorted in no particular order Image © Mordor Intelligence. Reuse requires attribution under CC BY 4.0. | |
Australia Construction Market Analysis by Mordor Intelligence
Australia Construction Market size in 2026 is estimated at USD 173.18 billion, growing from 2025 value of USD 166.36 billion with 2031 projections showing USD 211.71 billion, growing at 4.1% CAGR over 2026-2031.
Large-scale fiscal stimulus, record migration-driven housing demand, and rising public investment in transport and clean-energy assets underpin this outlook. Tier-1 contractors continue to win bigger civil packages while smaller firms struggle with price volatility, pushing consolidation. Prefabrication, modular methods, and digital engineering adoption are increasing as contractors seek productivity gains and compliance with tougher sustainability codes. At the same time, material-cost pressures and labor shortages temper margins, keeping risk management central to project delivery across the Australia construction market.
Key Report Takeaways
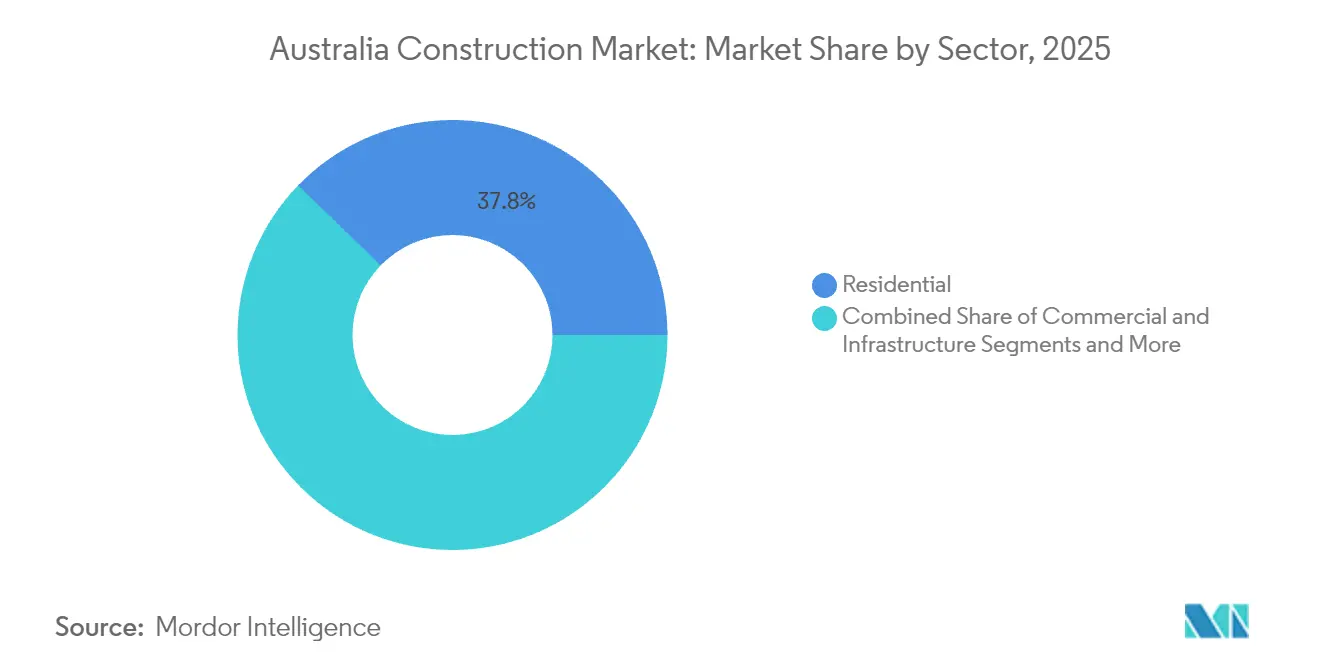
- By sector, the residential segment led with 37.75% of Australia construction market share in 2025, while infrastructure is set to grow fastest at a 6.18% CAGR through 2031.
- By construction type, new construction accounted for 78.45% of the Australia construction market size in 2025; repair & maintenance is projected to expand at a 4.34% CAGR to 2031.
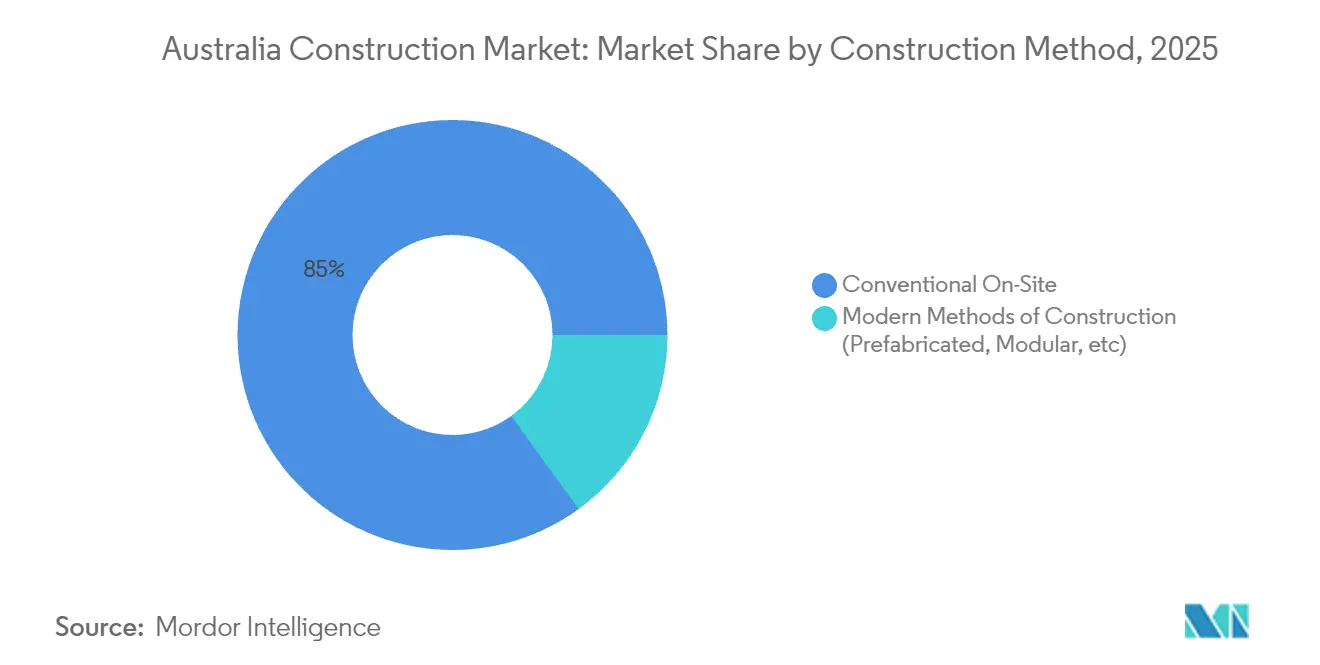
- By construction method, conventional on-site work commanded an 84.98% share of the Australia construction market size in 2025, and modern methods are advancing at a 7.12% CAGR through 2031.
- By investment source, private funding held 90.70% of the Australia construction market share in 2025; public investment records the highest projected CAGR at 6.42% through 2031.
- By Geography, New South Wales contributed 32.10% share of the Australia construction market size in 2025, and Western Australia is on track for the quickest growth at a 4.48% CAGR to 2031.
Note: Market size and forecast figures in this report are generated using Mordor Intelligence’s proprietary estimation framework, updated with the latest available data and insights as of 2026.
Australia Construction Market Trends and Insights
Drivers Impact Analysis*
| Driver | ( ~ ) % Impact on CAGR Forecast | Geographic Relevance | Impact Timeline |
|---|---|---|---|
| Infrastructure-funded fiscal stimulus pipeline | +1.8% | National, with concentration in NSW, Queensland, Victoria | Medium term (2-4 years) |
| Migration-led housing demand rebound | +1.2% | National, with early gains in Sydney, Melbourne, Brisbane | Short term (≤ 2 years) |
| Decarbonisation mandates for public works | +0.9% | National, led by NSW and Victoria regulatory frameworks | Long term (≥ 4 years) |
| Rapid uptake of digital engineering & BIM | +0.7% | National, with higher adoption in tier-1 contractors | Medium term (2-4 years) |
| Expansion of renewable-energy megaprojects | +0.6% | Western Australia, Queensland, with spillover to Victoria | Long term (≥ 4 years) |
| Government first-nations procurement quotas | +0.3% | National, with emphasis on regional and remote areas | Medium term (2-4 years) |
| Source: Mordor Intelligence | |||
Infrastructure-funded Fiscal Stimulus Pipeline
Record federal and state allocations are reshaping project pipelines by prioritizing roads, rail, and energy assets. The 2025-26 federal budget earmarks USD 17.1 billion for transport corridors, while Queensland’s USD 5.75 billion Logan & Gold Coast Faster Rail scheme connects Olympic venues with commuter hubs. Victoria sustains momentum via a USD 208 billion rolling capital program that averages USD 19.3 billion annually despite a tight labor supply. These commitments draw private co-investment, deepen subcontractor pipelines, and amplify materials demand across the Australian construction market. The medium-term effect is a reliable baseline of civil workloads that shields contractors from cyclical downturns.
Migration-led Housing Demand Rebound
Net overseas migration of 518,100 people in 2024 has widened the dwelling shortfall, lifting residential approvals after a brief interest-rate dip. The federal target of 1.2 million new homes by 2029 requires completions to jump from 176,000 to 240,000 annually, creating visibility for developers and volume homebuilders. Investor sentiment is improving as rental yields rise in major cities, supporting multi-family projects. Skills gaps persist, however, with the sector needing 90,000 extra workers, thereby inflating wages and stretching schedules. Short-term growth in the Australian construction market, therefore, rests on bridging labor shortages and fast-tracking approvals to match high-density demand hotspots[1].
Decarbonization Mandates for Public Works
The National Construction Code 2025 tightens commercial energy-efficiency thresholds, while NSW’s Sustainable Buildings SEPP aims to cut 2.6 million tCO₂e by 2033. Queensland now requires 7-star residential energy ratings, pushing architects and contractors toward low-carbon materials and on-site renewables. These rules shift bid evaluation toward carbon credentials and life-cycle performance, giving early adopters of green-cement, recycled steel, and mass-timber systems a competitive edge. Over the long term, the mandates funnel additional value into specialized consultancies and green-tech suppliers across the Australia construction market.
Rapid Uptake of Digital Engineering & BIM
Technology diffusion is accelerating: 37% of firms now deploy AI-enabled design coordination, up from 26% in 2023. Infrastructure Victoria estimates AI could shave 23% off education projects ' overruns, saving USD 516.1 million by 2055. Contractors are layering drones, robotics, and GPR into asset inspection workflows, lowering rework and safety costs. Each additional technology adopted is linked to a 1.14% revenue uplift, reinforcing ROI arguments. Wider digital adoption increases transparency for financiers and regulators, accelerating payment cycles and improving cash-flow stability across the construction industry in Australia.
Restraints Impact Analysis*
| Restraint | ( ~ ) % Impact on CAGR Forecast | Geographic Relevance | Impact Timeline |
|---|---|---|---|
| Material-price volatility & supply chain bottlenecks | -1.4% | National, with acute impact on Queensland and Western Australia | Short term (≤ 2 years) |
| Skilled-labour shortages & wage inflation | -1.1% | National, with critical shortages in NSW and Victoria | Medium term (2-4 years) |
| Tightening credit & high mortgage rates | -0.8% | National, with greater impact on residential construction | Short term (≤ 2 years) |
| Rising insurance premiums on combustible cladding | -0.4% | National, with particular focus on high-rise developments | Medium term (2-4 years) |
| Source: Mordor Intelligence | |||
Material-price Volatility & Supply-chain Bottlenecks
Building construction prices rose 31.1% between September 2020 and June 2024, while house construction costs climbed 40.8% in the same span. Steel, concrete, and gypsum continue to see double-digit quarterly rises, with suppliers warning bathroom fixtures could add another 7% in 2025. Contractors locked into fixed-price contracts face margin erosion, fuelling a 28% jump in insolvencies to 2,832 firms in FY 2024 AFR.COM. Although global freight rates have eased, domestic logistics and specialized component shortages still generate scheduling risk that subtracts momentum from the Australia construction market.
Skilled-labor Shortages & Wage Inflation
Construction unemployment fell to a record low of 3.2% in early 2025, leaving projects in Sydney and Melbourne short of carpenters, electricians, and project managers. BuildSkills Australia warns the sector needs 90,000 extra workers to meet housing targets, yet only 2.8% of recent migrants hold construction roles. Firms are offering premiums and flexible rosters to attract talent, but higher wage bills raise tender prices and stall marginal projects. Over the medium term, limited training capacity and slow skills-recognition processes threaten delivery schedules, shaving 1.1 percentage points off the potential CAGR for the Australia construction market.
*Our forecasts treat driver/restraint impacts as directional, not additive. The impact forecasts reflect baseline growth, mix effects, and variable interactions.
Segment Analysis
By Sector: Infrastructure Leads Growth Momentum
Infrastructure spending has reset the competitive mix, yet residential remains the largest contributor with a 37.75% Australia construction market share in 2025. Civil contractors are ramping up resources to deliver the USD 7.1 billion Brisbane 2032 venues and the USD 17.1 billion federal road-rail slate, driving order books beyond 2027. Renewable-energy assets such as Western Australia’s USD 584 million Clean Energy Link North and the USD 2.8 billion Alkimos Desalination Plant illustrate the pivot toward climate-resilient infrastructure.
Infrastructure exhibits the fastest 6.18% CAGR through 2031 as governments front-load capital programs for productivity and decarbonization aims. The Australia construction market size for transport corridors alone is projected to reach USD 63.4 billion by 2031, propelled by corridor duplications and intermodal hubs. Residential activity benefits from the USD 1.5 billion Housing Support Program, yet approvals remain below the 240,000 annual threshold required to rebalance supply. Commercial construction is muted, but pockets such as data centers show 57% year-over-year growth driven by AI workloads, offering diversification to contractors.

By Construction Type: Renovation Gains Traction
New construction held a commanding 78.45% of % Australian construction market share in 2025, underscoring the scale of greenfield housing estates and mega-infrastructure builds. However, repair & maintenance logs a 4.34% fastest CAGR to 2031 as asset owners extend lifecycles under fiscal and carbon constraints. Regulatory tightening through the National Construction Code 2025 mandates retrofits for energy efficiency, compelling commercial portfolios to upgrade HVAC, façades, and onsite renewables.
High-profile refurbishments, such as the Reserve Bank headquarters escalation from USD 260 million to USD 1.1 billion after asbestos discoveries, highlight the complexity premiums embedded in retrofit work. Asset management strategies increasingly prioritize predictive maintenance, leveraging IoT sensors to schedule interventions before failures. For contractors, the renovation wave offers counter-cyclical revenue, helping stabilize earnings when greenfield pipelines pause, thereby supporting balanced growth in the Australia construction market.
By Construction Method: Modern Methods Accelerate
Conventional on-site activity still dominated with an 84.98% Australia construction market size share in 2025, reflecting entrenched procurement models and supply chains. Yet, prefabricated and modular solutions are accelerating at a 7.12% CAGR through 2031 on government backing and demonstrable time savings. The federal USD 54 million modular-housing fund and NSW’s 24-unit South Grafton project, finished in six months, show proof-of-concept for speed-to-market.
Imports of prefabricated homes reached USD 500 million over five years, with Chinese suppliers holding a 70% share. The Australian Building Codes Board has issued a dedicated handbook to streamline compliance, mitigating approval-risk perceptions. Scale, workforce upskilling, and localized manufacturing remain barriers, but accelerating adoption is expected to compress delivery times by up to 40%, supporting higher turnover in the Australia construction market.
By Investment Source: Public Sector Momentum
Private capital retained a 90.70% Australia construction market share in 2025, driven by housing and commercial pipelines. Public investment, however, is forecast for a 6.42% CAGR through 2031 as governments fund strategic transport, social, and renewable-energy projects. Victoria’s USD 208 billion capital program and the USD 1.5 billion Housing Support Program illustrate a shift to mission-oriented spending that crowds in private partners via PPP frameworks.
Budget allocations prioritize productivity and emissions outcomes, positioning public funding as a counter-cyclical anchor for the Australia construction market. Contractors with demonstrated ESG-compliant delivery and digital transparency strike the best bid-win ratios on these packages. Elevated interest rates and cost inflation constrain private speculative builds, yet institutional investors continue to back logistics and data-center assets, hedging inflation through indexed leases.
Geography Analysis
New South Wales maintains its leadership position with 32.10% of the Australia construction market share, supported by major transport and urban renewal projects that stimulate housing and commercial spinoffs. The completion of the USD 786 million Bridgewater Bridge enhances freight efficiency, while the state’s Sustainable Buildings SEPP creates a pipeline for low-carbon retrofits. Insolvencies among Canberra builders underscore financial strains, yet large civil contracts continue to draw tier-1 participation.
Victoria’s market reflects an ambitious USD 208 billion capital program, spanning hospital expansions, schools, and the Suburban Rail Loop. Infrastructure investment peaked at USD 24 billion in FY 2024 before normalizing, but workforce constraints persist, prompting project-sequencing adjustments. A gradual policy shift toward prefabrication and modular classrooms is emerging to meet delivery deadlines and NCC 2025 energy targets.
Western Australia is forecast for the fastest 4.48% CAGR, driven by resource megaprojects, population inflows, and clean-energy infrastructure. Projects such as Northern Star’s USD 1.3 billion gold mine and the Clean Energy Link North upgrade keep engineering demand high. Renewable schemes align with the state’s coal-exit timeline by 2030, ensuring sustained grid and storage procurement. Together, these dynamics sustain balanced growth across regions, reinforcing nationwide activity in the Australia construction market.
Regulatory Landscape
Australia's construction regulatory system is anchored by the National Construction Code (NCC), maintained by the Australian Building Codes Board (ABCB), with national policy coordination through the Building Ministers Meeting (BMM) and jurisdictional adoption and enforcement handled by state and territory governments through licensing, certification, and compliance regimes. For NCC 2025, a preview release was made in February 2026, with potential jurisdictional adoption from 1 May 2026, which creates a defined compliance change window for designers, builders, and certifiers across residential and non-residential work.
Code stability also feeds into delivery planning and product selection. Ministers agreed to pause new residential NCC changes until mid-2029 (except essential safety or quality issues), which reduces near-term redesign churn for volume housing and supports standardization across projects. At the same time, sustainability and performance requirements already embedded in NCC 2025 continue to push energy-efficiency upgrades and specification changes in commercial and retrofit programs.
Value Chain Analysis
Australia's construction value chain covers project origination and financing (public agencies, private developers, and institutional investors), design and approvals (architectural, engineering, planning, and certification services), procurement of materials and equipment, and delivery through head contractors supported by extensive subcontracting and specialist trades. The industry contributes about 7.0% to Australia's GDP and employs around 1.3 million people, highlighting the scale of labor, services, and materials orchestration across residential, commercial, and infrastructure builds.
Execution is structurally subcontractor-heavy. In 2023-24, income from subcontracting arrangements (AUD 116.6 billion) exceeded primary contracting income (AUD 71.4 billion), reinforcing the importance of tier-2 and trade capacity, payment terms, and scheduling discipline. Upstream inputs include professional services, manufactured goods (such as steel and building products), and transport and logistics, with globalized supply chains that include significant imports from Asian markets, particularly China, which makes lead times, shipping variability, and standards compliance central to procurement and risk allocation.
Competitive Landscape
Tier-1 contractors have expanded their share of public infrastructure work from 49% to 59% since 2016, with average contract values approaching USD 600 million. CIMIC Group leverages global data-center expertise to secure hyperscale builds, while Lendlease is refocusing domestically after USD 2.8 billion of offshore divestments to simplify its balance sheet. Smaller firms contend with razor-thin margins and higher insolvency risk, intensifying the bar for surety bonding and digital compliance.
Strategic differentiation is pivoting toward technology enablement and ESG credentials. CPB Contractors integrates drone surveying and AI scheduling on the Main South Road Duplication to cut rework and carbon footprint. ACCIONA and SUEZ have secured a USD 322 million water-plant build through design-build-operate models that transfer performance risk while optimizing lifecycle revenue. Foreign entrants are active: UAE-based Arada acquired Roberts Co NSW, signaling international appetite for mid-tier Australian assets.
Market whitespace centers on prefabrication, carbon-neutral materials, and AI-driven project controls. The federal USD 54 million modular-housing fund lowers entry barriers for specialist manufacturers, and early adopters already report 25% schedule savings. Contractors are able to combine off-site manufacturing with integrated digital twins to capture procurement advantages in upcoming PPP bids. Overall, competitive intensity is shifting from raw capacity toward innovation and sustainability leadership inside the Australia construction market.
Australia Construction Industry Leaders
-
CPB Contractors
-
Lendlease Corporation Ltd
-
John Holland Group
-
Laing O’Rourke
-
Multiplex (Brookfield)
- *Disclaimer: Major Players sorted in no particular order
Market Opportunities and Future Outlook
A clear opportunity comes from the scale and composition of the public pipeline tracked by Infrastructure Australia. The program cited for 2024-2029 totals AUD 242 billion, including AUD 77 billion across buildings and AUD 36 billion across utilities, driven largely by electricity transmission line projects. This underwrites multi-year workloads for contractors, engineering firms, and specialist suppliers in power and grid-enabling civil works, and it also extends to social and affordable housing and health projects within the buildings pipeline (AUD 28 billion and AUD 22 billion, respectively).
Constraints in delivery capacity create room for productivity-led offerings and alternative delivery models rather than pure expansion. Infrastructure Australia points to workforce shortages peaking at 148,000 in metropolitan locations in 2026 and 181,000 in regional locations in 2027, which increases demand for modular or off-site methods, digital engineering and BIM-enabled coordination, and alliance-style contracting to de-risk complex packages. As public infrastructure pipelines decline in New South Wales and Victoria with major transport projects winding down, contractors are also looking to utilities, data center buildouts through 2026 and 2027, and Queensland non-residential hotspots linked to Brisbane 2032 project activity.
Recent Industry Developments
- July 2026: CPB Contractors (HOCHTIEF Group) selected to deliver Stage 1 of the Toowoomba to Warwick Pipeline for Seqwater, valued at approximately AUD 75 million. The project expands water infrastructure capacity in Queensland, reinforcing the contractor's position in civil tenders. The collaboration strengthens utility-scale pipeline delivery capabilities for future public works.
- June 2026: Georgiou Group appointed to construct both Greenfield and Brownfield packages for Stage 1 of The Wave rail project in Queensland. The scope broadens rail program execution and supports alliance-based delivery for major transit upgrades. This appointment lifts Queensland transit project momentum and expands rail exposure for the company.
- June 2026: NRW Civil and Mining awarded the Tonkin Highway Grade Separations project by Main Roads Western Australia, valued at approximately AUD 200 million. The award supports road-rail corridor upgrades and sustains a strong WA civil contracting pipeline. It signals continued demand for large-scale highway infrastructure in Western Australia.
Research Methodology Framework and Report Scope
Market Definition and Coverage
For this study, we define the Australia construction market as the value of construction activity delivered within Australia across building and civil works, counted at the project execution level across public and private demand.
Scope exclusions: Exclusions include real estate transactions and property management revenues, which sit outside the construction market definition used here.
Segmentation Overview
- By Sector
- Residential
- Apartments/Condominiums
- Villas/Landed Houses
- Commercial
- Office
- Retail
- Industrial and Logistics
- Others
- Infrastructure
- Transportation Infrastructure (Roadways, Railways, Airways, others)
- Energy & Utilities
- Others
- Residential
- By Construction Type
- New Construction
- Renovation
- By Construction Method
- Conventional On-Site
- Modern Methods of Construction (Prefabricated, Modular, etc)
- By Investment Source
- Public
- Private
- By Geography
- New South Wales
- Victoria
- Queensland
- Western Australia
- Rest of Australia
Data Sources, Market Sizing, and Validation
Desk Research
Desk research was used to set the market frame and to anchor key demand signals before the model was built. We relied on public statistics and releases that describe construction activity, pipeline, and approvals, such as Australian Bureau of Statistics building approvals and activity series, national accounts indicators, and state budget papers for capital works programs.
To strengthen the view on inputs and timing, we also reviewed sources such as Infrastructure Australia project publications, Reserve Bank of Australia commentary on construction costs and financing conditions, and public planning dashboards from state agencies where available. Company annual reports, investor presentations, and reputable press were used to cross-check project starts, delays, and margin pressure. Where needed, we used paid subscription databases for company financials and for import-export shipment level checks to validate a few input assumptions. The sources listed above are illustrative only, and many other references were used for data collection, validation, and clarification during the work.
Primary Interviews and Surveys
Primary work was completed through expert interviews and structured surveys with contractors, developers, engineering and project service providers, and buyers involved in public and private projects. These discussions were used to confirm what was actually being awarded and built across major states, and to tighten assumptions on mix shifts between residential, infrastructure, and energy related work when desk data lagged.
The inputs were then reconciled across respondent groups so the final view reflects on-the-ground pricing, execution timelines, and likely slippages, instead of only published plans.
Distribution of primary research fieldwork respondents
| Company type | Respondent position |
|---|---|
| Top tier: 29% | CXOs: 19% |
| Mid tier: 52% | Functional/Unit leaders: 36% |
| Smaller Players: 19% | Managers: 45% |
Market-Sizing & Forecasting
Our sizing starts with a top-down build that reconstructs the addressable construction value by using official activity and approvals series, and then mapping these to sector and state level shares so the totals stay aligned with what is being delivered in Australia. Once that is set, the output is corroborated with selective bottom-up checks, such as sampled project values by category and a limited roll up of contractor revenue exposure to Australia construction work, which helps adjust for timing shifts and reporting gaps.
Key model inputs include building approvals and commencements, public infrastructure funding signals, construction cost inflation, labor availability and productivity indicators, and the visible project pipeline for transportation and utilities. Since the forecast can be impacted by interest rates and procurement pace, we also layer in macro indicators that influence residential starts and public capex drawdowns, and then we test the sensitivity around cost escalation and delay risk.
Forecasting is handled using scenario analysis, where a base case is set from the consensus view gathered in interviews and then stress cases are applied around rate cuts timing, cost normalization, and project deferrals. Where bottom-up checks are incomplete, gaps are handled through share-based expansion from known project pools and by using conservative realization factors so the final market value is not overstated.
Data Validation & Update Cycle
Validation is done through multiple passes, where we compare the model outputs with independent signals like construction activity trends, state budget allocations, and major project award announcements, and then investigate large variances before sign-off. If an assumption drives an unusual jump (for example, a sharp change in infrastructure mix or a sudden cost step-up), we re-check the input source and re-contact selected interviewees to confirm whether it is real or a timing effect.
Each report is refreshed annually, and interim updates are triggered when there are material events such as major policy shifts, large project cancellations, or sustained cost changes. Before delivery, one more analyst review is completed to ensure the latest public releases and market signals are reflected in the final dataset and narrative.
Mordor Intelligence's Australia Construction Market Size Compared With Other Published Estimates
Published market sizes for Australia construction do not always match because each publisher counts a different value pool and uses different timing for what is considered delivered versus planned. Differences also show up when some estimates rely more on announced pipelines, while others are anchored to actual activity and realized pricing.
Real estate transactions and property management revenues sit outside Mordor Intelligence scope here, and that single exclusion can materially change totals when other sources blend construction output with broader property sector income. The spread also comes from how renovation activity is treated, how cost inflation is carried forward into forecast years, and whether currency conversion is done using a point-in-time rate or a period average.
Benchmark comparison
| Source | Market Size | Gaps in Research Methodology |
|---|---|---|
| Mordor Intelligence | USD 166.36 B (2025) | |
| Industry Data Publisher A | USD 408.00 B (2025) | Often uses an industry income style construct that can include wider construction business receipts and adjacent property related revenue pools, which inflates the value compared with an activity delivered view. |
| Industry Association B | USD 175.00 B (2024) | Typically reported in constant dollars and focused on total activity outlook, so the number can differ due to inflation treatment, base year choice, and whether values represent financial year activity rather than a calendar year. |
Taken together, the table suggests that scope and value basis drive most of the variance, not just growth assumptions. By keeping the market tied to construction activity value and then checking the totals against approvals, budgets, and project signals, we arrive at a market size that is easier to trace back to repeatable inputs.
Key Questions Answered in the Report
How big is the Australia construction market in 2026?
The Australia construction market size stands at USD 173.18 billion in 2026 and is forecast to reach USD 211.71 billion by 2031.
What CAGR is expected for Australian construction to 2031?
The sector is projected to expand at a 4.1% CAGR during the 2026-2031 period.
Which segment grows fastest within Australian construction?
Infrastructure is the fastest-growing segment with a 6.18% CAGR, driven by transport and clean-energy spending.
Which state is set for the highest growth?
Western Australia shows the quickest trajectory with a 4.48% CAGR through 2031, supported by resource and renewable projects.
What is the main challenge facing builders?
Material-price volatility and acute labor shortages are pressuring margins and timelines for contractors nationwide.
How are modern construction methods evolving?
Prefabricated and modular techniques are rising at a 7.12% CAGR thanks to federal funding and faster delivery times, though they still form a small share of total activity.