
Market Overview
| Study Period | 2020 - 2031 |
|---|---|
| Forecast Data Period | 2026 - 2031 |
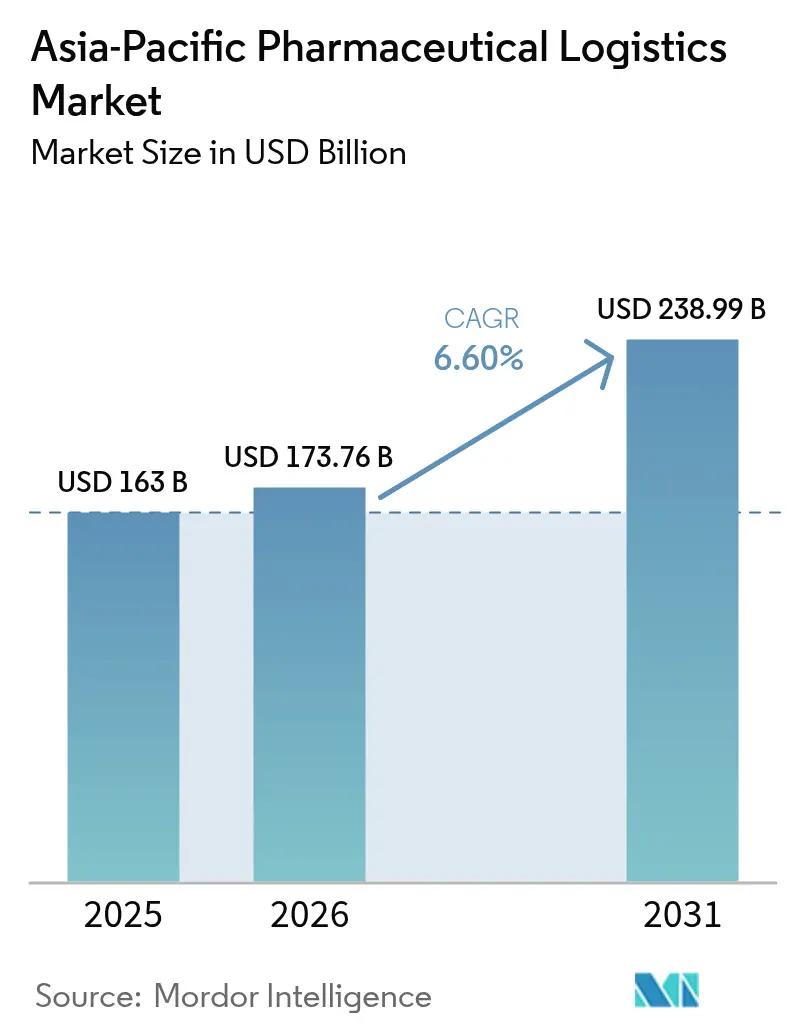
| Base Year Market Size (2025) | USD 163 Billion |
| Market Size (2026) | USD 173.76 Billion |
| Market Size (2031) | USD 238.99 Billion |
| Growth Rate (2026 - 2031) | 6.60 % |
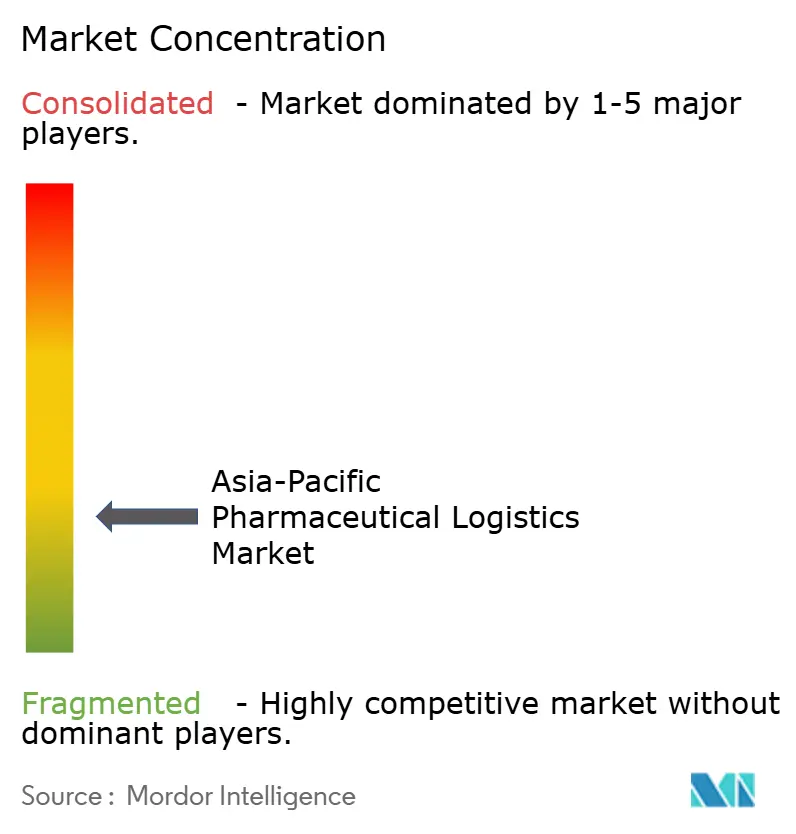
| Market Concentration | Low |
Major Players_-_Copy.webp) *Disclaimer: Major Players sorted in no particular order Image © Mordor Intelligence. Reuse requires attribution under CC BY 4.0. | |
Asia-Pacific Pharmaceutical Logistics Market Analysis by Mordor Intelligence
The Asia-Pacific Pharmaceutical Logistics Market size was valued at USD 163 billion in 2025 and estimated to grow from USD 173.76 billion in 2026 to reach USD 238.99 billion by 2031, at a CAGR of 6.60% during the forecast period (2026-2031).
The impressive growth rate mirrors the region’s rapid transition into a globally integrated manufacturing and distribution hub. Demand for complex biologics, sustained policy support in China and India, and large‐scale investments by logistics majors underpin this trajectory.[1]National Medical Products Administration, “China to deepen medical, healthcare reform in 2024,” english.nmpa.gov.cn Rising vaccine manufacturing capacity, expanding e-commerce channels for medicines, and accelerated cold-chain upgrades across ASEAN nations further sustain momentum. Meanwhile, sustainability targets and the need for end-to-end temperature assurance spur innovation in packaging, modal diversification, and digital visibility solutions. Together, these factors position the Asia Pacific pharmaceutical logistics market as both a growth engine and a test bed for advanced supply-chain technologies.
Key Report Takeaways
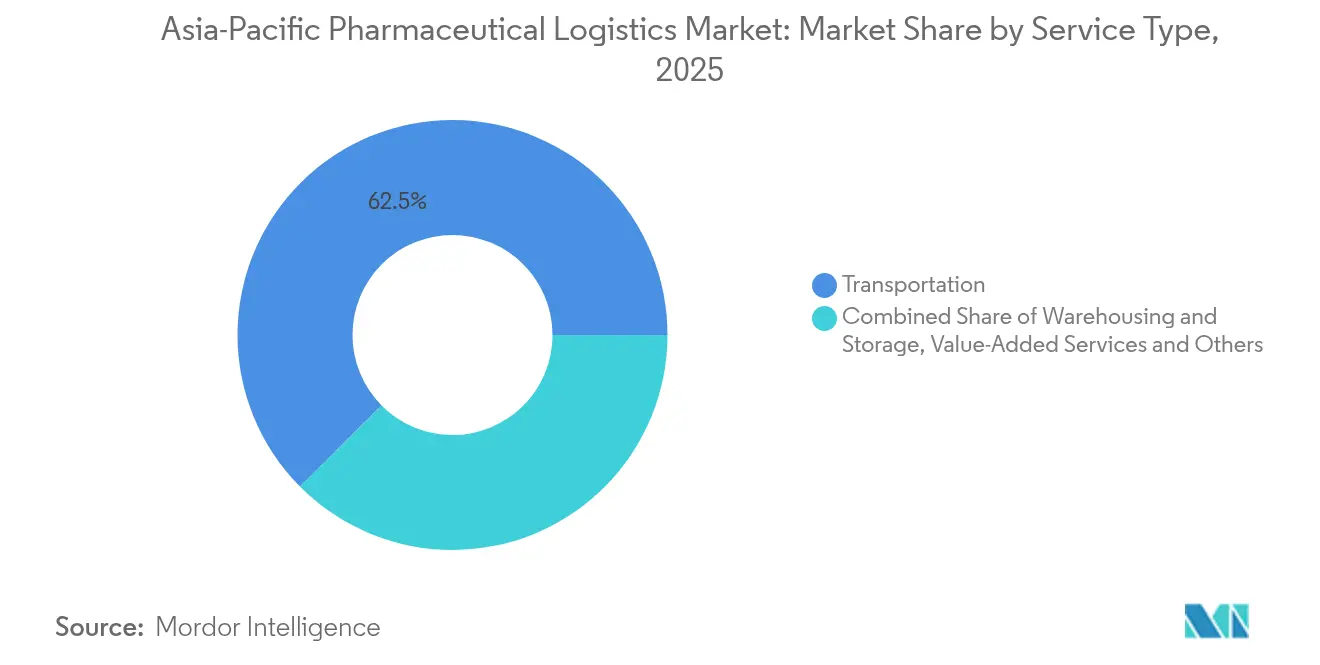
- By service type, transportation services led with 62.45% of the Asia-Pacific pharmaceutical logistics market share in 2025; value-added services and others are projected to post a 4.55% CAGR through 2031, reflecting growing demand for integrated supply-chain offerings
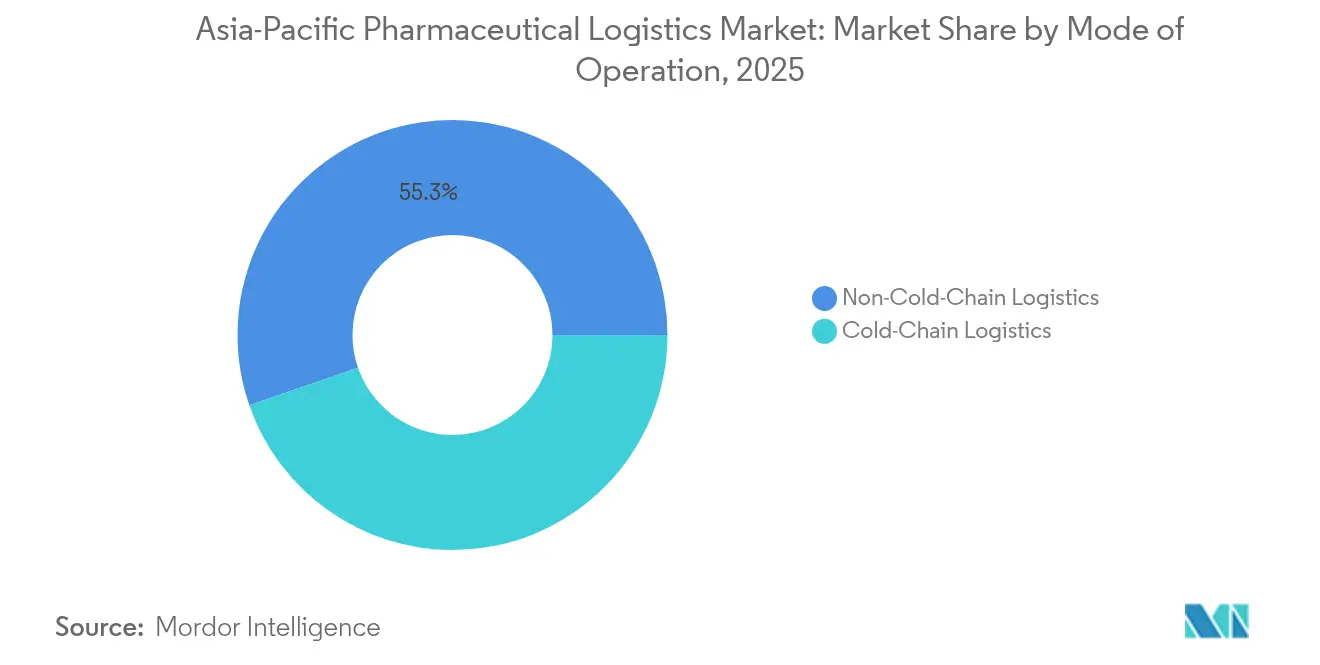
- By mode of operation, non-cold-chain activities accounted for 55.30% of the Asia-Pacific pharmaceutical logistics market size in 2025, whereas cold-chain logistics are forecast to advance at a 4.95% CAGR through 2031 on the back of biologics and vaccine requirements
- By product type, prescription drugs represented 35.40% of the Asia-Pacific pharmaceutical logistics market share in 2025; cell and gene therapies are expected to expand at a 5.45% CAGR through 2031 as decentralized manufacturing models scale.
- By geography, China held 27.60% of the Asia Pacific pharmaceutical logistics market in 2025, while India is projected to register the fastest growth at a 5.55% CAGR through 2031, owing to policy incentives and export ambitions.
Note: Market size and forecast figures in this report are generated using Mordor Intelligence’s proprietary estimation framework, updated with the latest available data and insights as of 2026.
Asia-Pacific Pharmaceutical Logistics Market Trends and Insights
Drivers Impact Analysis*
| Driver | % Impact on CAGR Forecast | Geographic Relevance | Impact Timeline |
|---|---|---|---|
| Rising biologics & vaccine volumes | +1.2% | Global, with concentration in Singapore, South Korea, and China | Medium term (2-4 years) |
| Expansion of regional pharma manufacturing hubs | +1.0% | China, India, with spillover to Southeast Asia | Long term (≥ 4 years) |
| Growth of e-commerce pharma distribution | +0.8% | APAC core markets, expanding to emerging economies | Short term (≤ 2 years) |
| National Essential-Drugs hub reforms (China, India) | +0.7% | China, India, with regional supply chain effects | Medium term (2-4 years) |
| ASEAN GDP enforcement accelerating cold-chain upgrades | +0.6% | ASEAN member states, particularly Indonesia, Thailand, and Vietnam | Medium term (2-4 years) |
| AI-enabled route-optimization lowering spoilage rates | +0.5% | Global implementation with early adoption in developed APAC markets | Short term (≤ 2 years) |
| Source: Mordor Intelligence | |||
Rising biologics and vaccine volumes
Demand for biologics reshapes infrastructure requirements across the Asia Pacific pharmaceutical logistics market as manufacturers commission modular plants capable of switching among multiple vaccine programs. Sanofi’s USD 595 million Modulus facility in Singapore illustrates the region’s capacity build-up and the consequent need for end-to-end cryogenic logistics capable of maintaining critical quality attributes.[2]Sanofi, “Sanofi opens USD 595M vaccine manufacturing facility in Singapore,” pharmamanufacturing.comSamsung Biologics added 180,000 L of capacity at its fifth plant in 2025, while BioNTech chose Singapore for a regional mRNA hub, both exerting upward pressure on specialized storage and real-time monitoring networks. Such investments raise the baseline for temperature assurance, documentation, and security in the Asia Pacific pharmaceutical logistics market.
Expansion of regional pharma manufacturing hubs
Continued consolidation in China and India spreads manufacturing volumes across purpose-built industrial zones, prompting a redesign of distribution corridors. China’s centralized procurement now covers 500 medicines, pushing logistics providers to handle larger shipment lots at lower per-unit prices while ensuring service levels. India, targeting USD 350 billion in pharmaceutical exports by 2047, increases finished-dose and API throughput that must move efficiently to ports and airports. New biologics plants in South Korea and specialized peptide facilities underline the breadth of manufacturing activity. These developments heighten demand for harmonized quality processes, customs facilitation, and multimodal connectivity in the Asia Pacific pharmaceutical logistics market.
Growth of e-commerce pharma distribution
Digital pharmacy growth accelerates last-mile complexity, as online platforms promise rapid fulfillment and traceable delivery of prescription and OTC medicines. Regional digital pharmacy sales are projected to top USD 35.33 billion by 2026, requiring reliable pick-pack mechanisms and compliant temperature regimes for sensitive drugs. Governments encourage generic substitutions, expanding SKU diversity handled by logistics providers. Telehealth’s adoption jumped from 11% in 2019 to 46% during the pandemic, creating demand for home-delivery models with stringent proof-of-delivery and data security. Logistics operators respond with micro-fulfillment centers and API-integrated routing systems, embedding the Asia Pacific pharmaceutical logistics market firmly within the broader digital-health ecosystem.
National essential-drug hub reforms (China, India)
Policy frameworks in Asia’s two largest economies deepen cost containment and traceability imperatives. China’s three-medical linkage reform achieved average price cuts of 63% in 2024, translating into high-throughput distribution from centralized procurement hubs to hospital networks. [3]Pharmaphorum, “Navigating new risks: China’s Anti-Espionage Law,” pharmaphorum.comIndia’s new Good Distribution Practices mandate QR codes on packs and a real-time interface with regulators, compelling upgrades to serialization, scanning, and reverse-logistics processes. For logistics providers, compliance now extends beyond temperature and security to include digital proof of chain-of-custody and rapid recall capabilities across the Asia Pacific pharmaceutical logistics market.
Restraints Impact Analysis*
| Restraint | % Impact on CAGR Forecast | Geographic Relevance | Impact Timeline |
|---|---|---|---|
| High cold-chain infrastructure cost | -0.9% | Global, with an acute impact on developing APAC markets | Long term (≥ 4 years) |
| Complex multi-country regulatory compliance | -0.7% | ASEAN region, China-India trade corridors | Medium term (2-4 years) |
| Scarcity of biologics-trained staff in Tier-2 cities | -0.5% | China, India, Southeast Asia secondary markets | Medium term (2-4 years) |
| Carbon-emissions scrutiny on air freight corridors | -0.4% | Global, with a focus on Asia-Pacific air routes | Short term (≤ 2 years) |
| Source: Mordor Intelligence | |||
High cold-chain infrastructure cost
Specialized storage rooms, validated reefers, and multi-temperature warehouses require significant capital, challenging smaller operators. Although AI-based forecasting lowers capacity wastage, the absolute upfront spend remains high, slowing network roll-out in emerging markets. Rural pilots that tested freeze-preventive boxes underscored performance benefits yet revealed payload weight penalties that limited wide uptake. Higher adoption of reusable thermal packaging addresses waste but necessitates investment in cleaning and reverse logistics circuits.
Complex multi-country regulatory compliance
Fragmented legislation across Asia erodes scale benefits. Indonesia’s GDP certificates, China’s evolving data security statutes, and Vietnam’s amended pharmaceutical laws each introduce new documentation and inspection layers. Operators must maintain country-specific SOPs while keeping harmonized quality management systems, which increases overhead. This complexity slows cross-border lead times and demands continuous training across the Asia Pacific pharmaceutical logistics market.
*Our forecasts treat driver/restraint impacts as directional, not additive. The impact forecasts reflect baseline growth, mix effects, and variable interactions.
Segment Analysis
By Service Type: Transportation Dominates Amid Value-Added Growth
Transportation services represented 62.45% of the Asia Pacific pharmaceutical logistics market revenue in 2025, underscoring the region’s heavy reliance on multimodal distribution networks that link dense manufacturing clusters with hospitals, pharmacies, and export gateways. Road freight captured the bulk of domestic flows thanks to flexible scheduling and last-mile reach, while air networks handled time-critical biologics under active temperature control. Sea freight volumes grew as manufacturers shifted slower-moving products to lower-carbon lanes, and rail connections provided an alternate corridor along the China–Europe axis. Digital control towers integrating GPS, IoT, and blockchain tools now orchestrate modal transfers, enhancing visibility and regulatory compliance across the Asia Pacific pharmaceutical logistics market.
Value-added services expanded to a 4.55% CAGR and included inventory optimization, regulatory documentation, and quality assurance. Pharmaceutical shippers require GDP-certified warehousing that offers controlled ambient, refrigerated, and frozen zones within single facilities, as well as secondary packaging and labeling services. Real-time temperature dashboards, automated picking systems, and predictive replenishment algorithms elevate service expectations. As a result, logistics providers increasingly pursue end-to-end contracts that bundle transport, storage, and compliance, moving the Asia Pacific pharmaceutical logistics market toward integrated supply-chain orchestration.



By Mode of Operation: Cold-Chain Acceleration Despite Non-Cold Dominance
non-cold-chain activities, representing 55.30% of 2025 revenue, continue to underpin essential medicine distribution. Bulk generics, solid orals, and many medical devices travel under controlled ambient conditions, leveraging well-established cross-dock networks. High SKU velocity in e-commerce channels further reinforces investment in regional sorting centers and automated parcel hubs. These dynamics keep non-cold infrastructure upgrades firmly on the capex agenda in the Asia Pacific pharmaceutical logistics market.
Cold-chain revenue grows more rapidly at a 4.95% CAGR as biologics, vaccines, and gene therapies proliferate. Facilities such as Sanofi’s Singapore site adopt modular layouts with rapid temperature-recovery features to mitigate excursion risks. Cytiva’s new South Korean plant adds upstream filtration capacity, prompting carriers to introduce dedicated cryogenic lanes. Standard-setting under ASEAN GDP narrows performance variability, compelling even smaller distributors to deploy continuous data loggers. Consequently, the cold-chain segment garners disproportionate technology investment within the Asia Pacific pharmaceutical logistics market.
By Product Type: Prescription Drugs Lead While Cell Therapies Surge
Prescription medicines held 35.40% of the Asia Pacific pharmaceutical logistics market share in 2025, buoyed by aging demographics and chronic disease burdens. Volumes move through a mix of hospital tenders and pharmacy retail, with distributors maintaining high service levels to prevent stockouts. Branded generics from India and China continue to penetrate Southeast Asian markets, ensuring robust demand for compliant transportation and storage.
Cell and gene therapies, though nascent in volume, exhibit the fastest revenue expansion at 5.45% CAGR. Personalized products, stringent time-temperature thresholds, and reverse logistics for reusable cryo-shippers differentiate this sub-segment. China, Japan, and Australia host the bulk of APAC clinical trials, compressing development timelines and necessitating agile supply chains Investments in controlled-rate freezers, vapor-phase liquid nitrogen storage, and blockchain authentication define the logistical response within the Asia Pacific pharmaceutical logistics market.
Geography Analysis
China commanded 27.60% of regional revenue in 2025 as centralized volume purchases amplified shipment consolidation from manufacturers to public hospitals. The nation’s share of the global drug development pipeline grew to 28% in 2023, intensifying requirements for validated storage and multimodal connectivity. Ongoing reforms continue to streamline reimbursement yet complicate data management obligations under new security statutes. Logistics firms respond by enhancing bonded warehouse capacity near free-trade zones and deploying AI-driven customs documentation tools.
India, with a USD 50 billion domestic pharmaceutical base, posts the fastest 5.55% CAGR through 2031. Production-linked incentive schemes and a focus on biopharmaceutical exports stimulate cold-chain developments around Hyderabad and Pune. UPS’s launch of a temperature-controlled cross-dock in Hyderabad demonstrates rising third-party investment aligned with Good Distribution Practice standards. On the policy front, mandatory QR codes and track-and-trace architecture improve visibility but require significant IT alignment across the Asia Pacific pharmaceutical logistics market.
A collective group of Japan, South Korea, Singapore, Australia, and key ASEAN members adds growth and diversification potential. Japan’s plan to approve 43 innovative drugs in 2025, including gene therapies, elevates demand for ultra-cold lanes and domestically based cryogenic storage. South Korea’s bio-cluster expansion, underscored by Samsung Biologics and Cytiva projects, places Incheon and Sejong on the global biologics map. Singapore leverages free-trade stature and stringent regulatory oversight to host regional distribution centers, while Australia emerges as an mRNA supply-chain nucleus anchored by Aurora Biosynthetics. Indonesia and Vietnam pursue self-sufficiency policies, driving greenfield warehouse builds and multi-temperature fleet acquisitions. Collectively, these developments fortify the Asia Pacific pharmaceutical logistics market against supply risks while distributing opportunity across multiple jurisdictions.
Regulatory Landscape
Regulation in the Asia-Pacific pharmaceutical logistics market is tightening around cold-chain validation, traceability, and third-party logistics accountability, though requirements remain uneven across countries. In China, the Regulations on the Implementation of the Drug Administration Law took effect on May 15, 2026, strengthening oversight across storage and transportation and raising expectations for compliant operations by logistics providers supporting marketing authorization holders and distributors.
Cold-chain performance and traceability are also being codified through standards and GDP frameworks. China introduced GB/T 34399-2025 (performance qualification for pharmaceutical cold chain facilities) and GB/T 46204-2025 (traceability management in cold chain logistics) in 2025, which pushes operators toward more auditable temperature and chain-of-custody controls. Across Southeast Asia, GDP guidance (for example, Malaysia NPRA GDP guideline) and ASEAN-level alignment tools such as the ASEAN Common Technical Requirements (ASEAN CTR) shape documentation and quality practices for cross-border flows, even as country-level interpretations add compliance overhead.
Value Chain Analysis
The value chain runs from drug developers and manufacturers (including biologics and vaccine capacity additions), to packaging and specialty shippers, primary transport (air, road, sea, rail), temperature-controlled warehousing, and downstream distributors serving hospitals, pharmacies, and increasingly direct-to-patient channels. Transportation remains the largest market service component (62.45% share in 2025), with air handling time-critical and ultra-cold moves and road dominating domestic distribution, while sea and rail support less time-sensitive export lanes and lower-carbon options.
Specialized cold-chain infrastructure and compliance systems increasingly define value creation, linking manufacturing clusters to export gateways and urban consumption nodes. Capability build-out that reshapes the chain includes DHL Supply Chain opening a 10,000 sq m health care logistics hub in Icheon, South Korea (June 2026), and the launch of dedicated temperature-controlled rail services linking Hyderabad to the Nhava Sheva/JNPT export gateway in India (May to June 2026, with CONCOR and partners). Clinical trial and advanced-therapy logistics add further layers through depot networks (for example, Zuellig Pharma expanding clinical logistics in Japan with a Misato depot in March 2026), reusable thermal packaging loops, and tighter hazardous-goods handling for dry ice and liquid nitrogen, which can become bottlenecks at airports and border points.
Competitive Landscape
The Asia Pacific pharmaceutical logistics market is moderately fragmented. DHL continues to deepen exposure via the 2025 acquisition of CRYOPDP, adding specialized clinical trial capacity across 15 countries. UPS follows a similar path, integrating Andlauer Healthcare and expanding cross-dock infrastructure in India. Kuehne+Nagel invests in real-time monitoring and reusable packaging pools to court advanced-therapy manufacturers.
Regional champions such as SF Express, Kerry Logistics, and Zuellig Pharma leverage domestic reach, dedicated regulatory teams, and longstanding healthcare contracts to defend market share. SF Express reported RMB 134.4 billion (USD 18.5 billion) in first-half 2024 revenue, though it faces intensifying domestic rivalry. Zuellig builds exclusive vaccine hubs that allow same-day fulfillment across multiple ASEAN capitals.
Technology adoption acts as a performance wedge. Nippon Express’s warehouse automation and 5G IoT roll-out relieve labor shortages while improving spoilage control. Blockchain pilots secure chain-of-identity data for cell therapies, and AI route optimizers rebalance modal choices in favor of lower-carbon options. Competitive gaps therefore depend less on fleet size and more on digital readiness, regulatory depth, and sustainability credentials in the Asia Pacific pharmaceutical logistics market.
Asia-Pacific Pharmaceutical Logistics Industry Leaders
Kuehne + Nagel
DSV Panalpina
Bio Pharma Logistics
DB Schenker
DHL
- *Disclaimer: Major Players sorted in no particular order

Market Opportunities and Future Outlook
Near-term opportunity focuses on GDP/GxP-compliant cold-chain capacity across manufacturing corridors and at international gateways, supported by a visible stream of new hubs, automation upgrades, and multimodal corridors. Recent actions include DHL Supply Chain completing a 10,000 sq m DHL Health Logistics Hub in Icheon, South Korea (June 2026) with ultra-low-temperature capability, and Kuehne+Nagel opening a temperature-controlled airfreight cross-dock in Hyderabad, India (May 2026) aligned to HealthChain and GxP requirements. Developer-led assets also expand pharma-grade storage reach, including Ally Logistic Property launching an automated smart cold-chain facility in Shah Alam, Malaysia (May 2026).
A second opportunity area is cross-border standardization and traceability readiness as national and provincial standards expand and buyers seek tighter auditability for biologics and vaccines. China’s GB/T 46204-2025 traceability standard and associated cold-chain qualification standards drive demand for sensorization, exception management, and documentation services that logistics providers can bundle with transport and warehousing. Industrial clustering initiatives that pair manufacturing and logistics, such as the memorandum to develop a Pharma Eco Zone in Tarlac, Philippines (June 2026, involving House of Investments and Philippine Pharma Procurement Inc.), point to whitespace for integrated site logistics, compliant storage, and distribution design within new pharma zones and supplier parks.
Recent Industry Developments
- June 2026: DHL Supply Chain launched a 10,000 sq m DHL Health Logistics Hub in Icheon, South Korea, within a larger warehouse complex, adding pharma-focused storage and handling capacity. The site expands GDP-aligned infrastructure close to a major manufacturing and air-cargo ecosystem, supporting higher-value biologics and medical devices flows. It also increases competitive pressure on regional providers to match certified quality systems and specialized temperature ranges.
- May 2026: Kuehne+Nagel opened a 248 sq m temperature-controlled airfreight cross-dock facility in Hyderabad, India, designed for +2C to +8C and +15C to +25C handling under HealthChain and GxP requirements. The addition strengthens the export and intercity transfer layer for pharmaceuticals moving through Hyderabad's manufacturing corridor. It helps shippers reduce dwell time during airside consolidation and deconsolidation while tightening temperature assurance.
- December 2024: Toll Group committed over A$100 million to expand healthcare logistics across Asia-Pacific, including new facilities in Melbourne and Richlands in Australia and expansion at Toll City in Tuas, Singapore. The investment enlarges regional capacity and service coverage for controlled and healthcare-grade logistics operations. It also signals continued capital deployment by large integrators to secure long-term healthcare contracts and improve resilience in multi-country distribution networks.


Research Methodology Framework and Report Scope
Market Definition and Coverage
For this methodology, the market covers outsourced logistics services used to move and store pharmaceutical products across Asia Pacific, including transportation, warehousing, and handling activities needed to meet quality and temperature requirements.
Scope exclusions: This sizing does not count in-house distribution run by drug manufacturers or hospitals when it is not billed as a third-party logistics service.
Segmentation Overview
- By Service Type
- Transportation
- Road Freight
- Air Freight
- Sea Freight
- Rail Freight
- Warehousing & Storage
- Value-added Services and Others
- Transportation
- By Mode of Operation
- Cold-Chain Logistics
- Non-Cold-Chain Logistics
- By Product Type
- Prescription Drugs
- OTC Drugs
- Biologics & Biosimilars
- Vaccines & Blood Products
- Clinical Trail Materials
- Cell & Gene Therapies
- Medical Devices & Diagnostics
- Veterinary Medicine
- Others
- By Country
- China
- India
- Japan
- South Korea
- Singapore
- Australia
- Indonesia
- Thailand
- Vietnam
- Rest of Asia Pacific
Data Sources, Market Sizing, and Validation
Desk Research
Desk research was used to set the groundwork for the demand pool and to align definitions across countries before any modeling was finalized. We reviewed public, non-paywalled sources such as UN Comtrade trade statistics, World Bank macro indicators, national customs and port authority publications, and healthcare and medicines statistics from agencies such as the WHO.
To connect pharma activity to logistics intensity, we also leaned on regulatory and operating guidance (for example, GDP and cold chain handling expectations) published by health authorities in the region, along with association websites and reputable press coverage on capacity additions and network expansions. Company annual reports, investor presentations, and audited financial statements were used to cross-check service mix and revenue exposure to pharma handling, and then a paid subscription for company financials and news was used to speed up screening and validation. These desk sources are illustrative only, and many other public documents were also referenced to validate data points and clarify assumptions.
Primary Interviews and Surveys
Primary work focused on understanding what is actually billed as pharma logistics in each major APAC lane, and what portion is temperature-controlled versus ambient moves. We spoke with logistics operators, cold chain specialists, freight and warehouse managers, and pharma supply chain teams across APAC so assumptions on pricing, service attachment, and compliance-driven handling were checked against real operating practices.
Distribution of primary research fieldwork respondents
| Company type | Respondent position |
|---|---|
| Top tier: 37% | CXOs: 14% |
| Mid tier: 44% | Functional/Unit leaders: 31% |
| Smaller Players: 19% | Managers: 55% |
Market-Sizing & Forecasting
Sizing starts from a top-down build where regional pharma production, consumption, and trade flows are reconstructed by country, and then translated into a logistics spend pool using service intensity ratios that differ for cold chain and non-cold chain moves. Once the first cut is built, it is corroborated with selective bottom-up checks, such as sampled lane pricing for air and ocean freight, warehousing rate cards, and supplier revenue roll-ups for companies with clear APAC exposure.
Key inputs used in the model include pharma export and import values by country, air cargo and ocean freight pharma handling signals, warehouse capacity additions for temperature-controlled space, the mix shift toward biologics and vaccines, and fuel and freight price movements that influence billed logistics rates. Where company reporting does not split pharma logistics cleanly, gaps are handled by using service mix proxies from comparable operators and then stress-testing those shares during follow-up calls.
Forecasting uses scenario analysis supported by simple time-series smoothing on the most stable drivers, such as healthcare spending growth, trade value trendlines, and the expected pace of cold chain penetration. The final forecast is adjusted only when multiple inputs move together in a consistent direction, and when primary feedback supports the change in assumptions.
Data Validation & Update Cycle
Validation is done through multiple checks so the totals do not drift away from real-world operating signals. Model outputs are compared against independent indicators such as pharma trade growth, air cargo volumes tied to healthcare shipments, and changes in cold storage footprints, and then unusual jumps are reviewed country by country.
Before sign-off, assumptions on pricing and service attachment are reviewed by another analyst, and outliers trigger re-contact with industry participants to confirm what changed. Reports refresh annually, and interim updates are made when material events occur, such as regulatory shifts, major capacity expansions, or sharp freight rate resets. Right before delivery, a final pass is completed so clients receive the most current view available.
Mordor Intelligence's Asia Pacific Pharmaceutical Logistics Market Size Compared With Other Published Estimates
Published market values for APAC pharmaceutical logistics often do not match because the counted service set differs, and the base year and currency timing are not always aligned. In practice, the biggest differences come from whether warehousing and value-added handling are included, and how cold chain premiums are treated in the average price build.
Air cargo pharma signals, trade growth by country, and temperature-controlled capacity additions are the checks that keep Mordor Intelligence tied to third-party billed logistics revenue (transport plus warehousing and handling), instead of mixing in broader healthcare freight or internal distribution activity.
Benchmark comparison
| Source | Market Size | Gaps in Research Methodology |
|---|---|---|
| Mordor Intelligence | USD 163 B (2025) | |
| Trade Journal A | USD 143.22 B (2023) | Different base year and likely a broader spend view that is less explicit on what is counted as billed third-party logistics versus adjacent distribution costs. |
| Industry Publisher B | USD 130 B (2024) | Narrower scope centered on transportation services, which can leave out warehousing, packaging, and value-added compliance handling that are billed as part of pharma logistics. |
The table suggests that year choice and scope coverage explain most of the spread, more than any single growth assumption. By keeping inputs anchored to trade and shipment signals, and then confirming pricing and service attachment through interviews, the final number stays traceable to clear variables and repeatable steps.


Key Questions Answered in the Report
What is the growth outlook for the Asia Pacific pharmaceutical logistics market to 2031?
The market is projected to rise from USD 163 billion in 2025 to USD 238.99 billion in 2031 at a 6.60% CAGR, fueled by biologics, supportive policies, and digital transformation.
Which service segment contributes most to revenue?
Transportation services remain dominant, holding 62.45% of regional revenue in 2025 thanks to extensive road, air, sea, and rail networks that link manufacturing clusters with end users.
Why is cold-chain logistics expanding faster than non-cold-chain?
Biologics, vaccines, and gene therapies require stringent temperature control, resulting in a 4.95% CAGR for cold-chain activities compared with slower growth in ambient segments.
How are policy reforms shaping logistics demand in China and India?
Centralized procurement in China and QR code–based traceability in India consolidate volumes, mandate GDP compliance, and accelerate investment in large, automated distribution centers.
What role does technology play in reducing spoilage and emissions?
AI-enabled route optimization, IoT sensors, and blockchain tracing cut biologics spoilage by up to 15% and support modal shifts to lower-emission transport options across the region.
Who are the leading companies driving competitive dynamics?
Global majors such as DHL, UPS, and Kuehne+Nagel combine with regional specialists like SF Express, Kerry Logistics, and Zuellig Pharma to deliver integrated, technology-rich solutions.
Page last updated on:


 Your data is secure and never sold or shared.


