Asia Pacific Offshore Seismic Services Market Size and Share
Market Overview
| Study Period | 2021 - 2031 |
|---|---|
| Forecast Data Period | 2026 - 2031 |
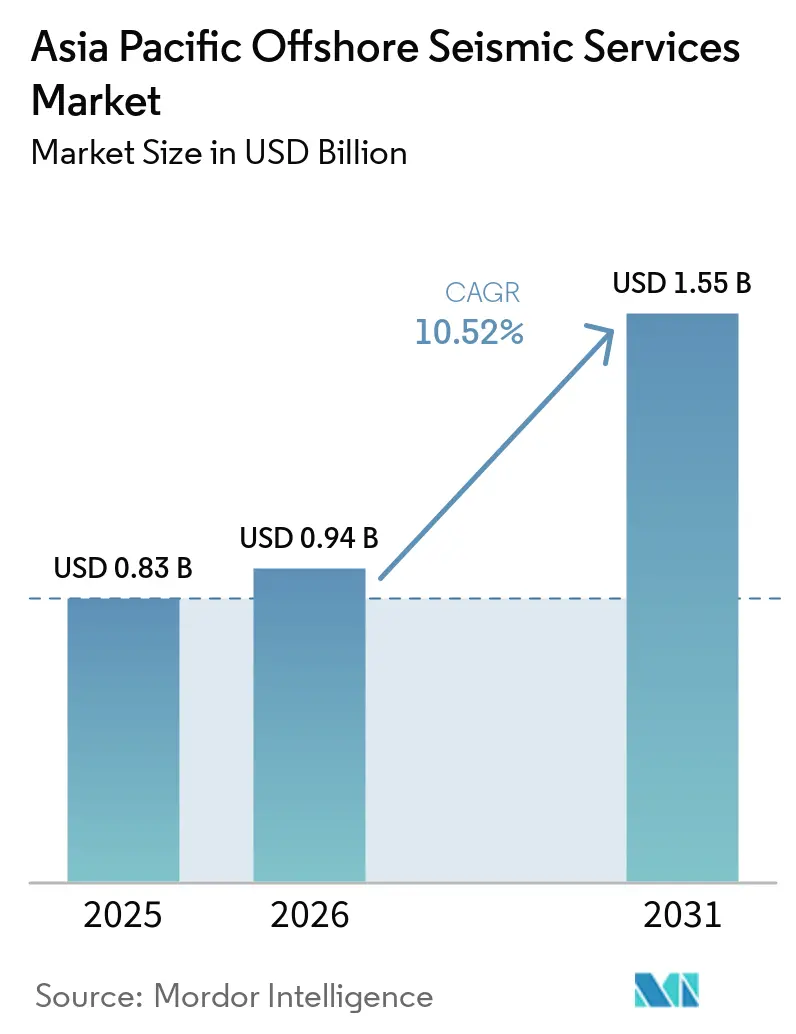
| Base Year Market Size (2025) | USD 0.83 Billion |
| Market Size (2026) | USD 0.94 Billion |
| Market Size (2031) | USD 1.55 Billion |
| Growth Rate (2026 - 2031) | 10.52% CAGR |
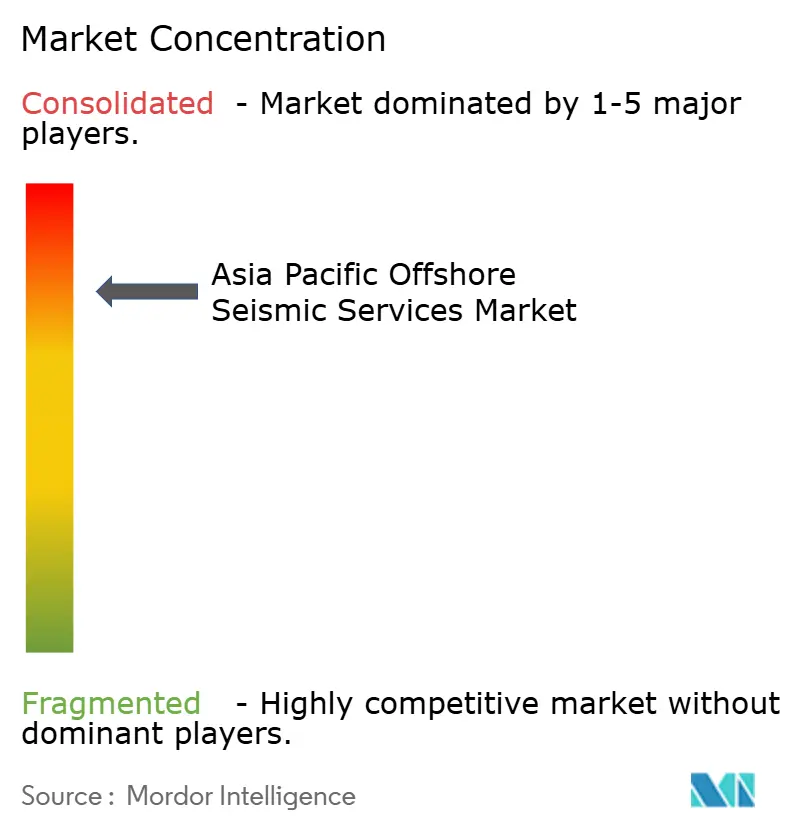
| Market Concentration | High |
Major Players*Disclaimer: Major Players sorted in no particular order Image © Mordor Intelligence. Reuse requires attribution under CC BY 4.0. | |
Asia Pacific Offshore Seismic Services Market Analysis by Mordor Intelligence
The Asia Pacific Offshore Seismic Services Market size is expected to increase from USD 0.83 billion in 2025 to USD 0.94 billion in 2026 and reach USD 1.55 billion by 2031, growing at a CAGR of 10.52% over 2026-2031. Robust vessel demand is propelled by deep-water license awards, state-sponsored exploration incentives, and the first wave of offshore carbon-capture storage (CCS) site surveys. Chinese National Oil Companies (NOCs) are lifting multi-client data sales across the Asia Pacific offshore seismic services market through large, infrastructure-led exploration programs, while India’s new bidding rounds compress the award-to-shoot cycle and stimulate vessel utilization. Regional LNG security concerns raise the urgency of ultra-deep gas discoveries, pushing operators toward full-waveform inversion (FWI) imaging and high-density nodal acquisition. Technology leadership, balance-sheet resilience, and multi-year capacity deals with majors are the decisive competitive factors in the Asia Pacific offshore seismic services market.
Key Report Takeaways
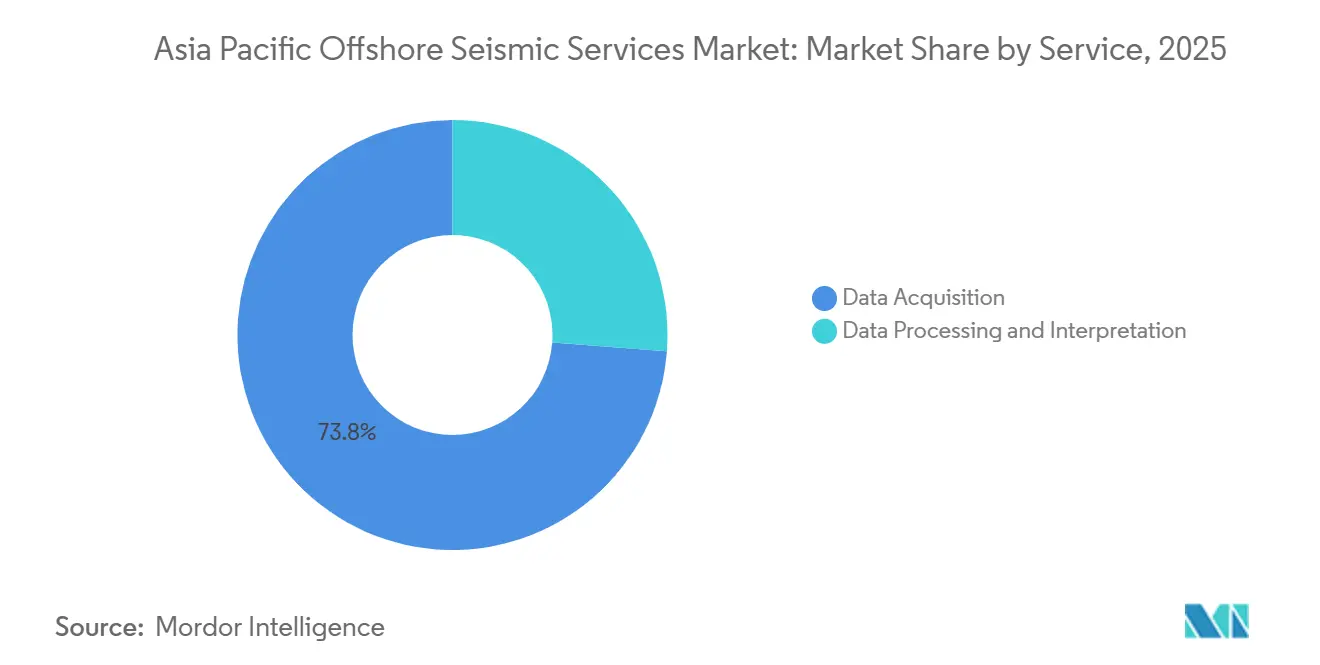
- By service, data acquisition led with 73.8% of the Asia Pacific offshore seismic services market share in 2025; data processing and interpretation is projected to expand at a 12.3% CAGR through 2031.
- By seismic technology, 3D imaging commanded 45.3% revenue in 2025, while 4D/time-lapse seismic is expected to advance at a 13.1% CAGR to 2031.
- By water depth, deep-water zones (500-1,500 m) accounted for 53.9% of the Asia Pacific offshore seismic services market size in 2025; ultra-deep-water (>1,500 m) is projected to grow at 11.9% CAGR.
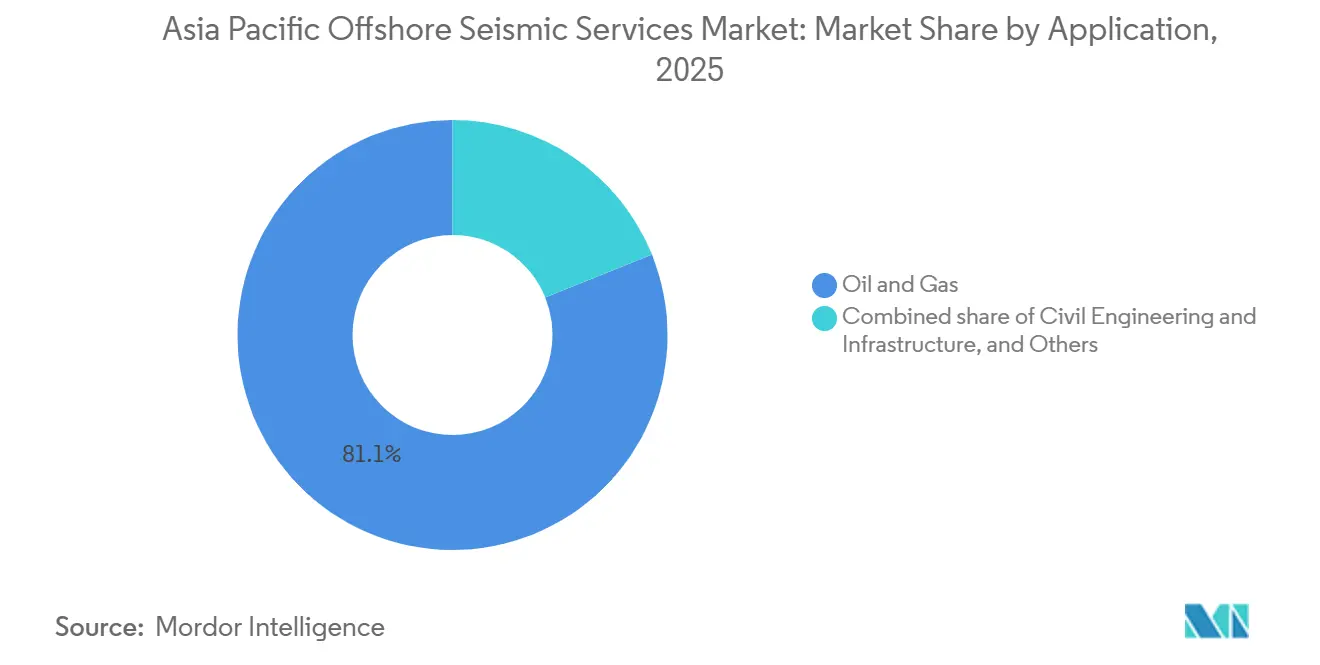
- By application, oil and gas exploration dominated with 81.1% share in 2025; CCS is expected to grow at 14.8% CAGR through 2031.
- By geography, China held 32.4% of regional revenue in 2025, and India is projected to post the highest national CAGR of 13.5% to 2031.
Note: Market size and forecast figures in this report are generated using Mordor Intelligence’s proprietary estimation framework, updated with the latest available data and insights as of January 2026.
Asia Pacific Offshore Seismic Services Market Trends and Insights
Drivers Impact Analysis*
| Driver | (~) % Impact on CAGR Forecast | Geographic Relevance | Impact Timeline |
|---|---|---|---|
| Rising deep-water E&P investments | +2.8% | China, Malaysia, Indonesia, India, spill-over Australia | Medium term (2-4 years) |
| Government-backed offshore leasing rounds | +2.5% | India, Australia, New Zealand, emerging South Korea/ASEAN | Short term (≤ 2 years) |
| Push for domestic LNG security | +2.1% | Japan, South Korea, Thailand, Indonesia | Medium term (2-4 years) |
| Emergence of carbon-capture storage surveys | +1.9% | China, Japan, Indonesia, Australia | Long term (≥ 4 years) |
| Transition to high-density nodal acquisition | +1.3% | Indonesia, Malaysia, China | Short term (≤ 2 years) |
| Source: Mordor Intelligence | |||
Rising Deep-Water E&P Investments
National and international operators are scaling exploration budgets for prospects below 500 m, creating persistent demand for broadband streamer and ocean-bottom node surveys. CNOOC’s Huizhou 19-6 discovery exceeded 100 million tonnes of oil equivalent after high-density acquisition and FWI processing.[1]CNOOC Limited, “Huizhou 19-6 Discovery Press Release,” cnoocltd.com Fugro and Mubadala Energy commenced a Southeast Asian gas imaging program in 2025 valued at USD 100 million.[2]Fugro NV, “Southeast Asia Deep-Water Contract,” fugro.com PETRONAS entrusted PXGEO with a multi-year campaign that keeps two vessels active to 2027.[3]PXGEO, “PETRONAS Contract Award,” pxgeo.com Deep-water reserves offset mature shallow assets, justifying higher day rates and undergirding long-term vessel utilization across the Asia Pacific offshore seismic services market.
Government-Backed Offshore Leasing Rounds
Fast-tracked acreage releases shorten the lag between award and first shoot. India’s OALP-X and OALP-XI offered 85 blocks in 2025, catalyzing immediate 2D reconnaissance and 3D appraisal commitments.[4]Directorate General of Hydrocarbons, “OALP Blocks,” dghcindia.gov.in Australia reopened Otway Basin acreage but simultaneously heightened wildlife compliance after NOPSEMA rejected CGG’s plan, illustrating that transparent fiscal terms coexist with stricter environmental tests. South Korea, New Zealand, and ASEAN members mirror this model, ensuring a visible multiyear backlog for the Asia Pacific offshore seismic services market.
Push for Domestic LNG Security
Supply-chain risks during the 2026 Strait of Hormuz closure pushed Brent prices up 10% and quadrupled tanker insurance premiums, prompting net-importers to accelerate offshore gas programs. Japan’s 7th Basic Energy Plan includes contingencies for 74 Mtpa LNG demand, reinforcing local seismic activity. Dense 4D monitoring cuts production uncertainty, linking LNG security directly to repeat survey revenues in the Asia Pacific offshore seismic services market.
Emergence of Carbon-Capture Storage (CCS) Site Surveys
CNOOC launched China’s first offshore CCS pilot at Enping 15-1, completing baseline seismic and ISO 27914-compliant monitoring to 2030. INPEX embedded CCS into Abadi LNG, committing to bi-annual time-lapse shoots. Repeatability standards and short survey cycles create a parallel demand engine, diversifying revenue away from hydrocarbons.
Restraints Impact Analysis*
| Restraint | (~) % Impact on CAGR Forecast | Geographic Relevance | Impact Timeline |
|---|---|---|---|
| Lengthy project permitting timelines | -1.2% | Australia, New Zealand, emerging India/Malaysia | Short term (≤ 2 years) |
| Cap-ex squeeze from low oil-price scenarios | -0.9% | Global, acute in Indonesia, Vietnam, ASEAN | Medium term (2-4 years) |
| Environmental activism delaying seismic shoots | -0.7% | Australia, New Zealand, Japan, South Korea | Short term (≤ 2 years) |
| Source: Mordor Intelligence | |||
Lengthy Project Permitting Timelines
Regulatory reviews add 12-18 months to survey starts. NOPSEMA’s 2025 rejection of CGG’s Otway plan required a full redesign, costing an extra USD 15 million in standby fees. India’s EIA pathway stretches to 18 months when coastal consultations are mandatory. Vessel idle time erodes margins, pressuring small contractors in the Asia Pacific offshore seismic services market.
Environmental Activism Delaying Seismic Shoots
Whale-migration campaigns halted WesternGeco’s Bunbury program despite technical compliance, proving that social license rivals technical licensing in Australia and New Zealand. Similar protests in Japan’s set-net fisheries compel source-power reductions that extend survey durations. Greater stakeholder outreach costs favor diversified, well-capitalized players.
*Our forecasts treat driver/restraint impacts as directional, not additive. The impact forecasts reflect baseline growth, mix effects, and variable interactions.
Segment Analysis
By Service: Processing Gains as Imaging Complexity Rises
Data processing and interpretation will grow at 12.3% CAGR, faster than acquisition’s dominant 73.8% 2025 share. Operators license reprocessed multi-client packages, such as the 45,000 km² Sarawak project by DUG and Searcher, to de-risk near-infrastructure prospects and control exploration budgets. Acquisition remains core, yet vessel oversupply squeezes day rates, while AI-driven inversion services command premium margins, anchoring an expanded profit pool for integrated contractors within the Asia Pacific offshore seismic services market.
Processing workloads integrate seismic inversion, rock-physics, and simulation. CNOOC’s Beibu Gulf program fused OBC and historic streamer data to detect residual oil, underscoring the value of multi-disciplinary interpretation. TGS secures vessel capacity under three-year Chevron deals, locking revenue visibility and bundling onboard preprocessing. The Asia Pacific offshore seismic services market thus rewards firms that offer cradle-to-grave workflows.


By Seismic Technology: 4D Monitoring Outpaces Conventional 3D
3D imaging retained 45.3% value in 2025, yet 4D/time-lapse seismic is set for 13.1% CAGR as fields mature. Time-lapse campaigns in China’s WZ oilfield cut NRMS to 12%, guiding infill drilling and boosting recoveries. TGS demonstrated 4D binning and curvelet-domain co-denoise in the Usan field, a template now marketed to Asia Pacific clients. Growing asset-life surveillance ensures that 4D services eclipse reconnaissance-focused 2D surveys within the Asia Pacific offshore seismic services market by 2031.
Node technology further enhances 4D repeatability. Shearwater’s OBN toolkit supports centimeter-scale positioning for Sabah Basin time-lapse sequences, bolstering reservoir management. As velocity-model updates prove essential for HPHT assets, technology differentiation becomes decisive in contract awards.
By Water Depth: Ultra-Deep Prospects Drive Premium Pricing
Deep-water (500-1,500 m) captured 53.9% of the Asia Pacific offshore seismic services market size in 2025. Ultra-deep-water projects will, however, expand at 11.9% CAGR, leveraging Indonesian South Andaman and Malaysian Sabah acreage. Ramform-class GeoStreamer vessels deliver broadband data in 2,000 m water, winning higher day rates and securing multi-year charters.
Shallow targets still yield headlines. Huizhou 19-6 sits in 115 m, but reserve replacement leans on deeper plays. Ultra-deep acquisition requires bespoke node handling, bolstering barriers to entry and protecting pricing in the Asia Pacific offshore seismic services market.
By Application: CCS Emerges as Fastest-Growing End-Use
Oil and gas exploration retained 81.1% value in 2025, yet CCS will rise at a 14.8% CAGR through 2031. Enping 15-1’s offshore CCS pilot runs six-month repeat shoots to verify plume containment. Abadi LNG adopts identical protocols, guaranteeing steady surveys to 2035.
Offshore renewables and subsea cables add incremental revenue, while EMGS pursues CSEM imaging of seabed massive sulfides, signaling diversification opportunities for the Asia Pacific offshore seismic services industry. Operators increasingly bundle hydrocarbon, CCS, and renewable scopes within a single contract, widening addressable markets for contractors.
Geography Analysis
China’s 32.4% share in 2025 stems from CNOOC’s 2.13 million boe/d output and six new Bohai discoveries, each underpinned by advanced broadband seismic. COSL modernized its fleet and shot surveys in Gorontalo and Tomini Bay, reinforcing cost leadership and lifting domestic vessel utilization.
India is the fastest-growing geography at 13.5% CAGR, thanks to 85 new OALP blocks and rising private participation. EMGS completed a CSEM campaign, but falling revenues forced strategic restructuring, illustrating high entry barriers.
Japan, South Korea, and ASEAN contribute sizeable LNG-led demand. METI’s Plan B keeps Japanese offshore gas prospects alive, while KNOC and BP advance the Great Whale project toward 2027 FID. Malaysia’s PETRONAS maintains a two-year PXGEO contract, and Indonesia anchors vessel schedules with South Andaman and Tangkulo shoots.
Australia and New Zealand oscillate between pro-exploration policies and rigorous environmental oversight. NOPSEMA’s wildlife rulings delayed Otway shoots, but legacy Bonaparte datasets reprocessed by TGS keep revenue flowing. Papua LNG and Brunei blocks provide high-margin spot work, balancing the demand mix of the Asia Pacific offshore seismic services market.

Competitive Landscape
The Asia Pacific offshore seismic services market is consolidated. TGS, CGG, PGS, and Schlumberger’s WesternGeco control premium streamer capacity, while COSL, Shearwater, and Fugro leverage regional relationships. TGS secured a three-year Chevron capacity deal, guaranteeing vessel days and bundling GeoStreamer data licensing. Shearwater’s Sabah OBN award illustrates node leadership, yet overall fleet utilization remained 67% in 2025, evidencing residual oversupply.
Technology suppliers are disruptive forces. STRYDE’s lightweight nodes lower logistics costs, enabling PT Elnusa’s high-density campaigns and eroding incumbents’ hardware advantage. DUG Technology pivots toward processing-led models with its 45,000 km² Sarawak reprocessing program, extracting value from legacy data without new acquisition spend.
Financial resilience separates winners from laggards: EMGS explored bond-to-equity conversions after Q4 2025 revenue halved, underlining capital-intensity risks. Contractors with proprietary tech, long-term charters, and end-to-end workflows enjoy pricing power in the Asia Pacific offshore seismic services market, whereas pure-play acquisition specialists face commoditization.
Asia Pacific Offshore Seismic Services Industry Leaders
Schlumberger Ltd
Halliburton Company
China Oilfield Services Limited
Fugro NV
SAExploration Holdings Inc
- *Disclaimer: Major Players sorted in no particular order

Recent Industry Developments
- March 2026: CNOOC reported net production of 2.13 million boe/d and 7.77 billion boe proved reserves, plus six new Bohai discoveries.
- February 2026: DUG and Searcher began reprocessing 60 legacy 3D surveys (45,000 km²) offshore Sarawak, with deliveries from mid-2027.
- January 2026: PT Elnusa invested in 25,000 STRYDE Range+ nodes, achieving 3,240-node daily deployment.
- December 2025: EMGS hired advisors to explore bond-for-equity swaps after Q4 2025 revenue fell to USD 3.9 million.


Asia Pacific Offshore Seismic Services Market Report Scope
Seismic services use seismic waves to facilitate oil companies to locate reservoirs and define oil and natural gas fields. In addition, seismic services enable companies to accurately plan locations for wells by reducing the requirement for further exploration and reducing negative environmental impact.
The Asia-Pacific Offshore Seismic Services Market is segmented into service, seismic technology, water depth, application, and geography. By service, the market is segmented into data acquisition, data processing, and interpretation services. By seismic technology, the market is segmented into 2D, 3D, 4D/time-lapse, and ocean-bottom node technologies. By water depth, the market is segmented into shallow-water up to 500m, deep-water 500–1500m, and ultra-deep-water over 1500m. By application, the market is segmented into oil and gas, offshore energy and marine, CCUS, mining, geothermal, civil engineering, and other applications. The report also covers the market size and forecasts for the offshore seismic services market across key countries and regions in Asia-Pacific, including China, India, Japan, South Korea, ASEAN, Australia and New Zealand, and the Rest of Asia-Pacific. For each segment, the market sizing and forecasts have been done on the basis of value (USD).
| Data Acquisition |
| Data Processing and Interpretation |
| 2D Seismic |
| 3D Seismic |
| 4D/Time-Lapse Seismic |
| Ocean-Bottom Node (OBN) Seismic |
| Shallow-water (Up to 500 m) |
| Deep-water (500 to 1500 m) |
| Ultra-deep-water (Over 1500 m) |
| Oil and Gas |
| Offshore Energy and Marine |
| Carbon Capture, Utilization and Storage (CCUS) |
| Mining and Mineral Exploration |
| Geothermal Energy |
| Civil Engineering and Infrastructure |
| Others (Natural Hazard Assessment, Environmental Studies, and Academic & Research) |
| China |
| India |
| Japan |
| South Korea |
| ASEAN Countries |
| Australia and New Zealand |
| Rest of Asia-Pacific |
| By Service | Data Acquisition |
| Data Processing and Interpretation | |
| By Seismic Technology | 2D Seismic |
| 3D Seismic | |
| 4D/Time-Lapse Seismic | |
| Ocean-Bottom Node (OBN) Seismic | |
| By Water Depth | Shallow-water (Up to 500 m) |
| Deep-water (500 to 1500 m) | |
| Ultra-deep-water (Over 1500 m) | |
| By Application | Oil and Gas |
| Offshore Energy and Marine | |
| Carbon Capture, Utilization and Storage (CCUS) | |
| Mining and Mineral Exploration | |
| Geothermal Energy | |
| Civil Engineering and Infrastructure | |
| Others (Natural Hazard Assessment, Environmental Studies, and Academic & Research) | |
| By Geography | China |
| India | |
| Japan | |
| South Korea | |
| ASEAN Countries | |
| Australia and New Zealand | |
| Rest of Asia-Pacific |


Key Questions Answered in the Report
What is themarket size of the Asia Pacific offshore seismic services market?
The solar cell market size is projected to reach USD 0.94 billion in 2026, continuing toward USD 1.55 billion by 2031 with CAGR of 10.52%.
Which country is expected to grow fastest in regional offshore seismic demand?
India is forecast to post a 13.5% CAGR through 2031 due to new OALP block awards.
Which service line shows the highest growth?
Data processing and interpretation is expanding at 12.3% CAGR as operators reprocess legacy data.
Why is 4D seismic gaining traction in the region?
Mature fields require time-lapse monitoring to optimize recovery, driving 13.1% CAGR for 4D services.
How does CCS influence future seismic activity?
Commercial-scale CCS projects need repeat seismic surveys every 6-12 months, creating the fastest-growing application segment at 14.8% CAGR.
Page last updated on:


