Market Overview
| Study Period | 2018 - 2031 |
|---|---|
| Forecast Data Period | 2026 - 2031 |
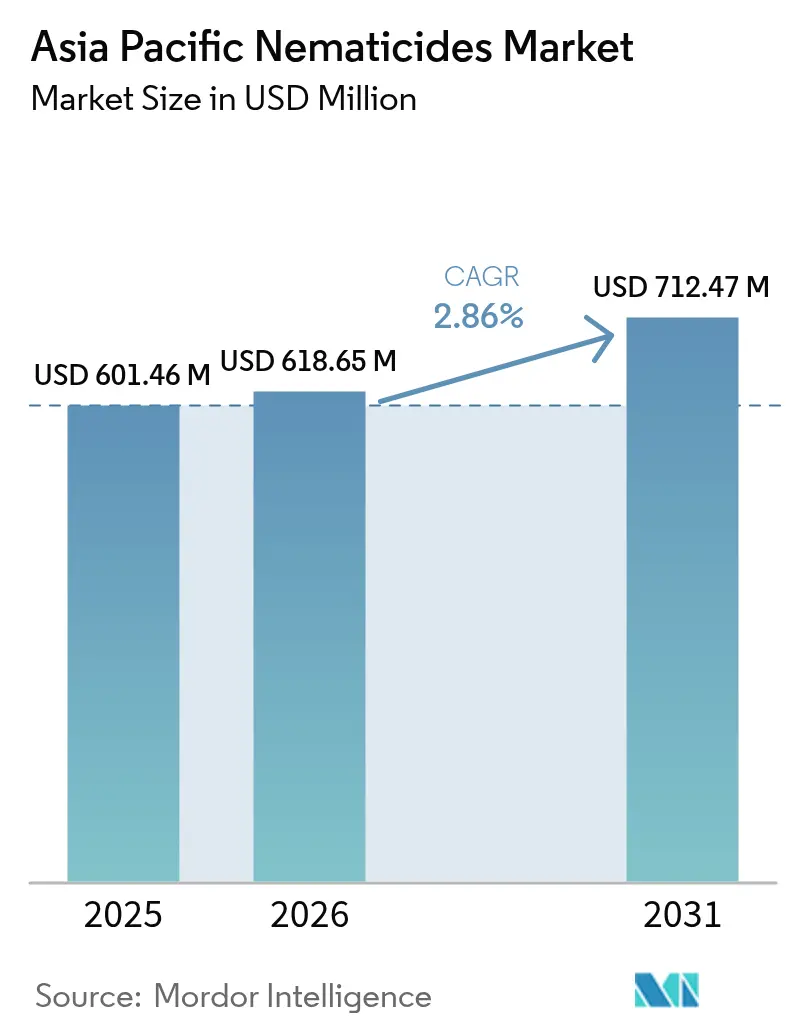
| Base Year Market Size (2025) | USD 601.46 Million |
| Market Size (2026) | USD 618.65 Million |
| Market Size (2031) | USD 712.47 Million |
| Growth Rate (2026 - 2031) | 2.86% CAGR |
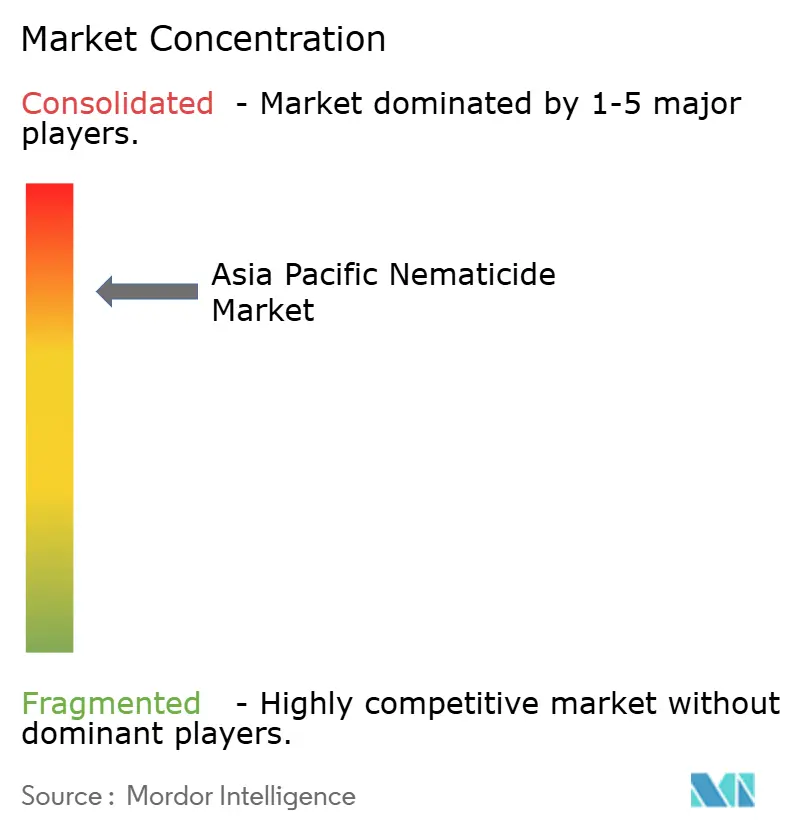
| Market Concentration | High |
Major Players *Disclaimer: Major Players sorted in no particular order Image © Mordor Intelligence. Reuse requires attribution under CC BY 4.0. | |
Asia Pacific Nematicides Market Analysis by Mordor Intelligence
The Asia Pacific nematicides market size is expected to grow from USD 601.46 million in 2025 to USD 618.65 million in 2026 and is forecast to reach USD 712.47 million by 2031 at 2.86% CAGR over 2026-2031. This trajectory signals the region’s ongoing shift from high-toxicity carbamate and organophosphate products toward next-generation synthetic molecules that meet tighter soil-health guidelines while protecting yields against root-knot and cyst nematodes[1]Source: China Ministry of Agriculture, “Pesticide Registration and Management Guidelines,” moa.gov.cn. Accelerating approvals for fluensulfone, fluopyram, and fluazaindolizine, coupled with the robust adoption of micro-encapsulated abamectin, illustrates how input suppliers are aligning their portfolios with residue-limit mandates and export market expectations. China continues to anchor the Asia Pacific nematicide market as intensive vegetable systems adopt oxamyl and fluensulfone following the ban on carbofuran, while Myanmar, Vietnam, and Thailand register significant gains through protected cultivation, chemigation, and government mechanization schemes[2]Source: Indian Council of Agricultural Research, “Protected Cultivation Development Report 2024,” icar.org.in . The oligopolistic supplier base leverages deep toxicology files and regional registration know-how to defend share, yet competition intensifies as RNA technology, seed-treatment bundling, and premium formulations redefine value propositions across the Asia Pacific nematicide industry.
Key Report Takeaways
- By application mode, soil treatment commanded 68.85% of the Asia Pacific nematicides market size in 2025, while foliar delivery is projected to expand at a 2.57% CAGR through 2031, making it the fastest-growing approach.
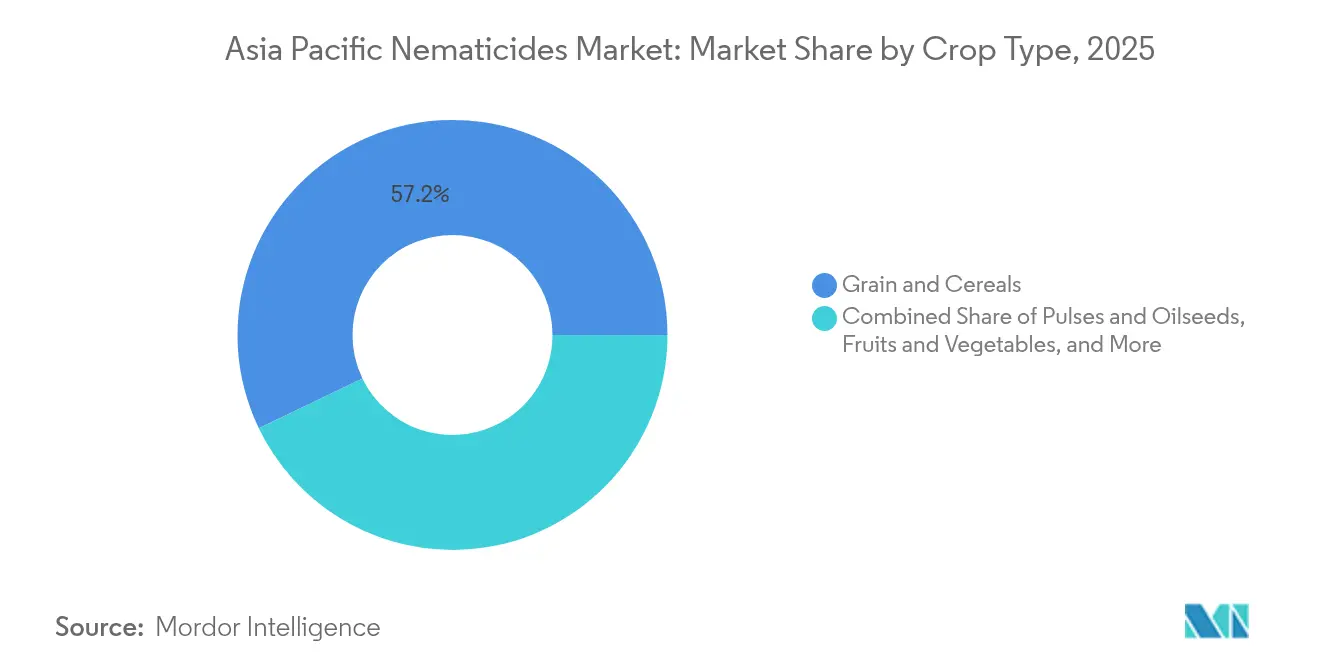
- By crop type, grains and cereals accounted for 57.15% of the Asia Pacific nematicides market share in 2025, while fruits and vegetables are anticipated to post a 3.05% CAGR through 2031, the highest among all segments.
- By geography, China captured 35.42% of the 2025 revenue, whereas Myanmar is anticipated to grow at a 4.26% CAGR through 2031.
Note: Market size and forecast figures in this report are generated using Mordor Intelligence’s proprietary estimation framework, updated with the latest available data and insights as of 2026.
Asia Pacific Nematicides Market Trends and Insights
Drivers Impact Analysis*
| Driver | (~) % Impact on CAGR Forecast | Geographic Relevance | Impact Timeline |
|---|---|---|---|
| Stringent soil-health regulations | +0.5% | China, Japan, Australia, and the Association of Southeast Asian Nations (ASEAN) uptake | Medium term (2–4 years) |
| Surge in protected-cultivation acreage | +0.4% | India, Thailand, Vietnam, and Myanmar | Short term (≤ 2 years) |
| Transition to next-generation low-toxicity chemistries | +0.3% | Region-wide, with Japan and Australia leading | Long term (≥ 4 years) |
| Seed-applied nematicide uptake in cereals and oilseeds | +0.2% | China and India's belts with the Association of Southeast Asian Nations (ASEAN) spillover | Medium term (2–4 years) |
| Micro-encapsulated formulations enabling safer handling | +0.1% | Labor-intensive ASEAN-5 clusters | Short term (≤ 2 years) |
| OEM pre-mix deals between seed firms and chem suppliers | +0.1% | Large seed markets across the Asia Pacific | Long term (≥ 4 years) |
| Source: Mordor Intelligence | |||
Stringent Soil-Health Regulations
Regulatory authorities across the Asia Pacific are phasing out carbofuran, aldicarb, and similar molecules, thereby propelling demand for fluensulfone, oxamyl, and fluazaindolizine that meet export residue limits and domestic soil-health codes[3]Source: China Ministry of Agriculture, “Pesticide Registration and Management Guidelines,” moa.gov.cn. China’s 2024 ban on carbofuran in vegetables forced an industrywide reformulation wave, while Japan’s revised Agricultural Chemicals Regulation Law now requires comprehensive biodegradation data and groundwater mobility studies for every renewal filing. Australia evaluates the impact of soil microbiomes prior to registration, tipping the scale toward narrow-spectrum actives that spare beneficial arthropods. As a result, suppliers with exhaustive toxicology libraries and multi-country dossiers earn first-mover advantage in the Asia Pacific nematicides market.
Surge in Protected-Cultivation Acreage
The greenhouse and net-house area increased by 23% in India and 21% in Thailand in 2024, creating microclimates where Meloidogyne populations multiply unchecked and require frequent intervention. Enclosed settings restrict fumigation and demand low-residue outputs, so growers pivot to systemic synthetics, such as abamectin and spirotetramat, which move from foliage to roots through xylem transport. Chemigation compatibility enables the drip-line delivery of water-soluble formulations, while microcapsule technologies extend the control window between flushes. High capital outlay per hectare lifts the economic threshold for treatment, encouraging adoption of premium products across the Asia Pacific nematicide industry.
Transition to Next-Generation Low-Toxicity Chemistries
Since 2023, more than a dozen fluensulfone and fluazaindolizine registrations have gone live, providing new modes of action that address resistance and environmental concerns simultaneously. Corteva’s fluazaindolizine launch in Japan and Syngenta’s fluopyram expansion across ASEAN countries underscore a strategic migration toward selective molecules with short reentry intervals. Patent pipelines feature oximecarboxamides and spirotetramide derivatives positioned as substitutes for organophosphates, reinforcing portfolio renewal momentum within the Asia Pacific nematicides market.
Seed-Applied Nematicide Uptake in Cereals and Oilseeds
Hybrid rice, corn, and soybean packages now arrive pre-dressed with oxamyl or fluopyram layers, providing prophylactic defense during the vulnerable seedling stage and reducing the active-ingredient footprint compared to broadcast drenching. Corteva’s integrated seed-treatment roll-out in China bundles genetics, chemistry, and agronomic support, accelerating uniform adoption among smallholders who previously skipped nematode control due to cost or labor constraints. Locked-in chemistry volumes through 2030 help stabilize the Asia Pacific nematicides market for suppliers even as field-application demand fluctuates.
Restraints Impact Analysis*
| Restraint | (~) % Impact on CAGR Forecast | Geographic Relevance | Impact Timeline |
|---|---|---|---|
| Regulatory phase-outs of high-toxicity actives | -0.3% | China, Japan, Australia, and the swift Association of Southeast Asian Nations (ASEAN) uptake | Short term (≤ 2 years) |
| Rising active-ingredient costs | -0.2% | Region-wide, most acute in price-sensitive belts | Medium term (2–4 years) |
| Environmental litigation risk around fumigants | -0.1% | Japan and Australia, emerging in ASEAN | Long term (≥ 4 years) |
| Restricted re-entry intervals in labor-intensive crops | -0.1% | High-value horticulture hubs across the Asia Pacific | Short term (≤ 2 years) |
| Source: Mordor Intelligence | |||
Regulatory Phase-Outs of High-Toxicity Actives
China’s complete withdrawal of carbofuran eliminated approximately 35% of registered nematicide Stock Keeping Units (SKUs), exacerbating seasonal price spikes and complicating resistance-management rotations for vegetable producers. Japan’s enhanced toxicology thresholds triggered the cancellation of six organophosphate products, prompting growers to switch to pricier replacements that require new application timing. Such abrupt exits can tighten supply, elevate compliance complexity, and potentially dampen uptake where affordable alternatives are lacking across the Asia Pacific nematicides market.
Rising Active-Ingredient Costs
Spot prices for oxamyl and abamectin climbed 31% in 2024 as Chinese intermediates faced feedstock shortages and freight premiums, a surge that placed premium synthetics beyond the reach of rice and pulse farmers operating on razor-thin margins. Currency devaluation in India, combined with longer shipping cycles, magnified landed-cost hikes, prompting growers to ration use or revert to cultural controls, potentially tempering volume expansion in the Asia Pacific nematicide industry.
*Our forecasts treat driver/restraint impacts as directional, not additive. The impact forecasts reflect baseline growth, mix effects, and variable interactions.
Segment Analysis
By Application Mode: Soil Treatment Dominance Meets Foliar Innovation
Soil treatment held 68.85% share of the Asia Pacific nematicides market in 2025, reflecting entrenched practices of pre-plant incorporation and at-plant banding with fluensulfone and oxamyl. However, foliar systems are advancing at a 2.57% CAGR, driven by abamectin and spirotetramat that translocate downward to roots while avoiding soil persistence issues, especially in protected cultivation. Within the Asia Pacific nematicides market for soil applications, chemigation adoption enables growers to meter solubilized actives precisely at nematode hotspots, reducing waste and satisfying residue audits.
Seed treatment accounts for a small yet rapidly growing minority share as grain producers apply oxamyl and fluopyram coatings that protect stands during germination. Controlled-release micro-capsules, meanwhile, prolong field efficacy without raising reentry intervals, supporting labor management in high-value horticulture. Fumigation continues to decline amid legal challenges to 1,3-dichloropropene and chloropicrin, reinforcing the shift toward selective synthetics within the Asia Pacific nematicide industry.


By Crop Type: Grains Anchor Volume While Fruits Command Premiums
Grains and cereals remained the backbone, accounting for 57.15% of the 2025 volume, driven by the adoption of bundled seed treatments as standard practice in rice, wheat, and corn systems. The Asia Pacific nematicides market size for grains offers a predictable baseline demand even when commodity prices soften. Fruits and vegetables, while smaller by area, deliver a 3.05% CAGR owing to export rules that mandate residue-compliant synthetics over residual fumigants. High unit margins in apples, berries, and bell peppers justify multiple in-season sprays, elevating the segment’s revenue share.
Commercial crops, such as sugarcane and cotton, face a mounting nematode load under monoculture, prompting growers to adopt soil-persistent synthetic pesticides. Turf and ornamentals remain niche yet profitable domains where aesthetics outweigh cost considerations. Pulses and oilseeds present an untapped upside once cost-effective, low-dose synthetics gain registration, especially in Myanmar and Cambodia, where the area for protein crops expands within the Asia Pacific nematicides market.
Geography Analysis
China commands 35.42% of the Asia Pacific nematicides market, combining intensive greenhouse vegetables with mechanized row crops that increasingly deploy AI-aided soil sensors to pinpoint treatment zones. Carbofuran’s exit increased per-hectare spending on fluensulfone and oxamyl, while provincial subsidies for digital agriculture accelerated the adoption of variable-rate sprayers.
India presents a dichotomy: smallholder fragmentation caps broad-acre synthetic uptake, yet its 52,000 hectares of protected cultivation require precise foliar and drip treatments that elevate revenue per hectare. Myanmar stands out with a 4.26% CAGR as donor-funded mechanization pipelines integrate nematicides into emerging maize and pulse acreage.
Japan and Australia are regulatory vanguards, championing reduced-risk synthetics, seed packages, and drone-enabled mapping that limit over-application. Thailand and Vietnam utilize export-oriented horticulture to justify premium treatments, while Indonesia and the Philippines close knowledge gaps through farmer-training alliances with multinational companies. Cambodia and Laos remain in early adoption phases, but rising extension outreach and supply-chain upgrades foreshadow incremental contributions to the Asia Pacific nematicide industry.
Competitive Landscape
The Asia Pacific nematicides market remains highly consolidated, with UPL Limited, Syngenta Group Co., Ltd., Corteva, Inc., Bayer Aktiengesellschaft, and FMC Corporation collectively capturing a prominent share of regional revenue in 2024. Their dominant share reflects deep toxicology libraries, multi-country registration expertise, and local production footprints that accelerate product approvals and distribution. Each company also maintains broad portfolios that span soil treatments, foliar synthetics, and seed-applied coatings, allowing them to serve diverse crop and climatic needs. Long-standing relationships with national research institutes and large grower cooperatives further reinforce brand loyalty. High entry barriers, tied to lengthy field trials and costly residue studies, keep most emerging rivals from scaling up quickly.
UPL Limited and Syngenta Group Co., Ltd. anchor the leaderboard with significant shares, respectively, and both are boosting capacity to protect their advantage. UPL Limited is expanding formulation plants in India and Thailand while signing seed-treatment supply contracts that lock in oxamyl and fluopyram volumes through 2030. Syngenta Group Co., Ltd. is channeling research and development funds into fluazaindolizine and precision-delivery platforms, and the firm has just secured Japanese clearance for a novel, reduced-risk active that targets resistant nematode strains. These moves help each company widen its product gap and enhance service responsiveness across China, India, and the rapidly growing ASEAN markets.
Corteva, Inc., Bayer Aktiengesellschaft, and FMC Corporation round out the top five and are driving innovation to defend their positions. Corteva, Inc. leverages its seed-treatment ecosystem and the recent launch of fluazaindolizine to bundle genetics, chemistry, and advisory services in integrated offers. Bayer Aktiengesellschaft focuses on polymer-encapsulated abamectin and drone-enabled mapping that reduces operator exposure and delivers precise root-zone placement in high-value fruit and vegetable crops. FMC Corporation is scaling fluensulfone production through a USD 120 million investment in South and Southeast Asia, ensuring a steady supply of reduced-risk synthetics as organophosphate alternatives exit the market.
Asia Pacific Nematicides Industry Leaders
Bayer AG
Corteva Agriscience
Syngenta Group
UPL Limited
FMC Corporation
- *Disclaimer: Major Players sorted in no particular order

Recent Industry Developments
- September 2025: UPL Global acquired a 49% stake in Grow Chemical Co. Ltd. of Thailand for USD 0.76 million, securing local distribution channels for nematicide solutions. The move is poised to increase the uptake of reduced-risk synthetics among Thai greenhouse and net-house growers, thereby strengthening UPL Limited’s footprint across Southeast Asia.
- September 2024: Syngenta Group Co., Ltd. secured China’s first registration for an RNA-interference nematicide following six years of field trials. The approval introduces a novel mode of action that is anticipated to accelerate the regional transition away from high-toxicity organophosphates toward precision biological chemistry.
- June 2024: FMC Corporation has opened a USD 32 million regional R&D center in Singapore focused on developing heat-stable nematicide formulations. The facility is anticipated to accelerate product tailoring for tropical conditions and strengthen market penetration in humid Southeast Asian production systems.


Asia Pacific Nematicides Market Report Scope
A nematicide is a chemical used to control or eliminate plant-parasitic nematodes to protect crop health and yield. The Asia Pacific Nematicides Market Report is segmented by application mode including Chemigation, Foliar, Fumigation, Seed treatment and soil treatment; by crop type, including Commercial Crops, Fruits and Vegetables, Grains and Cereals, and Pulses and oilseeds, and Truf and Ornamental; and by geography including Australia, China, India, Indonesia, Japan, Myanmar, Pakistan, Philippines, Thailand, Vietnam, and the rest of Asia-Pacific. Market forecasts are presented in terms of value (USD) and volume (Metric Tons).
Application Mode
| Chemigation |
| Foliar |
| Fumigation |
| Seed Treatment |
| Soil Treatment |
Crop Type
| Commercial Crops |
| Fruits and Vegetables |
| Grains and Cereals |
| Pulses and Oilseeds |
| Turf and Ornamental |
By Geography
| Australia |
| China |
| India |
| Indonesia |
| Japan |
| Myanmar |
| Pakistan |
| Philippines |
| Thailand |
| Vietnam |
| Rest of Asia-Pacific |
| Application Mode | Chemigation |
| Foliar | |
| Fumigation | |
| Seed Treatment | |
| Soil Treatment | |
| Crop Type | Commercial Crops |
| Fruits and Vegetables | |
| Grains and Cereals | |
| Pulses and Oilseeds | |
| Turf and Ornamental | |
| By Geography | Australia |
| China | |
| India | |
| Indonesia | |
| Japan | |
| Myanmar | |
| Pakistan | |
| Philippines | |
| Thailand | |
| Vietnam | |
| Rest of Asia-Pacific |


Market Definition
- Function - Nematicides are chemicals used to control or prevent nematodes from damaging the crop and prevent yield loss.
- Application Mode - Foliar, Seed Treatment, Soil Treatment, Chemigation, and Fumigation are the different type of application modes through which crop protection chemicals are applied to the crops.
- Crop Type - This represents the consumption of crop protection chemicals by Cereals, Pulses, Oilseeds, Fruits, Vegetables, Turf, and Ornamental crops.
| Keyword | Definition |
|---|---|
| IWM | Integrated weed management (IWM) is an approach to incorporate multiple weed control techniques throughout the growing season to give producers the best opportunity to control problematic weeds. |
| Host | Hosts are the plants that form relationships with beneficial microorganisms and help them colonize. |
| Pathogen | A disease-causing organism. |
| Herbigation | Herbigation is an effective method of applying herbicides through irrigation systems. |
| Maximum residue levels (MRL) | Maximum Residue Limit (MRL) is the maximum allowed limit of pesticide residue in food or feed obtained from plants and animals. |
| IoT | The Internet of Things (IoT) is a network of interconnected devices that connect and exchange data with other IoT devices and the cloud. |
| Herbicide-tolerant varieties (HTVs) | Herbicide-tolerant varieties are plant species that have been genetically engineered to be resistant to herbicides used on crops. |
| Chemigation | Chemigation is a method of applying pesticides to crops through an irrigation system. |
| Crop Protection | Crop protection is a method of protecting crop yields from different pests, including insects, weeds, plant diseases, and others that cause damage to agricultural crops. |
| Seed Treatment | Seed treatment helps to disinfect seeds or seedlings from seed-borne or soil-borne pests. Crop protection chemicals, such as fungicides, insecticides, or nematicides, are commonly used for seed treatment. |
| Fumigation | Fumigation is the application of crop protection chemicals in gaseous form to control pests. |
| Bait | A bait is a food or other material used to lure a pest and kill it through various methods, including poisoning. |
| Contact Fungicide | Contact pesticides prevent crop contamination and combat fungal pathogens. They act on pests (fungi) only when they come in contact with the pests. |
| Systemic Fungicide | A systemic fungicide is a compound taken up by a plant and then translocated within the plant, thus protecting the plant from attack by pathogens. |
| Mass Drug Administration (MDA) | Mass drug administration is the strategy to control or eliminate many neglected tropical diseases. |
| Mollusks | Mollusks are pests that feed on crops, causing crop damage and yield loss. Mollusks include octopi, squid, snails, and slugs. |
| Pre-emergence Herbicide | Preemergence herbicides are a form of chemical weed control that prevents germinated weed seedlings from becoming established. |
| Post-emergence Herbicide | Postemergence herbicides are applied to the agricultural field to control weeds after emergence (germination) of seeds or seedlings. |
| Active Ingredients | Active ingredients are the chemicals in pesticide products that kill, control, or repel pests. |
| United States Department of Agriculture (USDA) | The Department of Agriculture provides leadership on food, agriculture, natural resources, and related issues. |
| Weed Science Society of America (WSSA) | The WSSA, a non-profit professional society, promotes research, education, and extension outreach activities related to weeds. |
| Suspension concentrate | Suspension concentrate (SC) is one of the formulations of crop protection chemicals with solid active ingredients dispersed in water. |
| Wettable powder | A wettable powder (WP) is a powder formulation that forms a suspension when mixed with water prior to spraying. |
| Emulsifiable concentrate | Emulsifiable concentrate (EC) is a concentrated liquid formulation of pesticide that needs to be diluted with water to create a spray solution. |
| Plant-parasitic nematodes | Parasitic Nematodes feed on the roots of crops, causing damage to the roots. These damages allow for easy plant infestation by soil-borne pathogens, which results in crop or yield loss. |
| Australian Weeds Strategy (AWS) | The Australian Weeds Strategy, owned by the Environment and Invasives Committee, provides national guidance on weed management. |
| Weed Science Society of Japan (WSSJ) | WSSJ aims to contribute to the prevention of weed damage and the utilization of weed value by providing the chance for research presentation and information exchange. |


Research Methodology
Mordor Intelligence follows a four-step methodology in all our reports.
- Step-1: Identify Key Variables: In order to build a robust forecasting methodology, the variables and factors identified in Step-1 are tested against available historical market numbers. Through an iterative process, the variables required for market forecast are set and the model is built on the basis of these variables.
- Step-2: Build a Market Model: Market-size estimations for the forecast years are in nominal terms. Inflation is not a part of the pricing, and the average selling price (ASP) is kept constant throughout the forecast period.
- Step-3: Validate and Finalize: In this important step, all market numbers, variables and analyst calls are validated through an extensive network of primary research experts from the market studied. The respondents are selected across levels and functions to generate a holistic picture of the market studied.
- Step-4: Research Outputs: Syndicated Reports, Custom Consulting Assignments, Databases & Subscription Platforms


