
Market Overview
| Study Period | 2020 - 2031 |
|---|---|
| Forecast Data Period | 2026 - 2031 |
| Base Year Market Size (2025) | USD 58.14 Trillion |
| Market Size (2026) | USD 60.9 Trillion |
| Market Size (2031) | USD 76.78 Trillion |
| Growth Rate (2026 - 2031) | 4.75 % |
| Market Concentration | Medium |
Major Players *Disclaimer: Major Players sorted in no particular order Image © Mordor Intelligence. Reuse requires attribution under CC BY 4.0. | |
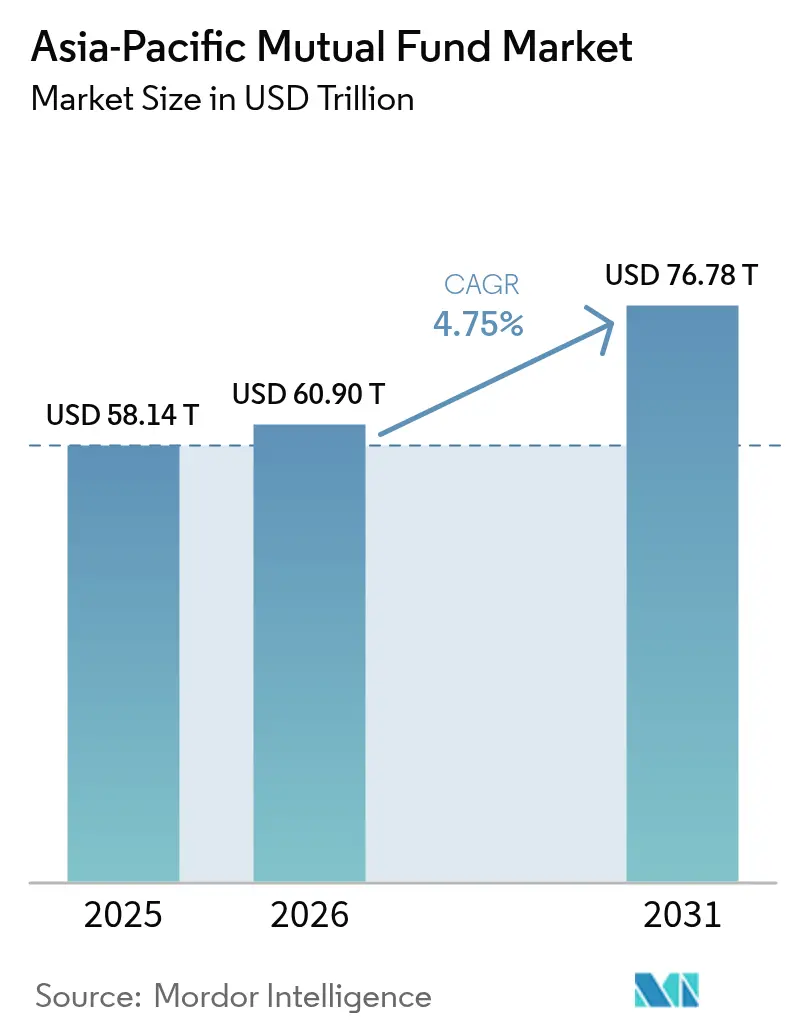
Asia-Pacific Mutual Fund Market Analysis by Mordor Intelligence
The Asia-Pacific mutual fund market size was valued at USD 58.14 trillion in 2025 and estimated to grow from USD 60.9 trillion in 2026 to reach USD 76.78 trillion by 2031, at a CAGR of 4.75% during the forecast period (2026-2031). Steady wealth creation across the region, supportive tax incentives for retirement savings, and rapid digital adoption continue to funnel assets into professionally managed products. Asset managers are accelerating technology investments, particularly in robo-advisory tools, to capture younger investors now entering their prime earning years. Parallel efforts by regulators—ranging from Hong Kong’s green-finance disclosures to India’s simplified on-boarding for systematic investment plans—are harmonizing market rules and lowering cross-border barriers. Geopolitical uncertainty and rate volatility still inject bouts of risk-off flows, yet the structural drivers of household financialization keep the region’s long-term growth outlook intact.
Key Report Takeaways
- By asset class, equity funds led with 44.32% of the Asia-Pacific mutual fund market share in 2025; ESG-equity funds are projected to expand at an 11.25% CAGR to 2031.
- By investor type, retail investors accounted for 61.10% of the Asia-Pacific mutual fund market size in 2025, while the institutional segment is projected to rise at an 8.05% CAGR through 2031.
- By distribution channel, banks controlled 48.85% of the Asia-Pacific mutual fund market size in 2025, whereas online platforms are forecast to grow at a 12.78% CAGR between 2026-2031.
- By geography, China dominated with 27.30% Asia-Pacific mutual fund market share in 2025; South-East Asia is advancing at a 10.05% CAGR through 2031.
Note: Market size and forecast figures in this report are generated using Mordor Intelligence’s proprietary estimation framework, updated with the latest available data and insights as of 2026.
Asia-Pacific Mutual Fund Market Trends and Insights
Drivers Impact Analysis*
| Driver | (~) % Impact on CAGR Forecast | Geographic Relevance | Impact Timeline |
|---|---|---|---|
| APAC middle-class wealth expansion | +1.2% | India, China, South-East Asia | Medium term (2-4 years) |
| Retirement-linked tax incentives | +0.8% | Australia, China, Hong Kong, India, Thailand | Long term (≥4 years) |
| Robo-advisory adoption in tier-2 cities | +0.6% | India, China, Malaysia, Indonesia | Short term (≤2 years) |
| ESG-themed funds expansion | +1.0% | Japan, Australia, Singapore | Medium term (2-4 years) |
| Tokenized fund units via blockchain rails | +0.9% | Global APAC, strongest in Singapore, Japan, China | Medium term (2-4 years) |
| Central-bank digital currency (CBDC) integration with fund platforms | +0.7% | APAC core markets including China, India, South-East Asia | Short to medium term (1-3 years) |
| Source: Mordor Intelligence | |||
APAC Middle-Class Wealth Expansion Drives Systematic Investment Flows
Household incomes in Asia continue to rise quickly, and the share of disposable income earmarked for long-term savings has climbed in tandem. India’s mutual fund AUM hit INR 53.40 lakh crore in March 2024 after a 35.46% year-over-year surge, illustrating how systematic investment plans capture a large share of incremental household savings[1]INDmoney, “What Is Jio BlackRock, and Will It Change How Indians Invest?,” indmoney.com. . Across China and Indonesia, new low-cost feeder funds linked to global indices have democratized equity exposure for first-time investors. Family offices are also proliferating, channeling wealth into professionally run funds to institutionalize asset allocation. Such flows cushion the industry against cyclical sell-offs and underpin stable fee revenue for managers.
Retirement-Linked Tax Incentives Accelerate Long-Term Savings
Governments across the Asia-Pacific have broadened tax perks to nudge households toward voluntary retirement plans. Hong Kong allows combined deductions of up to HKD 60,000 a year for deferred-annuity premiums and MPF voluntary top-ups[2]GovHK, “Tax Deductions for Qualifying Annuity Premiums and Tax Deductible MPF Voluntary Contributions,” gov.hk. . China rolled out a nationwide third-pillar pension scheme in 2025 that lets savers deduct up to CNY 12,000 annually, with pension income taxed at a preferential 3% rate. Thailand’s ESG-focused retirement funds grant income-tax relief on 30% of annual earnings (capped at THB 100,000), provided investors hold units for eight years. These measures lock in assets for longer tenors, boosting the stickiness of fund flows.
Robo-Advisory Penetration Transforms Tier-2 City Distribution
Digital wealth platforms are spreading beyond financial hubs into secondary cities. Singapore-based Kristal.AI extended its robo-advisory services to Penang and Surabaya in 2024, leveraging automated risk profiling to deliver custom portfolios at sub-50 bps fees[3]Financial Planning, “Revolut Launches Robo-Advisor in Singapore,” financial-planning.com. . Revolut’s robo launch in Singapore shows how app-based interfaces simplify onboarding and enable micro-investing through round-up features. For fund houses, lower acquisition costs and real-time analytics improve margin profiles. Regulators such as Singapore’s MAS have introduced modular licensing frameworks so digital advisers can scale while maintaining investor-protection safeguards.
ESG-Themed Funds Capture Institutional and Retail Capital
Asia-Pacific investors are adopting ESG mandates at a brisk pace, supported by both moral imperatives and policy nudges. Thailand’s tax-advantaged ESG funds drew THB 45 billion within the first nine months of launch, highlighting retail appetite for sustainable strategies. Hong Kong’s Securities and Futures Commission has approved multiple ESG ETFs, giving asset managers flagship products to passport across the region. Sovereign funds in Australia and Japan are embedding climate metrics into external-manager selection, which is steering inflows toward funds able to evidence carbon-footprint reductions. Equity and bond strategies alike now integrate sustainability scores as a standard data point, making ESG mainstream rather than niche.
Restraints Impact Analysis*
| Restraint | (~) % Impact on CAGR Forecast | Geographic Relevance | Impact Timeline |
|---|---|---|---|
| Regulatory fragmentation across APAC | –0.9% | All major jurisdictions | Long term (≥4 years) |
| Interest-rate-driven flow volatility | –1.1% | Bond-heavy portfolios | Short term (≤2 years) |
| Fund-platform cyber-security breaches | -1.0% | Global APAC, especially in digitally advanced markets like Singapore, Japan, China | Medium term (2-4 years) |
| High domestic-equity concentration risk | -0.8% | APAC, notably in markets with limited diversification options such as India, China | Medium to long term (3-5 years) |
| Source: Mordor Intelligence | |||
Regulatory Fragmentation Increases Cross-Border Compliance Costs
While initiatives such as the ASEAN Collective Investment Scheme aim to harmonize rules, each jurisdiction still maintains unique disclosure templates, liquidity standards, and product-approval timetables. Singapore’s September 2024 rulebook requires daily holdings reporting for retail UCITS, whereas Thailand limits disclosure to month-end snapshots. Managers seeking to market one share class across Asia must therefore run multiple fund umbrellas or employ expensive feeder structures. Such duplication inflates legal and audit outlays and complicates distributor contracts. The frictions also delay ESG and tokenized-fund rollouts because technology guidelines differ between Hong Kong’s SFC circular on tokenization and Singapore’s Project Guardian sandbox.
Interest-Rate-Driven Flow Volatility Challenges Duration Management
Bond funds experienced whipsaw flows during 2024-2025 as diverging central-bank cycles forced sudden reallocations between duration buckets. Japanese investors moved out of global bond mandates when the Bank of Japan trimmed its yield-curve controls, while Indonesian rupiah MMFs saw hefty inflows after surprise rate hikes. Currency swings further magnify total-return dispersion, pressuring multi-asset managers to shorten duration or switch to floating-rate notes. Heightened volatility raises liquidity-management costs because funds must hold larger cash buffers, compressing yield pick-ups. Investors are responding by favoring short-tenor ETFs and target-maturity funds, which alter fee structures for asset managers accustomed to full-service bond mandates.
*Our forecasts treat driver/restraint impacts as directional, not additive. The impact forecasts reflect baseline growth, mix effects, and variable interactions.
Segment Analysis
By Asset Class: ESG Integration Reshapes Equity Leadership
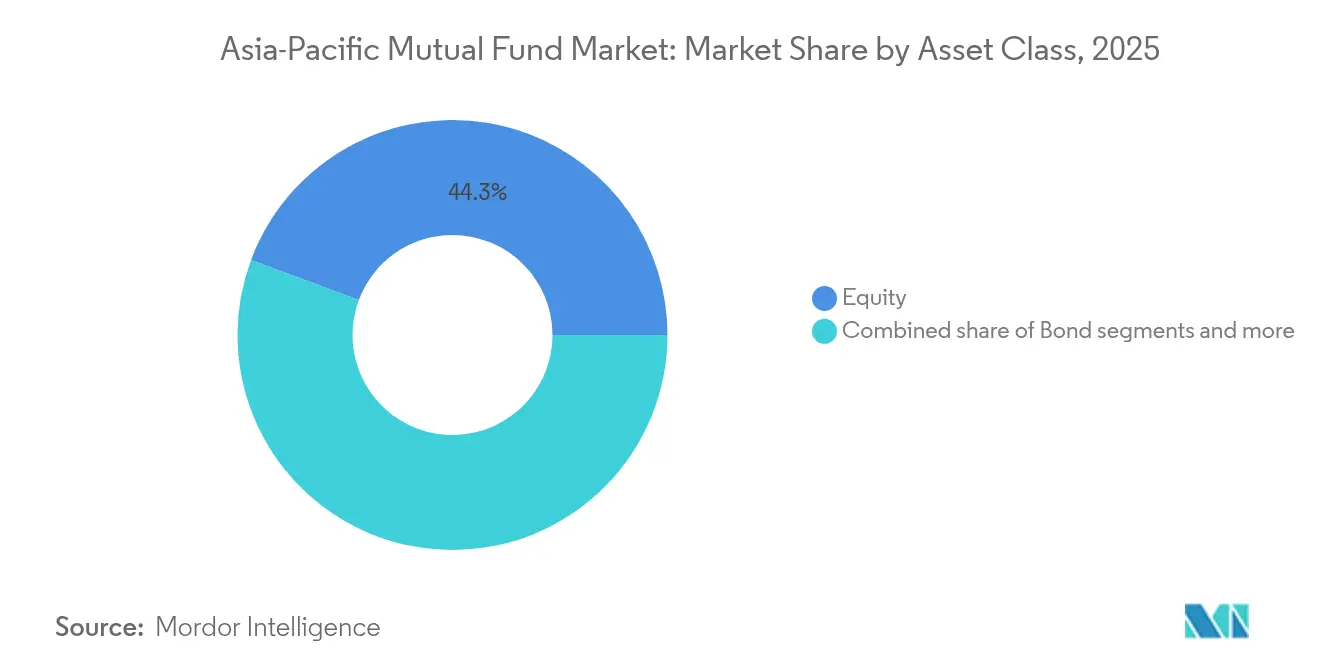
Equity strategies retained 44.32% of the Asia-Pacific mutual fund market share in 2025, while the equity share of the Asia-Pacific mutual fund market size is projected to expand at a significant CAGR through 2031 as ESG integration becomes standard practice. ESG-equity funds alone are pacing at 11.25% CAGR, supported by green-energy subsidies across Japan, Australia, and South Korea. Traditional cap-weighted funds now layer sustainability screens over benchmark allocations, a shift that is pushing data-provider partnerships to the fore. Bond funds hold a steady 27.84% share, yet growth is muted because rising yields compress mark-to-market gains. Hybrid and money-market segments fill tactical roles: the former provides balanced exposure for mass-affluent investors, while the latter offers liquidity havens for corporates managing multi-currency cash.
Over the last decade, equity fund innovation has centered on thematic plays such as renewable infrastructure and digital-economy growth. Tokenized feeder vehicles, launched by Franklin Templeton in Singapore, deliver fractional access to diversified equity portfolios and slash settlement costs, making them attractive to younger investors seeking low entry points. Regulatory guardrails are also evolving, with Hong Kong introducing a “low carbon” fund label that requires 70% of portfolio assets to meet emissions thresholds. Such incentives spur product differentiation but demand robust ESG-data pipelines for compliance assurance.



By Investor Type: Retail Momentum Underpins AUM Expansion
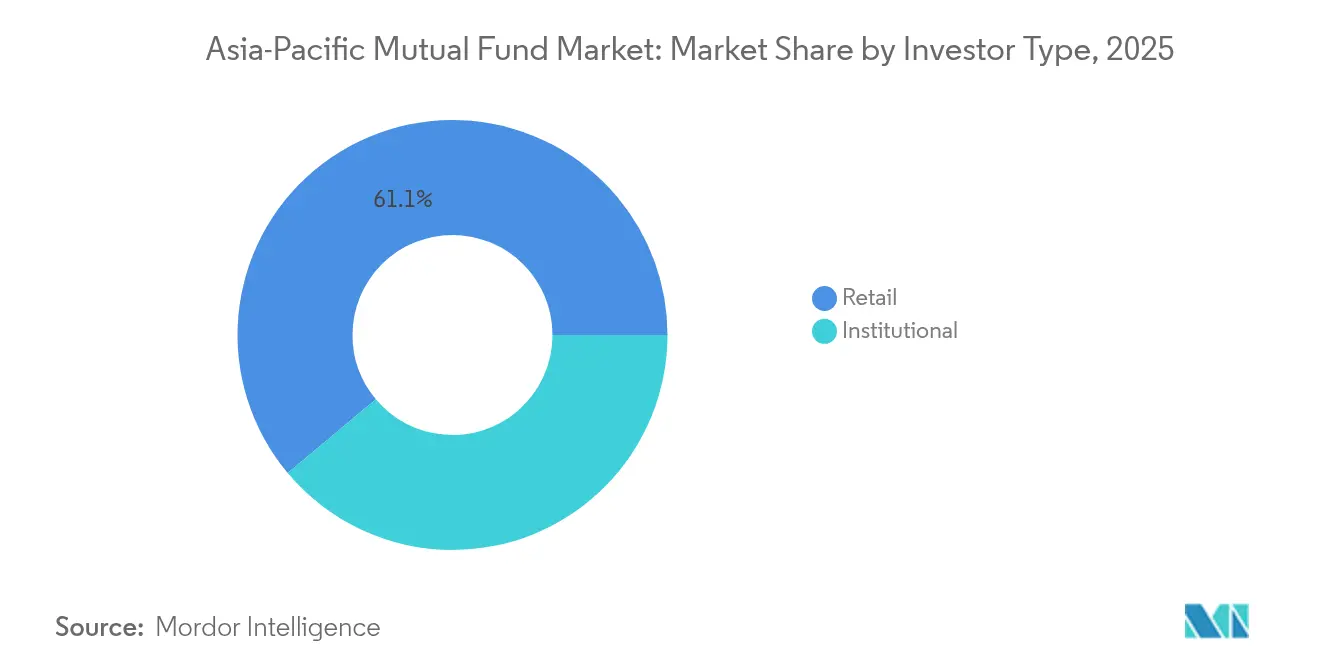
Retail investors controlled 61.10% of the Asia-Pacific mutual fund market size in 2025, reflecting how digital interfaces lower the minimum ticket and ease know-your-customer checks. India’s Jio BlackRock drew 67,000 retail buyers during its INR 17,800 crore debut, proving that zero-commission models can unlock dormant savings pools. Retail CAGR, running at 8.35%, surpasses institutional growth because households are transitioning from bank deposits to market-linked products in search of inflation-beating returns. The demographic tailwind is pronounced, with median ages of 29-36 across much of Southeast Asia, ensuring a multi-decade investment runway.
Institutional participation still anchors fee revenues; pensions, insurers, and sovereign funds command sizeable mandates that fund advanced analytics and bespoke reporting. Eastspring Investments revealed that six APAC markets each contribute over USD 10 billion to its institutional platform, evidence of sticky relationships built on long-duration capital. These investors increasingly request ESG verification, stress-testing, and real-time liquidity dashboards, prompting managers to upgrade operational backbones. Although bulk flows temper overall fee margins, the predictability of institutional assets supports capital-intensive research and risk-management investments.
By Distribution Channel: Digital Platforms Challenge Branch-Centric Models
Banks maintain 48.85% distribution channel share in 2025, leveraging established customer relationships and regulatory advantages, but online platforms represent the fastest-growing channel at 12.78% CAGR as digital transformation reshapes investor behavior. The traditional banking advantage stems from integrated financial services offerings and regulatory frameworks that favor established institutions, particularly in markets like China and India where banking relationships facilitate mutual fund distribution. However, digital disruption is accelerating through platforms that offer direct access, lower fees, and enhanced user experiences that particularly appeal to younger investors.
Financial advisors and direct distribution channels serve specialized market segments, with direct channels gaining traction through digital-first managers like Jio BlackRock that leverage mobile applications and integrated ecosystems to bypass traditional intermediaries. The historical comparison reveals online platforms' growth trajectory mirrors global fintech adoption patterns, with regulatory frameworks increasingly accommodating digital distribution models while maintaining investor protection standards. PwC's ETF distribution analysis highlights how digital channels—including investment apps, neo-brokers, and robo-advisors—are breaking down traditional barriers and enabling personalized investment experiences PwC. Regulatory influence varies by jurisdiction, with Singapore's MAS and Hong Kong's SFC implementing frameworks that support digital innovation while ensuring appropriate investor protection and distributor competence standards.
Geography Analysis
China contributed 27.30% of the Asia-Pacific mutual fund market size in 2025, underpinned by a deep domestic-savings pool and the rollout of nationwide third-pillar pensions. Although capital controls limit outbound allocations, qualified domestic institutional investor quotas now allow select managers to offer foreign-asset exposure, expanding product breadth. India followed with 21.12% share; its 35% year-on-year AUM jump in 2024 stemmed from automated SIP deductions that smooth market timing and foster disciplined investing. Japan’s NISA upgrade pushed household-equity allocations higher, while superannuation mandates keep Australia’s per-capita AUM among the world’s highest.
South-East Asia recorded the fastest 2026-2031 CAGR at 10.05% as the ASEAN CIS framework simplifies fund passporting. The Philippines’ admission to the scheme in late 2024 widened the addressable cross-border base, and Malaysian distributors added multi-currency share classes to suit regional investors. Singapore solidified its hub stature through the Variable Capital Company regime, luring 909 fund entities by August 2025 and shortening product-launch lead times to six weeks. Indonesia and Vietnam, with burgeoning middle classes, are liberalizing foreign-ownership caps to catalyze domestic-fund innovation.
Currency management remains a central theme; Australian investors hedge yen exposure amid diverging rate paths, while Korean funds overlay U.S. dollar options to curb volatility. Regulatory coordination is progressing incrementally: Hong Kong and the mainland’s Wealth Management Connect has amassed USD 3.8 billion since 2024, showcasing appetite for cross-boundary solutions that operate within well-defined quotas. Cyber-security readiness also varies, prompting regional asset managers to allocate larger budgets to endpoint protection and incident-response drills to satisfy multilayer supervisory reviews.
Regulatory Landscape
The regulatory environment across Asia-Pacific continues to be shaped by domestic reforms alongside regional interoperability initiatives. In India, the SEBI (Mutual Funds) Regulations, 2026 came into force on April 1, 2026, replacing the 1996 framework and pointing to a more streamlined rule set for product design, disclosures, and conduct across mutual funds.
Cross-border distribution remains anchored by formal passporting structures, but local rules and disclosure standards still vary. The Asia Region Funds Passport (ARFP) offers a standardized route for cross-border offerings among participating economies including Australia, Japan, New Zealand, Republic of Korea, and Thailand, while Hong Kong is updating its Code on Unit Trusts and Mutual Funds, including proposals that tighten requirements for money market funds. Coordination efforts at APEC level are also reinforcing this direction of travel, with the 2026-2030 APEC Finance Ministers Process roadmap emphasizing innovation and digital-economy transitions that affect fund distribution and servicing models.
Value Chain Analysis
The Asia-Pacific mutual fund value chain begins with product manufacturing by global asset managers, domestic incumbents, and digital-native entrants, supported by research, portfolio management, and risk functions built around local market structures and investor needs. Around this core manufacturing layer sit key enablers such as index and ESG data providers, transfer agency and fund administration, custody, and increasingly sophisticated regulatory reporting and technology operations. MUFG Investor Services, for instance, supports back-office and middle-office requirements for fund platforms operating across multiple jurisdictions.
Distribution is the main scale lever and cost center. Banks remain central to retail reach, while online platforms and robo-advisory channels extend access and reduce onboarding friction. Cross-border distribution adds additional nodes, including feeder structures and passporting compliance workflows under ARFP and similar schemes, which in turn raises demand for legal, tax, and compliance specialists to manage host-economy requirements. Regulatory divergence across markets drives operational duplication through separate disclosures, product approvals, and reporting rhythms, benefiting firms that can centralize data, automate reporting, and integrate distributors through APIs and standardized connectivity.
Competitive Landscape
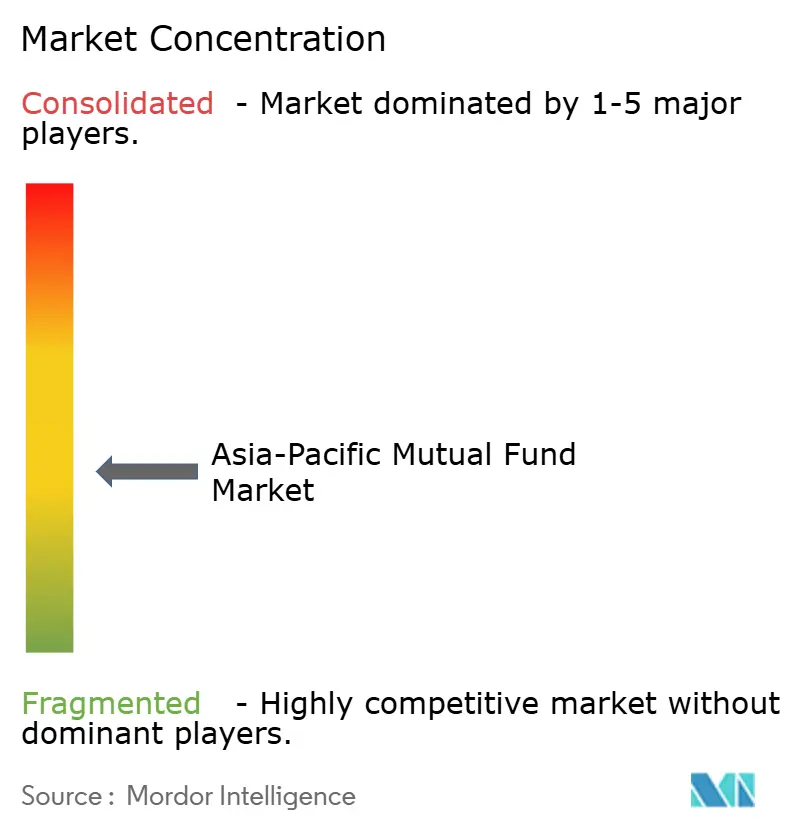
The Asia-Pacific mutual fund market is moderately fragmented, with several leading managers controlling a significant share of regional assets under management. This creates opportunities for both consolidation and niche market specialization. Market concentration varies widely across countries and product types, with domestic leaders like China Asset Management and HDFC Asset Management leveraging their deep local market insights and strong distribution networks. Meanwhile, global firms such as BlackRock and Fidelity International compete by offering sophisticated products and leveraging cross-border capabilities. The market dynamic is split, with larger managers benefiting from scale advantages in technology and regulatory compliance. At the same time, smaller, specialized firms succeed by focusing on targeted strategies and delivering exceptional client service. This dual structure shapes competitive positioning in the region.
Strategic trends highlight growing focus on digital transformation, integration of ESG principles, and expanding cross-border distribution as key areas for gaining competitive advantage. Joint ventures, like the partnership between Jio and BlackRock, illustrate how combining local market expertise with global asset management can quickly attract substantial investor interest. Technology adoption is increasingly critical, with asset managers investing in robo-advisory platforms, AI-driven portfolio construction, and blockchain initiatives aimed at improving operational efficiency and client experience. There are promising opportunities in specialized areas such as private credit, infrastructure investment, and ESG-focused cross-border strategies. These areas are often complicated by regulatory challenges but also offer the potential for premium pricing. Emerging fintech-enabled managers are disrupting the market by leveraging digital channels and cost-efficient models to challenge traditional players. Established managers are responding through strategic partnerships and increased technology investments to maintain competitiveness.
The regulatory environment across Asia-Pacific is becoming more demanding, favoring managers with strong compliance and operational resilience. Enhanced reporting requirements and tightened cybersecurity standards are shaping the competitive landscape. Firms with robust risk management frameworks and well-capitalized operations are better positioned to navigate these complexities. This regulatory rigor also raises barriers for new entrants but creates opportunities for those who can meet these standards efficiently. As a result, compliance capabilities are becoming a key differentiator in the market. Managers that successfully integrate technology with strong governance stand to gain a competitive edge. Overall, the interplay of regulation, innovation, and market structure will continue to influence the evolution of the Asia-Pacific mutual fund industry.
Asia-Pacific Mutual Fund Industry Leaders
China Asset Management (ChinaAMC)
Mitsubishi UFJ Asset Management
Nippon Life India Asset Management
Mirae Asset Global Investments
HDFC Asset Management
- *Disclaimer: Major Players sorted in no particular order

Market Opportunities and Future Outlook
Near-term opportunity is concentrating on faster product iteration and retail-accessible structures, especially where regulators are explicitly shortening authorization timelines. In Singapore, MAS announced changes in May 2026 to streamline elements of the Complex Products framework and enhance Product Highlights Sheets, followed by a July 2026 consultation (P014-2026) proposing amendments to the Code on Collective Investment Schemes. The proposals include a streamlined three-week authorization process for established fund types and added flexibility for retail product innovation. For fund houses and platforms, this shifts the opportunity toward markets where rulebooks and operating requirements support quicker launches and clearer investor-facing documentation.
Technology-enabled manufacturing and distribution is also gaining momentum, as firms operationalize AI and connectivity across the investment lifecycle. Industry signals point to sustained adoption, including Bloomberg profiling APAC buy-side firms reporting high AI usage and widespread API deployment, alongside SimCorp reporting a sharp step-up in front-office AI deployment in 2026. Managers can use this to differentiate through personalized portfolios and digital servicing, while ecosystem vendors can focus on data, compliance tooling, and workflow automation that reduces cost-to-serve for fast-growing online and cross-border channels.
Recent Industry Developments
- June 2026: China Asset Management (ChinaAMC) signed a strategic memorandum of understanding with KB Asset Management in Seoul to deepen cross-border cooperation. The agreement strengthens regional product collaboration and research connectivity at a time when managers are competing on access to differentiated exposures across Asia.
- July 2025: Jio BlackRock attracted INR 17,800 crore across three debt schemes and onboarded 67,000 retail and 90 institutional investors in its first subscription window. The scale of the debut underscored how large domestic ecosystems and simplified digital journeys can accelerate early AUM gathering for new entrants.
- May 2024: SEBI introduced the Specialized Investment Funds (SIFs) framework for accredited investors, setting provisions that became effective from April 1, 2025. This added a structured route for differentiated, higher-complexity strategies within the broader fund landscape and pushed managers to build product governance suited to segmented investor eligibility.


Research Methodology Framework and Report Scope
Market Definition and Coverage
We size the Asia Pacific mutual fund market as the total assets under management (AUM) held in open-end mutual funds across the region, reported in USD, including equity, fixed income, balanced, and money market funds.
Scope exclusions: We exclude ETFs, closed-end funds, hedge funds, and private fund vehicles, even if they are distributed through similar channels.
Segmentation Overview
- By Asset Class
- Equity
- Bond
- Hybrid
- Money Market
- Others
- By Investor Type
- Retail
- Institutional
- By Distribution Channel
- Banks
- Online Platforms
- Financial Advisors
- Direct
- By Geography
- India
- China
- Japan
- Australia
- South Korea
- South-East Asia
- Singapore
- Malaysia
- Thailand
- Indonesia
- Vietnam
- Philippines
- Rest of Asia-Pacific
Data Sources, Market Sizing, and Validation
Desk Research
Desk research starts with building a consistent AUM map by country, and then aligning it to how mutual funds are defined in local reporting. Public datasets and publications such as central bank and financial regulator statistics, national securities exchange publications, IMF and World Bank macro series, and OECD financial accounts are used to frame the investable asset pool and savings trends.
Next, we reviewed fund industry disclosures and investor reports from associations and regulators, along with annual reports and investor presentations of asset managers and distributors, to understand product mix changes and fee and flow patterns. For cross-checking fund counts, classifications, and product launches, we also referenced a paid company financials and intelligence subscription and a patent database for digital distribution and advisory signals. The sources listed here are illustrative, and other public documents and data tables were also reviewed to collect, validate, and clarify inputs.
Primary Interviews and Surveys
Primary work focused on testing AUM drivers country by country, including investor behavior, channel shifts, and product preferences that are not always visible in public series. We spoke with asset management leaders, distribution and platform teams, and senior fund operations and compliance managers across APAC, and then used their inputs to refine assumptions on net flows, allocation changes, and the pace of fee compression.
Distribution of primary research fieldwork respondents
| Company type | Respondent position |
|---|---|
| Top tier: 39% | CXOs: 13% |
| Mid tier: 47% | Functional/Unit leaders: 36% |
| Smaller Players: 14% | Managers: 51% |
Market-Sizing & Forecasting
Sizing is built from a top-down AUM reconstruction, where country level mutual fund assets are aligned to reported industry totals and then normalized into a single USD series for the region. To keep the totals realistic, we corroborate outputs with selective bottom-up checks, such as sampled AUM roll-ups from large fund houses, distributor channel checks, and sanity checks on average AUM per fund where fund counts are available.
Inputs used in the model include historical net flows, equity and bond market performance (which moves valuation), household financial savings rates, policy and tax incentives linked to retirement and mutual fund investing, and distribution digitization indicators that affect onboarding and stickiness. Where a country series has gaps or breaks in definitions, we bridge it using the closest regulator releases and then validate directionally with interview feedback before it is carried into the regional total.
For forecasting, scenario analysis is applied to separate valuation driven growth from flow driven growth, and then country scenarios are aggregated to the APAC view. Assumptions for market returns and net flows were stress-tested with primary respondents so the forecast remains consistent with practical expectations around risk appetite and product shifts.
Data Validation & Update Cycle
Validation is done through multiple checks that compare modeled AUM to independent signals like country level financial accounts, regulator snapshots, and publicly discussed flow trends, and then outliers are reviewed before final sign-off. When a variance is persistent, we re-check currency timing, definition changes (for example, whether money market funds are reported separately), and the treatment of cross-border domiciled funds.
Reports are refreshed annually, and interim updates are triggered if a material regulatory change, market drawdown, or large reporting revision shifts the demand picture. Before delivery, a final analyst review pass is completed so clients receive the latest version of numbers and assumptions.
Mordor Intelligence's Asia Pacific Mutual Fund Market Size Versus Other Published Estimates
Published market sizes for Asia Pacific mutual funds can differ even when the topic sounds the same, because the underlying measurement unit is not always consistent. Some sources report total AUM, while others quote broader asset management totals, and timing differences in market valuation can further widen the spread.
The main gap comes from scope mixing, where Mordor Intelligence counts only open-end mutual fund AUM in Asia Pacific and leaves out ETFs and adjacent asset management pools that are sometimes bundled into a single headline number. Differences also show up when estimates apply aggressive market return assumptions, use year-end FX conversion versus average-year FX, or rely on limited country coverage that underweights fast-growing Southeast Asian markets.
Benchmark comparison
| Source | Market Size | Gaps in Research Methodology |
|---|---|---|
| Mordor Intelligence | USD 58.14 T (2025) | |
| Global Advisory A | USD 29.60 T (2025) | Uses a wider asset and wealth management lens, which mixes mutual funds with other managed asset pools, so the headline is not limited to mutual fund AUM. |
| Industry Data Provider B | USD 9.40 T (2025) | Covers a narrower Asia fund dataset with different geography cutoffs and category definitions, which can exclude parts of APAC and undercount locally domiciled mutual funds. |
The comparison shows that the spread is largely explained by what is included in the AUM total, which countries are counted, and how valuation and currency timing are handled. By tying the estimate to repeatable country series, plus interview-led checks on flows and product mix, the final number stays transparent and easier to reconcile with public reporting.


Key Questions Answered in the Report
How large is the Asia-Pacific mutual fund market in 2026?
The Asia-Pacific mutual fund market size was USD 60.9 trillion in 2026 and is projected to grow steadily through 2031.
Which asset class attracts the most assets across the region?
Equity strategies lead with 44.32% share of total AUM, and ESG-oriented equity products are growing fastest at 11.25% CAGR.
What drives the acceleration of digital distribution?
Robo-advisory apps and online platforms lower minimum investment thresholds, cut fees, and simplify KYC, pushing online-channel CAGR to 12.78%.
Why is South-East Asia the fastest-growing geography?
Cross-border passporting under the ASEAN CIS, rapid middle-class expansion, and regulatory harmonization lift the region’s forecast CAGR to 10.05%.
How are regulators supporting retirement savings?
Tax-deductible pension schemes in China, Hong Kong, and Thailand encourage long-term fund holdings, deepening the pool of sticky assets for managers.
What competitive strategies stand out in 2025?
Scale players invest in tokenization and AI-driven advisory, while joint ventures like Jio BlackRock pair local distribution muscle with global product depth.
Page last updated on:





