Market Overview
| Study Period | 2020 - 2031 |
|---|---|
| Forecast Data Period | 2026 - 2031 |
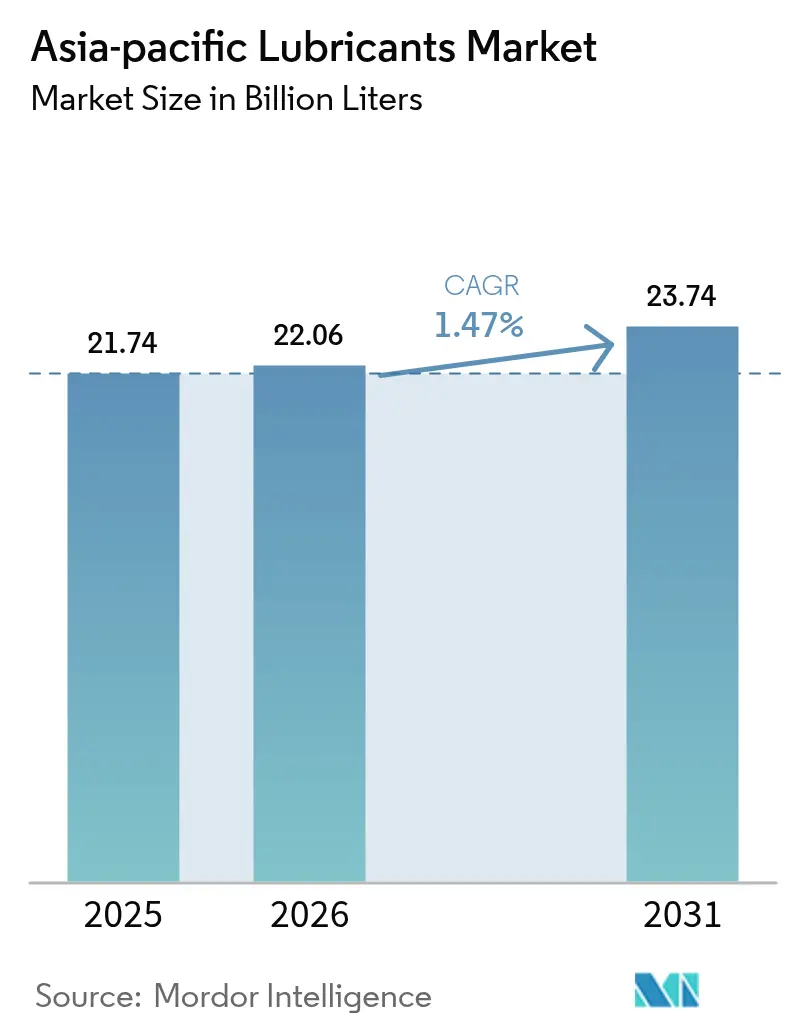
| Base Year Market Size (2025) | 21.74 Billion liters |
| Market Volume (2026) | 22.06 Billion liters |
| Market Volume (2031) | 23.74 Billion liters |
| Growth Rate (2026 - 2031) | 1.47% CAGR |
| Market Concentration | Medium |
Major Players *Disclaimer: Major Players sorted in no particular order Image © Mordor Intelligence. Reuse requires attribution under CC BY 4.0. | |
Asia-Pacific Lubricants Market Analysis by Mordor Intelligence
The Asia-Pacific Lubricants Market size was valued at 21.74 billion liters in 2025 and estimated to grow from 22.06 billion liters in 2026 to reach 23.74 billion liters by 2031, at a CAGR of 1.47% during the forecast period (2026-2031). Rising industrial automation, expanding infrastructure programs, and incremental growth in off-highway equipment continue to drive volume expansion, even as passenger-car electrification pressures traditional applications. Original equipment manufacturers (OEMs) are tightening lubricant specifications to meet China VI-b and India CAFÉ III fuel-efficiency norms, which accelerates the switch to low-viscosity synthetic formulations. Supply chains adjust to persistent Group II/III base-oil price swings by localizing blending and boosting inventory buffers. While mineral oils remain cost-effective for the region’s price-sensitive users, synthetic and bio-based lines capture premium niches in the marine, power generation, and high-temperature manufacturing sectors. Competitive activity centers on capacity additions in India, Indonesia, and Thailand, where demand visibility is strongest and import substitution policies favor domestic blending.
Key Report Takeaways
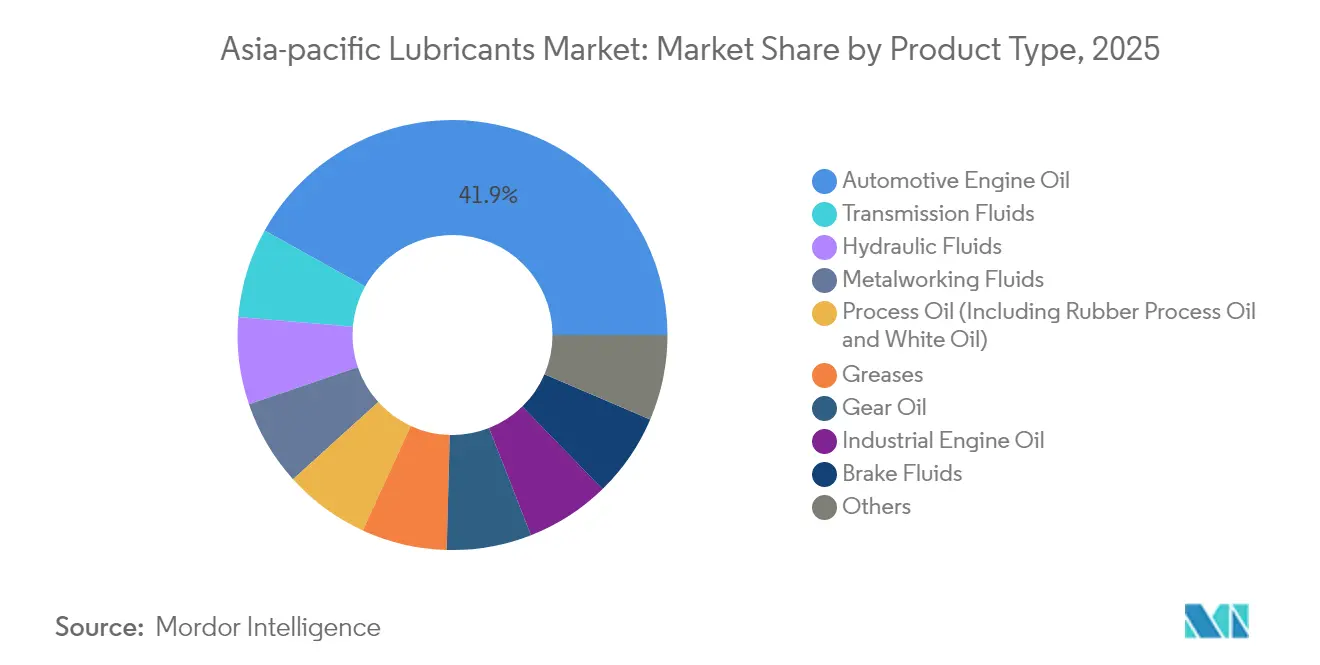
- By product type, automotive engine oil led with 41.92% volume share in 2025, and transmission fluids are projected to expand at a 1.98% CAGR through 2031.
- By end-user industry, the automotive sector accounted for a 54.12% share in 2025, while industrial lubricants are poised to grow at a 1.83% CAGR through 2031.
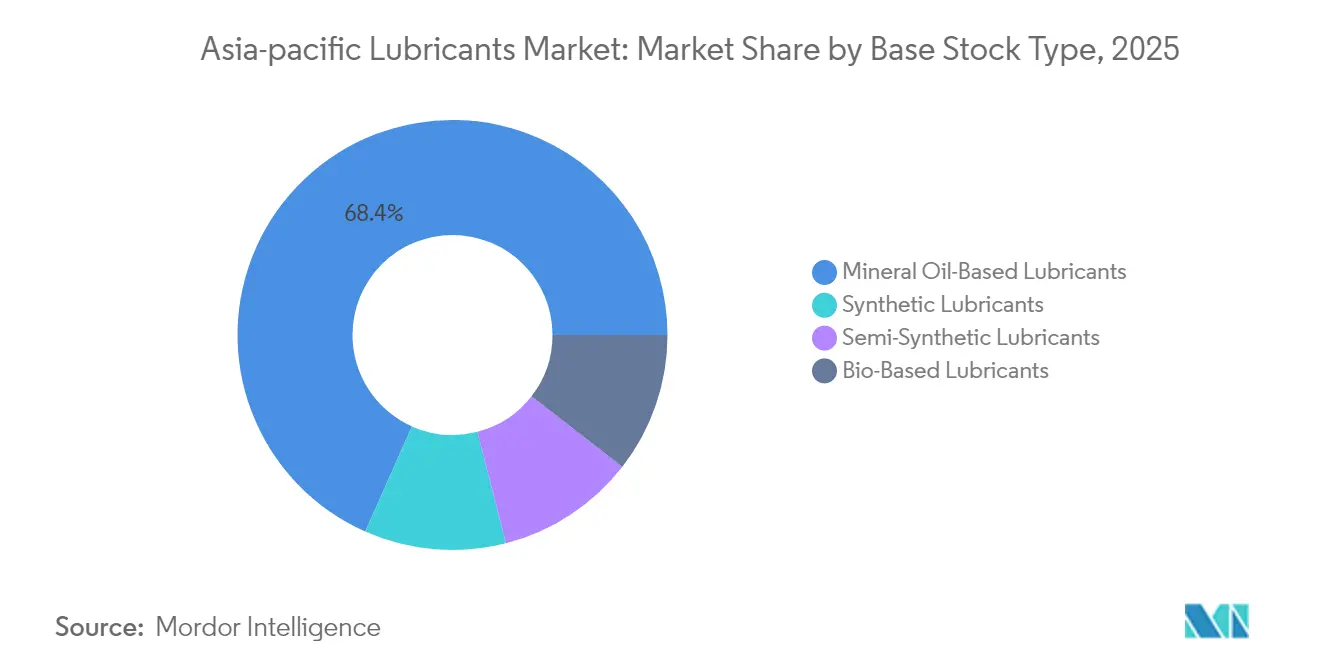
- By base stock, mineral oil-based formulations captured 68.35% share in 2025, and synthetic lubricants are set to rise at a 1.65% CAGR over the forecast period.
- By geography, China commanded 34.88% of the 2025 volume, whereas India is expected to advance at a 3.02% CAGR between 2026 and 2031.
Note: Market size and forecast figures in this report are generated using Mordor Intelligence’s proprietary estimation framework, updated with the latest available data and insights as of 2026.
Asia-Pacific Lubricants Market Trends and Insights
Drivers Impact Analysis*
| Drivers | (~) % Impact on CAGR Forecast | Geographic Relevance | Impact Timeline |
|---|---|---|---|
| Electrification-resistant lubricant demand in off-highway fleets | +0.4% | China, India, Indonesia core markets | Medium term (2-4 years) |
| Surge in OEM factory-fill contracts across ASEAN | +0.3% | ASEAN markets, spillover to broader APAC | Short term (≤ 2 years) |
| Stricter APAC fuel-efficiency norms (China VI-b, India CAFÉ III) | +0.2% | China, India primary, regulatory spillover to SEA | Long term (≥ 4 years) |
| Rapid build-out of inland logistics corridors in India and Indonesia | +0.1% | India, Indonesia national infrastructure zones | Medium term (2-4 years) |
| In-process fluid analytics enabling condition-based refill cycles | +0.15% | Industrial hubs across APAC, early adoption in Japan, South Korea | Long term (≥ 4 years) |
| Regional push for biodegradable base stocks in sensitive ecosystems | +0.2% | Marine corridors, environmentally sensitive industrial zones | Long term (≥ 4 years) |
| Source: Mordor Intelligence | |||
Electrification-Resistant Demand in Off-Highway Applications
Construction, mining, and agricultural machines continue relying on high-performance hydraulic fluids and gear oils because electric drivetrains cannot yet match the required power density. Remote Indonesian mining sites and India’s large road-building projects depend on equipment that consumes greater lubricant volumes per unit than passenger cars. Heavy-duty drain intervals remain short due to abrasive environments, sustaining repeat purchases. SK Enmove leverages its expertise in electric-vehicle (EV) cooling fluids to formulate premium off-highway synthetics, thereby strengthening its regional position. Extended equipment life cycles and limited electrification risk yield predictable demand that cushions the Asia-Pacific Lubricants Market against passenger-car headwinds.
Surge in OEM Factory-Fill Contracts Across ASEAN
Automakers are increasingly signing multi-year factory-fill agreements to ensure warranty compliance and reduce inventory costs. Thai and Malaysian assembly plants prefer single-sourced blends that streamline quality audits and simplify service training. PETRONAS Lubricants International launched mid-tier formulations targeting these contracts, helping OEMs maintain cost discipline while meeting higher performance thresholds[1]PETRONAS Lubricants International, “PETRONAS Nexta enables Thai consumers to choose smart,” pli-petronas.com. Such agreements lock in steady volumes for suppliers, give OEMs consistent after-sales messaging, and reinforce local-content rules that ASEAN governments prioritize. The pattern expands to Vietnam and the Philippines as new auto plants come online, reinforcing regional volumes for the Asia-Pacific Lubricants Market.
Stricter APAC Fuel-Efficiency Norms Drive Low-Viscosity Adoption
China VI-b limits and India CAFÉ III rules oblige OEMs to deliver tangible fuel-economy gains, which cascade through the lubricant value chain. Engine builders now require 0W-20 and 5W-30 grades that reduce hydrodynamic friction. TotalEnergies rolled out API SQ and ILSAC GF-7 compliant oils across 40 Asia-Pacific countries, claiming double-digit fuel-economy improvements compared to legacy 10W-30 blends. Producers with broad additive expertise tend to win approvals faster, enabling them to secure price premiums and longer contracts. Lower viscosities also reduce cold-start wear, appealing to consumers in northern China, Japan, and high-altitude India. Consequently, low-viscosity synthetics are gaining market share in the Asia-Pacific Lubricants Market.
Rapid Infrastructure Development Fuels Commercial Vehicle Demand
India’s National Infrastructure Pipeline and Indonesia’s new capital project generate freight corridors that require robust diesel engine oils and axle fluids. Heavy-duty vehicles in these programs often exceed 100,000 km annually, compelling fleets to adopt longer-drain synthetics to limit downtime. ExxonMobil expanded Indonesian blending capacity to meet this need. Construction equipment lubricants also benefit, as contractors often favor extended drain intervals for remote sites. While passenger-car growth slows, commercial transport and construction offset the shortfall, keeping the Asia-Pacific Lubricants Market on an upward trajectory.
Restraints Impact Analysis*
| Restraints | (~) % Impact on CAGR Forecast | Geographic Relevance | Impact Timeline |
|---|---|---|---|
| Shrinking lubricant drain intervals in ICE passenger cars | -0.2% | Mature APAC markets, urban centers | Short term (≤ 2 years) |
| Volatile Group II/III base-oil import prices from Middle East | -0.15% | Import-dependent markets across APAC | Short term (≤ 2 years) |
| Government subsidies tilting toward EV power-train makers | -0.1% | China, South Korea, selective SEA markets | Medium term (2-4 years) |
| OEM-endorsed lifetime-fill transmissions in premium vehicles | -0.05% | Premium vehicle segments, developed APAC markets | Long term (≥ 4 years) |
| Source: Mordor Intelligence | |||
Shrinking Drain Intervals Compress Volume Consumption
Turbocharged gasoline direct-injection engines now run cleaner and hotter, allowing for 10,000-mile service schedules that halve the frequency of lubricant changes compared to legacy designs. Japanese OEMs standardize 0W-20 oils with higher base-number retention, further extending urban service intervals. The SAE GLV-2 specification underpins these extended drains and has been rapidly adopted across ASEAN assembly lines[2]SAE International, “The Development of JASO GLV-2,” sae.org. While synthetic producers gain market share, total liters per vehicle decline, resulting in a reduction in passenger-car volumes within the Asia-Pacific Lubricants Market.
Base Oil Price Volatility Pressures Margin Stability
Middle-East refinery outages and geopolitical tensions swing Group III spreads by double digits each quarter. Korean refiners saw 500-neutral spreads contract in 2024, eroding blender margins. Smaller Indonesian mixers cannot hedge feedstock costs and often absorb short-term losses to honor fixed-price contracts. Price swings delay long-term supply agreements and increase working capital requirements, creating headwinds for the Asia-Pacific Lubricants Market.
*Our forecasts treat driver/restraint impacts as directional, not additive. The impact forecasts reflect baseline growth, mix effects, and variable interactions.
Segment Analysis
By Product Type: Engine Oils Dominate While Transmission Fluids Accelerate
Engine oil held 41.92% of the Asia-Pacific Lubricants Market share in 2025, underscoring its pivotal role in the region’s large internal-combustion fleet. Despite electrification, two-wheelers and used cars continue to drive robust engine oil volumes, particularly in India, Indonesia, and Vietnam. The segment’s premium tier skews toward synthetics as OEMs demand 0W-20 and lower grades to hit fleet targets. Lower drain intervals in heavy-duty diesel units partly offset the reductions in passenger-car units, maintaining baseline volumes for engine oil suppliers. In contrast, transmission fluids are projected to grow at a 1.98% CAGR to 2031, the fastest among product categories, driven by the uptake of automatic and continuously variable transmissions (CVTs). Many ASEAN consumers are shifting from manual gearboxes as road congestion rises, which is boosting per-vehicle lubricant demand because ATF fill volumes exceed those of manual gear oils. Longer transmission warranties, however, keep suppliers focused on high-thermal-stability fluids that lengthen service intervals.
Second-tier product lines show varied momentum. Gear oils benefit from tailwinds generated by mining expansions in Australia and Indonesia, where extreme loads necessitate high-viscosity formulations with micronized molybdenum. Hydraulic fluids benefit from the proliferation of construction equipment and factory automation, especially where robotics replace manual assembly. Process oils advance at a steadier pace thanks to the growth of the tire and textile industries in India and China. Metalworking fluids ride the manufacturing upswing but face efficiency gains in cutting technology that lower per-part consumption. Turbine and transformer oils track power-generation capacity additions, with new gas-turbine plants in Vietnam and the Philippines adopting premium synthetic esters that withstand higher inlet temperatures.


By End-User Industry: Automotive Leadership Faces Industrial Challenge
Automotive applications accounted for 54.12% of the Asia-Pacific Lubricants Market size in 2025, driven by the vast two-wheeler fleets and rising demand for personal mobility. Yet the segment’s growth moderates as BEV adoption accelerates in China and subsidy programs proliferate in Thailand. OEM dealership consolidation and improved engine durability also mean fewer oil changes per vehicle. Industrial end-users, meanwhile, are predicted to log a 1.83% CAGR through 2031, narrowing the automotive lead. Power generation, steel, and non-ferrous metallurgy projects consume large volumes of lubricants, particularly high-temperature synthetics that warrant premium pricing. Condition-based maintenance tools enhance factory uptime and create data-driven resupply contracts that bind customers for multiple years, improving demand visibility.
Marine lubricants are gaining traction due to the growth in intra-Asia shipping and the increasing requirements for low-sulfur fuel compatibility in fleet modernization. Aerospace remains a specialized yet steady sector; regional airlines favor approved turbine oils with extended drain properties, which lower ground-time costs. Heavy equipment lubricants mirror the construction cycle but are insulated from passenger-car electrification due to their long machinery life cycles and harsh duty environments. The textile sector sustains demand for spindle oils, while upstream oil and gas projects in Malaysia and Brunei require drilling fluids that withstand high-pressure, high-temperature wells. The digitalization of industrial procurement opens e-commerce avenues, bringing small and medium-sized factories into direct supplier networks and expanding the addressable base for the Asia-Pacific Lubricants Market.
By Base Stock Type: Mineral Oils Persist as Synthetics Gain Ground
Mineral oils accounted for 68.35% of the 2025 volume, as cost sensitivity dominates purchase decisions for taxis, two-wheelers, and small factories. Local blenders source regional Group I and imported Group II streams to maintain competitive prices. At the same time, synthetics are forecasted to grow at a 1.65% CAGR, leveraging OEM mandates and offering lower total-cost-of-ownership value propositions. Group III production capacity in South Korea and China keeps synthetic price premiums narrower than in North America, aiding penetration. Bio-based lubricants draw heightened interest from port authorities and hydropower operators seeking biodegradable options to minimize spill liabilities. Semi-synthetics fill a value gap, allowing fleet operators to extend drains without paying full synthetic premiums, especially in India’s mid-tier trucking firms.
Regulatory pressures intensify the synthetic shift. The Asia-Pacific Lubricants Market size for synthetics in passenger cars is expected to rise sharply once ILSAC GF-7 becomes ubiquitous, as it requires high-temperature, high-shear viscosities that are unattainable with basic mineral oils. Thermal-oxidation demands in increasingly hotter gas turbines also drive the growth of synthetic turbine oil. Lubricant makers diversify their base-oil sourcing to buffer against Middle East price volatility, adding Southeast Asian Group III plant output and experimenting with esters derived from palm and coconut feedstocks.
Geography Analysis
China supplied 34.88% of the 2025 volume, reflecting a significant stock of vehicles and industrial machinery. Its domestic Group III self-sufficiency dampens exposure to imported base-oil swings, while strong export linkages push finished-product volumes into Southeast Asia. Rising environmental standards and domestic OEM technology upgrades are shifting the product mix toward synthetics more rapidly than in other subregions. India, although smaller today, is poised for a 3.02% CAGR to 2031, the highest among major economies, as freight corridors, data center construction, and continued two-wheeler dominance drive volumes. The Asia-Pacific Lubricants Market benefits directly from ExxonMobil’s facility in Maharashtra, which is scheduled to go online in 2025, adding a premium-grade supply and deepening local content.
Japan and South Korea show modest volume decline yet deliver high margins through specialty synthetics and grease lines. South Korean refiners, such as SK Enmove and GS Caltex, regularly report that their lubricant divisions contribute a disproportionate share of corporate profit. Indonesia and Thailand occupy the middle tier, where automotive production hubs and resource extraction ensure baseline demand, and governments promote local blending for economic development. Malaysia’s palm-oil industry positions it to scale bio-based base-stocks, while Vietnam and the Philippines open industrial zones that require a reliable supply but still depend on imports for premium products.
Competitive Landscape
The market is moderately fragmented, allowing regional blenders to compete through cost and distribution advantages. Global majors, regional refiners, and hundreds of national blenders compete for volume in a market that still relies on mineral oils but prizes technological upgrades. Regional champions exploit cost and channel intimacy. White-space innovation focuses on nano-additive tribology, biodegradable esters, and cloud-based condition monitoring. Patent filings from Japan and South Korea indicate an uptick in molybdenum-disulfide dispersion and boron ester chemistry. Smaller firms in Thailand partner with local universities to develop rubber-processing oils from used cooking oil feedstocks. As volume growth plateaus, differentiation shifts from liters sold to performance per liter, raising barriers to entry and moderating price competition in the premium segments of the Asia-Pacific Lubricants Market.
Asia-Pacific Lubricants Industry Leaders
Shell plc
Sinopec (China Petrochemical Corporation)
ExxonMobil Corporation
BP plc (Castrol)
ENEOS Holdings
- *Disclaimer: Major Players sorted in no particular order

Recent Industry Developments
- June 2025: BP plc (Castrol) launched the divestment of its Castrol unit, valued near USD 10 billion, under a broader USD 20 billion asset-sale program aimed at funding upstream projects.
- January 2025: Indian Oil Corporation began trial runs at its 672 TMTPA Manali lube complex, targeting the production of eco-friendly greases, brake fluids, and diesel exhaust fluid.


Asia-Pacific Lubricants Market Report Scope
By Product Type
| Automotive Engine Oil |
| Industrial Engine Oil |
| Transmission Fluids |
| Gear Oil |
| Brake Fluids |
| Hydraulic Fluids |
| Greases |
| Process Oil (Including Rubber Process Oil and White Oil) |
| Metalworking Fluids |
| Turbine Oil |
| Transformer Oil |
| Other Product Types |
By End-user Industry
| Automotive | Passenger Vehicles |
| Commercial Vehicles | |
| Two-Wheelers | |
| Marine | |
| Aerospace | |
| Heavy Equipment | Construction |
| Mining | |
| Agriculture | |
| Industrial | Power Generation |
| Metallurgy and Metalworking | |
| Textiles | |
| Oil and Gas | |
| Other End-Use Industries |
By Base Stock Type
| Mineral Oil-Based Lubricants |
| Synthetic Lubricants |
| Semi-Synthetic Lubricants |
| Bio-Based Lubricants |
By Geography
| China |
| India |
| Japan |
| South Korea |
| Indonesia |
| Thailand |
| Malaysia |
| Vietnam |
| Philippines |
| Rest of Asia-Pacific |
| By Product Type | Automotive Engine Oil | |
| Industrial Engine Oil | ||
| Transmission Fluids | ||
| Gear Oil | ||
| Brake Fluids | ||
| Hydraulic Fluids | ||
| Greases | ||
| Process Oil (Including Rubber Process Oil and White Oil) | ||
| Metalworking Fluids | ||
| Turbine Oil | ||
| Transformer Oil | ||
| Other Product Types | ||
| By End-user Industry | Automotive | Passenger Vehicles |
| Commercial Vehicles | ||
| Two-Wheelers | ||
| Marine | ||
| Aerospace | ||
| Heavy Equipment | Construction | |
| Mining | ||
| Agriculture | ||
| Industrial | Power Generation | |
| Metallurgy and Metalworking | ||
| Textiles | ||
| Oil and Gas | ||
| Other End-Use Industries | ||
| By Base Stock Type | Mineral Oil-Based Lubricants | |
| Synthetic Lubricants | ||
| Semi-Synthetic Lubricants | ||
| Bio-Based Lubricants | ||
| By Geography | China | |
| India | ||
| Japan | ||
| South Korea | ||
| Indonesia | ||
| Thailand | ||
| Malaysia | ||
| Vietnam | ||
| Philippines | ||
| Rest of Asia-Pacific | ||


Key Questions Answered in the Report
What is the 2026 volume outlook for the Asia-Pacific Lubricants Market?
The market is projected at 22.06 billion liters for 2026, supported by industrial and off-highway demand that offsets softer passenger-car volumes.
Which country is expanding lubricant demand the fastest?
India is expected to post a 3.02% CAGR through 2031, driven by infrastructure projects and a growing commercial-vehicle fleet.
How are fuel-efficiency regulations influencing lubricant formulations?
China VI-b and India CAFÉ III standards push OEMs toward low-viscosity synthetics such as 0W-20 and 5W-30, accelerating the synthetic share in overall demand.
Why are off-highway applications important to suppliers?
Construction, mining, and agricultural equipment require high-performance fluids and resist electrification, providing stable, high-volume outlets even as car electrification rises.
Are biodegradable lubricants a sizeable opportunity?
While still niche, stricter environmental rules in ports and hydropower sites are creating premium demand pockets for biodegradable esters with strong growth potential.
How concentrated is supplier power in the region?
The market is moderately fragmented, allowing regional blenders to compete through cost and distribution advantages.
Page last updated on:


