Asia Pacific Indoor LED Lighting Market Size and Share
Market Overview
| Study Period | 2020 - 2031 |
|---|---|
| Forecast Data Period | 2026 - 2031 |
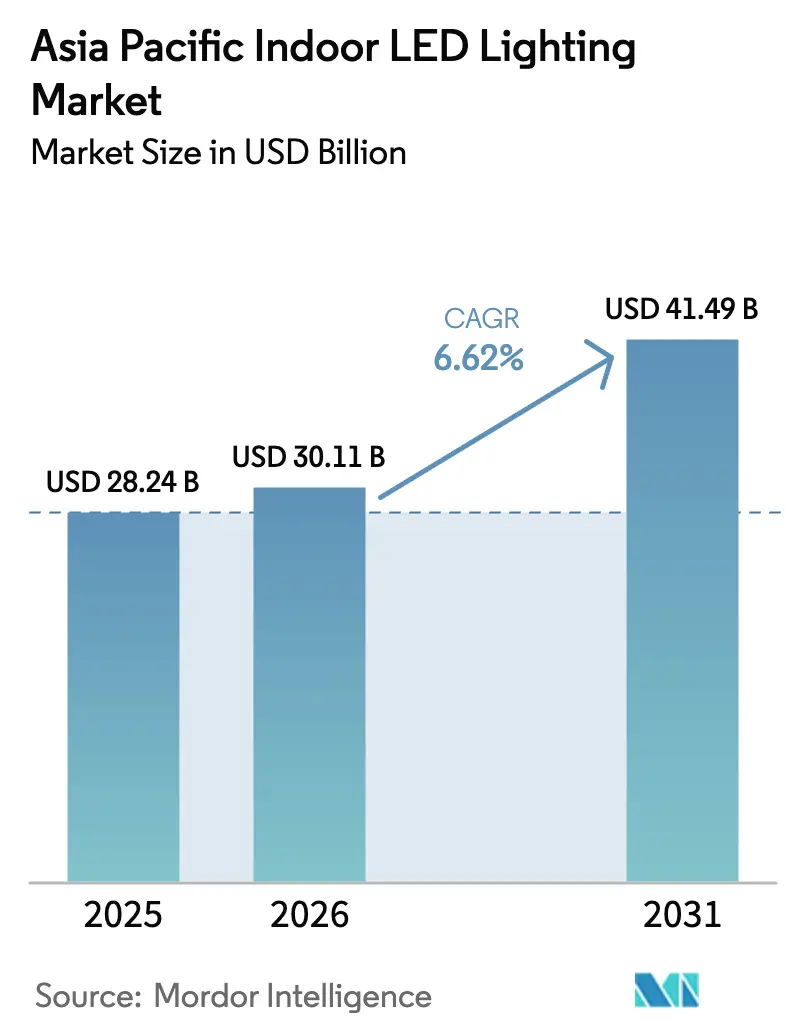
| Base Year Market Size (2025) | USD 28.24 Billion |
| Market Size (2026) | USD 30.11 Billion |
| Market Size (2031) | USD 41.49 Billion |
| Growth Rate (2026 - 2031) | 6.62% CAGR |
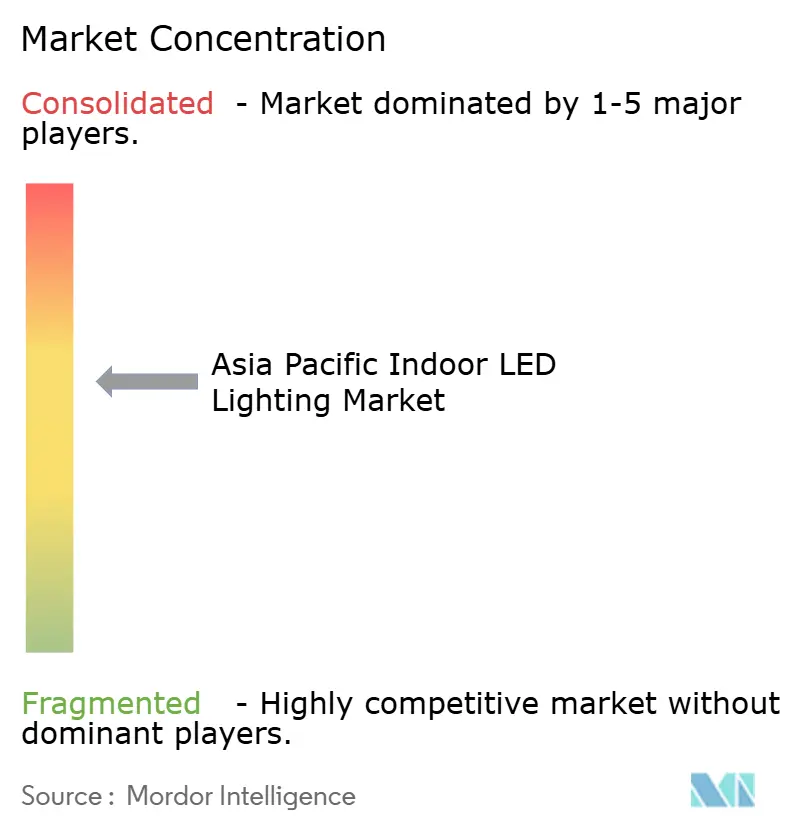
| Market Concentration | Medium |
Major Players *Disclaimer: Major Players sorted in no particular order Image © Mordor Intelligence. Reuse requires attribution under CC BY 4.0. | |
Asia Pacific Indoor LED Lighting Market Analysis by Mordor Intelligence
The Asia Pacific indoor LED lighting market size was valued at USD 28.24 billion in 2025 and estimated to grow from USD 30.11 billion in 2026 to reach USD 41.49 billion by 2031, at a CAGR of 6.62% during the forecast period (2026-2031). Mandatory efficiency codes, large-scale retrofit programs, and rapid price erosion in high-brightness chips are steering users away from legacy sources. China’s manufacturing scale provides it with decisive cost advantages, while India’s electrification push is generating a new demand curve. Smart-building mandates in tier-1 cities and the rise of direct-current micro-grids are opening premium niches for tunable and IoT-ready luminaires, tempering the margin squeeze created by price-led commoditization. Supply constraints in GaN-on-Si wafers remain the chief wild card for near-term pricing volatility.[1] International Energy Agency, “Building Energy Efficiency Policies in Emerging Asia,” iea.org
Key Report Takeaways
- By product type, luminaires commanded a 62.45% revenue share of the Asia Pacific indoor LED lighting market in 2025, while lamps posted the fastest 9.12% CAGR from 2026 to 2031.
- By application, the residential segment held a 42.55% share in 2025 and is projected to expand at a 10.38% CAGR through 2031.
- By installation type, retrofit projects accounted for 76.45% of the Asia Pacific indoor LED lighting market size in 2025, whereas new construction is projected to register a 7.94% CAGR from 2026 to 2031.
- By distribution channel, wholesale retained a 55.10% share in 2025, while e-commerce platforms are forecast to grow at a 7.55% CAGR to 2031.
- By geography, China led the Asia Pacific indoor LED lighting market with a 35.25% share in 2025, while India is expected to post the highest CAGR of 9.21% from 2026 to 2031.
Note: Market size and forecast figures in this report are generated using Mordor Intelligence’s proprietary estimation framework, updated with the latest available data and insights as of 2026.
Asia Pacific Indoor LED Lighting Market Trends and Insights
Drivers Impact Analysis*
| Driver | (~) % Impact on CAGR Forecast | Geographic Relevance | Impact Timeline |
|---|---|---|---|
| Rapid decline in high-brightness LED component costs | +1.8% | China and India manufacturing hubs | Short term (≤ 2 years) |
| Mandatory energy-efficiency regulations for new commercial buildings | +1.2% | China, India, Japan, South Korea, Singapore | Medium term (2-4 years) |
| Large-scale government retrofit incentive programs | +1.5% | China and India, spillover to ASEAN | Short term (≤ 2 years) |
| Smart-building mandates in tier-1 Asian cities | +0.9% | Singapore, Tokyo, Seoul, Hong Kong, Shanghai, Mumbai | Medium term (2-4 years) |
| Retail chain-driven demand for human-centric lighting | +0.7% | Core APAC markets, expanding to Southeast Asia | Medium term (2-4 years) |
| On-premise micro-power grids accelerating DC indoor lighting | +0.4% | Japan, South Korea, pilot sites in China and Singapore | Long term (≥ 4 years) |
| Source: Mordor Intelligence | |||


Rapid Decline in High-Brightness LED Component Costs
Continuous advances in chip architecture have enabled efficacy levels above 170 lm/W, allowing fixture makers to reduce the mass of heat sinks and optical plastics. This shift trims bill-of-materials costs and improves unit economics, particularly for cost-sensitive residential buyers. The deflationary stream widens addressable demand in emerging ASEAN economies, yet wafer shortages pose a short-term risk to price stability. Manufacturers are therefore pivoting to smart features to lift margins as pure component pricing continues to slide.[2]Nichia Corporation, “Ultra-thin Luminaire Reference Designs,” nichia.co.jp
Mandatory Energy-Efficiency Regulations for New Commercial Buildings
Revised codes such as China’s GB 50034-2024 and India’s 2024 Energy Conservation Building Code ban inefficient lamps in new floor space, effectively locking in LED demand at the design stage. Regulators are also moving from lumens-per-watt metrics toward connected-load and demand-response criteria, catalyzing uptake of sensor-rich luminaires. Compliance certainty enables suppliers to make forward investments in capacity, knowing that non-conforming products will be excluded from tender lists.
Large-Scale Government Retrofit Incentive Programs
Bulk procurement schemes under China’s Green Lighting Project and India’s UJALA 2.0 are releasing multi-million-unit tenders that compress pricing but secure predictable volumes for tier-one vendors. These umbrellas often stipulate smart-ready drivers, nudging the market toward control-capable form factors. Subsidy-induced adoption is spilling over into unsubsidized channels as users observe utility savings, creating a follow-on demand wave even after fiscal budgets taper.
Smart-Building Mandates in Tier-1 Asian Cities
City-level ordinances in Singapore, Tokyo, Seoul, and Shanghai now require lighting systems that integrate with building management software and support occupancy analytics. Developers prefer single-vendor ecosystems that guarantee protocol interoperability, driving consolidation toward brands with proven Matter or Zigbee stacks. This urban concentration yields flagship installations that manufacturers later replicate across second-tier cities, accelerating diffusion of premium controls.
Restraints Impact Analysis*
| Restraint | (~) % Impact on CAGR Forecast | Geographic Relevance | Impact Timeline |
|---|---|---|---|
| High capex for tunable white and IoT-ready luminaires | -0.8% | ASEAN price-sensitive markets | Short term (≤ 2 years) |
| Price-led commoditization squeezing OEM margins | -1.1% | China supply base and regional peers | Medium term (2-4 years) |
| Delayed BIS and CCC safety approvals for new SKUs | -0.6% | India and China | Short term (≤ 2 years) |
| Shortage of GaN-on-Si native epi-wafers | -0.9% | Japan and South Korea fabs | Medium term (2-4 years) |
| Source: Mordor Intelligence | |||
High Capex for Tunable White and IoT-Ready Luminaires
Premium fixtures bundle multi-channel drivers and wireless chips that inflate upfront costs, a hurdle for small offices and mass-housing developers operating on thin capex budgets. Subsidized power tariffs in parts of Indonesia and Vietnam further dilute the payback case, delaying upgrades. Financing mechanisms, such as energy-service contracts, are slowly closing this gap; yet, adoption remains skewed toward corporates that monetize the worker-wellbeing dividend.
Price-Led Commoditization Squeezing OEM Margins
As generalized luminaires approach commodity status, spot prices fall faster than input costs, pressuring mid-tier packagers. Some, like Everlight, have begun reallocating capital toward SiC devices and photonics to protect profitability. Margin erosion accelerates factory consolidation in China’s Pearl River Delta, and may dampen long-run innovation unless suppliers successfully pivot to value-added niches.
*Our forecasts treat driver/restraint impacts as directional, not additive. The impact forecasts reflect baseline growth, mix effects, and variable interactions.
Segment Analysis
By Product Type: Luminaires Lead Despite Lamps Growth
Luminaires generated 62.45% of the Asia Pacific indoor LED lighting market revenue in 2025, driven by integrated optics and slim profiles that new builds demand. Concurrently, lamps are expanding at a 9.12% CAGR, serving the huge retrofit pool of legacy sockets still scattered across the region. The luminaires cohort benefits from two-in-one tunable chips that eliminate secondary phosphor arrays, allowing for ultra-thin panels in premium offices. Retrofit lamps, however, remain the most cost-effective route to efficiency gains, particularly for landlords who avoid fixture swaps. Over time, as new construction outpaces legacy stock, luminaires are positioned to capture incremental market share, especially in DC micro-grid projects where form factors differ from those of AC sockets. Manufacturers thus run dual roadmaps: one for commoditized lamps to drive volume, and another for feature-rich fixtures to support design-build contracts.
Price volatility in aluminum and polycarbonate resins is currently offset by the declining cost curve of diodes, stabilizing the bill of materials for both categories. Yet the value narrative favors luminaires because embedded sensors and wireless nodes can unlock analytics revenues long after installation. Expect cross-licensing between chip vendors and fixture brands to accelerate as smart-ready designs become table stakes across the Asia Pacific indoor LED lighting market.


By Application: Residential Dominance Accelerates
Residential buyers contributed 42.55% of the 2025 turnover and are forecasted to lead growth at a 10.38% CAGR, driven by rapid household electrification and rising smart-home device penetration. Compact apartments in Shanghai or Mumbai favor down-lights and strip lights that pair with voice assistants, generating steady demand for Wi-Fi modules embedded at the board level. Commercial offices remain the second-largest slice, where human-centric lighting is tied to productivity KPIs in corporate ESG scorecards. Retail chains are next, shifting to tunable whites that adapt color temperature to merchandise displays.
Healthcare and education follow, adopting circadian-friendly spectra to improve patient recovery and student alertness. Industrial spaces adopt ruggedized high bays that withstand humidity and dust, though their share is smaller in the overall Asia Pacific indoor LED lighting market size. The common thread across segments is the move toward connected luminaires, a dynamic that tilts the sales mix toward control-centric SKUs.
By Installation Type: Retrofit Leads, New Construction Gains
Retrofit projects accounted for 76.45% of 2025 unit shipments, underscoring the continued dominance of energy bill savings as the primary purchase motive for quick wins. New construction is rising at a faster rate of 7.94% CAGR as green codes proliferate across Southeast Asian capitals. Developers prefer purpose-built fixtures that integrate with HVAC and access-control dashboards, making LEDs a design-phase decision rather than an afterthought.
Bulk retrofit programs continue to roll out in government offices and street-facing retail, keeping lamp demand buoyant. Yet, every skyscraper topping out in Manila or Jakarta installs addressable luminaires natively, gradually shifting the volume mix. Suppliers therefore hedge by offering socket-compatible lamps for retrofits while seeding specifiers with BIM files for new builds, ensuring brand lock-in through the project lifecycle and sustaining relevance across the Asia Pacific indoor LED lighting market.

By Distribution Channel: Wholesale Dominance Faces E-Commerce Challenge
Wholesale held 55.10% of 2025 sales thanks to entrenched contractor relationships and credit lines that shorten project cycles. Direct sales teams chase marquee smart-campus projects, bundling commissioning and lifecycle service contracts. E-commerce, growing at a 7.55% CAGR, is eating into the tail-end of SKUs, such as replacement lamps and small fixtures. Younger facility managers often shortlist products online before ordering through local installers, creating an omnichannel handshake.
The blurring of channels forces brands to harmonize pricing to prevent gray-market arbitrage. It also accelerates content marketing, as spec sheets and photometric files become table stakes on digital shelves. Loyalty programs targeting electricians are shifting online, utilizing mobile apps to track points with every scan of a QR-coded carton. Those hybrid touchpoints will decide the future share of voice across the Asia Pacific indoor LED lighting market.
Geography Analysis
China controlled 35.25% of 2025 turnover, buoyed by vertically integrated fabs and consistent state support for green retrofits. Domestic fixture brands utilize provincial subsidies to maintain price floors, even as they court export buyers in the Middle East and Latin America. India, expanding at a 9.21% CAGR, is driven by mass-housing initiatives and distribution programs that reduce upfront costs for rural households. Local content rules are stimulating assembly plants across Gujarat and Uttar Pradesh, pushing regional supply diversification within the Asia Pacific indoor LED lighting market.
Japan and South Korea remain technology bellwethers, with users paying premiums for tunability and circadian metrics. Both countries tie lighting upgrades to carbon-neutral pledges, driving early adoption of DC grids in commercial towers. ASEAN markets, particularly Indonesia, Vietnam, and the Philippines, are entering a construction supercycle that aligns with the tightening of building codes. The International Energy Agency projects that electricity demand in Southeast Asia will surpass 2,000 TWh by 2035, with buildings accounting for a sizable share, thereby creating opportunities for efficient luminaires.
Australia and New Zealand offer smaller but profitable islands of demand, where labor costs prompt decision-makers to opt for longer-life luminaires to reduce maintenance. Elsewhere, frontier markets such as Sri Lanka and Bangladesh are testing pay-as-you-save financing to unlock adoption. Overall, the geographic mosaic presents a dual-track scenario: mature economies require sophisticated controls, while emerging markets pursue first-time efficiency gains, thereby expanding the Asia Pacific indoor LED lighting market.
Competitive Landscape
The competitive arena is moderately concentrated, with the top five vendors accounting for roughly 45% of shipments. Nichia, Samsung, and LG supply cutting-edge chips, while Chinese brands like FSL and Opple command volume through cost leadership. Taiwanese player Everlight is exiting commodity packages to focus on SiC and photonics, underscoring the profitability squeeze in generic LEDs. Meanwhile, ecosystem alliances around the Matter protocol are reshaping differentiation; vendors that guarantee seamless smart-home integration gain preference in urban projects.
Strategic pivots center on tunable white and human-centric lighting, where higher ASPs can offset wafer price declines. Mergers among mid-tier Chinese fixture makers signal a drive toward scale efficiencies, although regulatory flags around BIS and CCC approval timelines add friction for rapid SKU refreshes. The race for GaN-on-Si supply security is encouraging upstream investments in epi foundries across Japan and South Korea, a hedge against potential export controls.
Service models are an emerging battlefield: some suppliers now bundle energy-performance guarantees, replacing the one-time sale with recurring fees tied to verified savings. Retail chains upgrading multi-store footprints favor such contracts because they transfer technology risk to the vendor. These shifts reinforce a two-layer market: commoditized lamps traded on price, and integrated solutions that lock customers into data-rich platforms, collectively defining value capture in the Asia Pacific indoor LED lighting market.
Asia Pacific Indoor LED Lighting Industry Leaders
Foshan Electrical and Lighting Co., Ltd. (FSL)
Opple Lighting Co., Ltd.
Nichia Corporation
Everlight Electronics Co., Ltd.
MLS Co., Ltd. (Forest Lighting)
- *Disclaimer: Major Players sorted in no particular order

Recent Industry Developments
- June 2025: Global Lighting Technologies completed a Vietnam factory to realign its backlight supply chain and disclosed plans for a Thailand site, responding to regional sourcing shifts.
- June 2025: Everlight Electronics announced pilot production of SiC components for the second half of 2025, marking a pivot toward higher-margin power semiconductors.
- March 2025: TrendForce projected that Mini/Micro-LED display demand will reach USD 10.2 billion by 2028, highlighting the role of Asia Pacific vendors in the cinema and automotive verticals.


Asia Pacific Indoor LED Lighting Market Report Scope
Agricultural Lighting, Commercial, Industrial and Warehouse, Residential are covered as segments by Indoor Lighting. China, India, Japan are covered as segments by Country.| Lamps |
| Luminaires/ Fixtures |
| Residential |
| Commercial Offices |
| Retail Stores |
| Hospitality |
| Industrial Facilities |
| Healthcare and Education |
| Other Applications |
| New Installation |
| Retrofit Installation |
| Direct Sales |
| Wholesale Retail |
| E-commerce |
| China |
| India |
| Japan |
| South Korea |
| ASEAN |
| Rest of Asia Pacific |
| By Product Type | Lamps |
| Luminaires/ Fixtures | |
| By Application | Residential |
| Commercial Offices | |
| Retail Stores | |
| Hospitality | |
| Industrial Facilities | |
| Healthcare and Education | |
| Other Applications | |
| By Installation Type | New Installation |
| Retrofit Installation | |
| By Distribution Channel | Direct Sales |
| Wholesale Retail | |
| E-commerce | |
| By Country | China |
| India | |
| Japan | |
| South Korea | |
| ASEAN | |
| Rest of Asia Pacific |


Market Definition
- INDOOR LIGHTING - It incorporates all LED based lamps and fixtures/luminaire that are used to illuminate indoor section of residential, commercial, industrial buildings and agricultural lighting. LED offers efficient brightness with higher durability in comparison to other lighting technology.
- OUTDOOR LIGHTING - It incorporates the LED lighting fixtures that is used for illumination for exterior/outdoor illumination. For instance, LED lighting fixtures used to illuminate streets and highways, transport hubs, stadiums and other public places such as parking spaces.
- AUTOMOTIVE LIGHTING - It refers to the lighting fixtures installed for illumination and signaling purposes. It is used in both exterior and interior lighting of the vehicle. Headlamps, fog lamp, daytime running light (DRLs) are examples of exterior light whereas cabin light are interior lights.
- END USER - It refers to the end use application area where the LED fixture will be installed. For instance, in terms of indoor lighting, we have residential, commercial and industrial as end user category. For automotive lighting, primary end user considered are automotive manufacturers and aftermarket sale
| Keyword | Definition |
|---|---|
| Lumen | Lumen is a unit of luminous flux in the International System of Units that is equal to the amount of light given out through a solid angle by a source of one-candela intensity radiating equally in all directions. |
| Footcandle | A foot-candle (or foot-candle, fc, lm/ft2, or ft-c) is a measurement of light intensity. One foot-candle is defined as enough light to saturate a one-foot square with one lumen of light. |
| Colour Rendering Index (CRI) | Color Rendering Index (CRI) is a measurement of how natural colors render under an artificial white light source when compared with sunlight. The index is measured from 0-100, with a perfect 100 indicating that colors of objects under the light source appear the same as they would under natural sunlight. |
| Luminous flux | Luminous flux is a measure of the power of visible light produced by a light source or light fitting. It is measured in lumens (lm). |
| Annual Energy Cost | Annual Energy Cost means the average daily energy consumption multiplied by 365 (days per year), expressed in kilowatt hour per year (kWh/a). |
| Constant voltage drivers | Constant voltage drivers are designed for a single direct current (DC) output voltage. Most common constant voltage drivers (or Power Supplies) are 12VDC or 24VDC. An LED light that is rated for constant voltage usually specifies the amount of input voltage it needs to operate correctly. |
| Constant Current Driver | Constant current LED drivers are designed for a designated range of output voltages and a fixed output current (mA). LEDs that are rated to operate on a constant current driver require a designated supply of current usually specified in milliamps (mA) or amps (A). These drivers vary the voltage along an electronic circuit which allows current to remain constant throughout the LED system. |
| Minimum Energy Performance Standards (MEPS) | Minimum Energy Performance Standards specify the minimum level of energy performance that appliances and equipment must meet or exceed before they can supply or used for commercial purposes. |
| Luminous Efficacy | Luminous efficacy is a measurement commonly used in the lighting industry that indicates the ability of a light source to emit visible light using a given amount of power. |
| Solid State Lighting | Solid-state lighting (SSL) is a type of lighting that uses semiconductor light-emitting diodes (LEDs), organic light-emitting diodes (OLED), or polymer light-emitting diodes (PLED) as sources of illumination rather than electrical filaments, plasma (used in arc lamps such as fluorescent lamps), or gas. |
| Rated Lamp Life | Lamp life, also referred to as rated life, is the time in hours a lamp will last before a percentage of lamps will burn out. |
| Color Temperature | Colour temperature is a scale that measures how ‘warm’ (yellow) or ‘cool’ (blue) the light from a particular source is. It is measured in degrees of the Kelvin scale (abbreviated to K), and the higher the number, the ‘cooler’ the light. The lower the ‘K’ number, the ‘warmer’ the light. |
| Ingress Protection rating (IP rating) | The IP (Ingress Protection) rating of a bulb or light fixture declares the level of protection it has against dirt and water. |
| Fidelity Index | The general colour fidelity index, Rf, represents how closely the colour appearances of the entire sample set are reproduced (rendered) on average by a test light as compared to those under a reference illuminant. |
| Gamut Index | The gamut area is defined as “the area enclosed by a set of test color samples illuminated by a light source, in a two-dimensional chromaticity diagram or a plane of color space.”1 Within a defined color space, a “gamut” describes the subset of colors that can be perceived under specific lighting conditions. |
| Binning | In the lighting industry, the act of "binning" of LEDs is the process of sorting LEDs by certain characteristics, such as color, voltage, and brightness. |
| Accent lighting | Accent lighting, also called highlighting, emphasizes objects by focusing light directly on them. Accent lighting is used inside and outside the home to feature locations such as an entrance or to create dramatic effects. |
| Dimmable driver | A dimming driver has two functions: As a driver, it converts the 230V AC mains input to a low voltage DC output. As a dimmer, it reduces the amount of electrical energy flowing to the LEDs, thereby causing them to dim. |
| Flicker | Flicker is the repeated and frequent variation in the output of a light source over time. |
| Fluorescent | A property of materials defined as the ability to emit light after absorbing electromagnetic radiation such as visible or UV light. |
| Candela | The candela is the unit of luminous intensity in the International System of Units. It measures the light output per unit solid angle emitted from a light source in a specific direction. |
| LUX | Lux is used to measure the amount of light output in a given area - one lux is equal to one lumen per square meter. It enables us to measure the total "amount" of visible light present and the intensity of the illumination on a surface. |
| Uniformity (U0) | The uniformity of lighting has significant effects on visual performance in both indoor and outdoor areas. Uniformity (represented as U0) value can be found by dividing the minimum brightness (Emin) resulting from calculations according to the current lighting order, to the average brightness value (Eavg). |
| Visible Light Spectrum | The visible light spectrum is the segment of the electromagnetic spectrum that the human eye can view. More simply, this range of wavelengths is called visible light. Typically, the human eye can detect wavelengths from 380 to 700 nanometers. |
| Ambient Temperature | Ambient Temperature is the temperature of the air surrounding an electrical enclosure. |
| Current-controlled dimming control | Current-controlled dimming controls LED brightness by varying the applied current using a 0-10V dimmer. Current-controlled dimming is smooth and HD-video friendly. It can only dim to a minimum of 5% of light output. |
| Design Light Consortium | It is a partnership of energy efficiency stakeholders in the United States and Canada to “promote quality, performance and energy efficient lighting solutions for the commercial sector”. |
| Pulse Width Modulation | Pulse-width modulation, or pulse-duration modulation, is a method of controlling the average power delivered by an electrical signal. |
| Surface Mounted Device | A surface mount device (SMD) is an electronic device whose components are mounted or placed directly on the surface of a printed circuit board. |
| Alternating Current | Alternating current is an electric current which periodically reverses direction and changes its magnitude continuously with time, in contrast to direct current, which flows only in one direction. |
| Direct Current | Direct current (DC) is an electric current that is uni-directional, so the flow of charge is always in the same direction. |
| Beam Angle | Beam angle (also called beam spread) is a measure of how light is distributed. On any plane perpendicular to the centerline of the light, the beam angle is the angle between two rays where the light intensity is 50% of the maximum light intensity. |
| LED Based Solar High Mast Lighting Systems | A Solar LED High Mast Light is a raised source of High illumination lights (6~8 lights) and with high intensity on the middle of major junctions (Ring roads, Outer Ring roads), turned on or lit automatically in the absence of light (at specified timings or at periodic times, every night). |
| Surface Mounted Diode (SMD) LEDs | A surface mount diode is a type that emits light and is flat mounted and soldered onto a circuit board. |
| Chip on Board (COB) LEDs | A COB LED is basically multiple LED chips (usually 9 or more) glued directly onto a substrate by the manufacturer to form a single module. |
| Dual In-Line Package (DIP) LEDs | A dual in-line package (DIP or DIL) is an electronic component package with a rectangular case and two parallel rows of electrical connector pins. |
| Graphene LED Lights | A graphene LED light bulb is simply an LED light bulb where the filament has been coated in graphene. A graphene LED bulb is reported to be 10% more efficient than regular LED light bulbs and they are cheaper to manufacture and buy. |
| LED Corn Bulbs | LED Corn lights are designed as an energy efficient alternative to high intensity discharge (HID) and SON lamps. It uses a large number of LEDs on a metal structure to provide sufficient light. This arrangement of LEDs looks a lot like a corn cob, hence the name "corn light". |
| Per Capita Income | Per capita income or total income measures the average income earned per person in a given area in a specified year. It is calculated by dividing the area's total income by its total population. Per capita income is national income divided by population size. |
| Charging Stations | A charging station, also known as a charging station or electric vehicle utility, is a power supply that provides electrical energy for charging plug-in electric vehicles. |
| Headlight | A headlight is a light that is mounted on the front of a car and illuminates the road in front of it. Low beam and high beam LED headlights are additional categories for these LED headlights. |
| Day Time Running Light (DRLs) | A daytime running lamp is a white, yellow, or amber lighting device mounted on the front of a road-going motor vehicle or bicycle. |
| Directional Signal Light | Directional signal lights are the front and rear lights on an automobile that flash to show the direction of a turn. |
| Stop Light | A red light that is mounted to the back of a car and turns on when the brakes are used to show that the car is stopped. |
| Reverse Light | The reverse light is at the back of the vehicle to indicate its backward motion. |
| Tail Light | A red light that can be seen in the dark is mounted on the rear of a road vehicle. Stop, reverse, and directional signal lights are all part of it. |
| Fog Light | Bright lights in automobiles used to increase visibility on the road in foggy conditions or to warn other drivers of the presence of the vehicle. |
| Passenger Vehicle | A passenger vehicle is a road vehicle, other than a moped or a motorcycle, intended for the transportation of people and designed for up to 8 to 9 seats. |
| Commercial Vehicle | A commercial vehicle (Bus, Truck, Van) is any type of motor vehicle used to transport goods or pay passengers. |
| Two Wheelers (2W) | A two-wheeler is a vehicle that runs on two wheels. |
| Streets & Roadways | Both roads and streets refer to hard, flat surfaces on the ground on which vehicles, people, and animals can travel. Since streetways are usually in cities and towns, they often have houses and buildings on both sides. The roadway is in the countryside and sometimes passes through forests and fields |
| Horticulture Lighting | Horticulture is the science and art of sustainably growing, producing, marketing and using high quality, intensively cultivated food and ornamental plants. |


Research Methodology
Mordor Intelligence has followed the following methodology in all our data center reports.
- Step 1: Raw Data Collection: To understand the market, initially, all crtical data points were identified. Critical information about countries and regions of interest including Per-capita Income, Population, Automotive Production, Interest rate on Auto-Loans, Number of Automobiles on Road, Total LED Import, Lighting Electricity Consumption among others were recorded or estimated based on internal calculations.
- Step 2: Identify Key Variables: To build a robust forecasting model, key variables such as Number of Households, Automotive Production, Road Networks among others were identified. Through an iterative process, the variables required for the market forecast were set, and the model was built using these variables.
- Step 3: Build a Market Model: Based on data and critical industry trend data (variables), including LED pricing, LED penetration rate, and project macro and micor economic factors were utilized for building the market forecasting.
- Step 4: Validate and Finalize: In this crucial step, all market numbers and variables derived through an internal mathematical model were validated through an extensive network of primary research experts from all the markets studied. The respondents are selected across levels and functions to generate a holistic picture of the market studied.
- Step 5: Research Outputs: Syndicated Reports, Custom Consulting Assignments, Databases & Subscription Platforms


