
Asia-Pacific Disaster Restoration Services Market Size and Share
Market Overview
| Study Period | 2020 - 2031 |
|---|---|
| Forecast Data Period | 2026 - 2031 |
| Base Year Market Size (2025) | USD 13.69 Billion |
| Market Size (2026) | USD 14.47 Billion |
| Market Size (2031) | USD 19.64 Billion |
| Growth Rate (2026 - 2031) | 6.30 % |
| Market Concentration | Low |
Major Players *Disclaimer: Major Players sorted in no particular order Image © Mordor Intelligence. Reuse requires attribution under CC BY 4.0. | |
Asia-Pacific Disaster Restoration Services Market Analysis by Mordor Intelligence
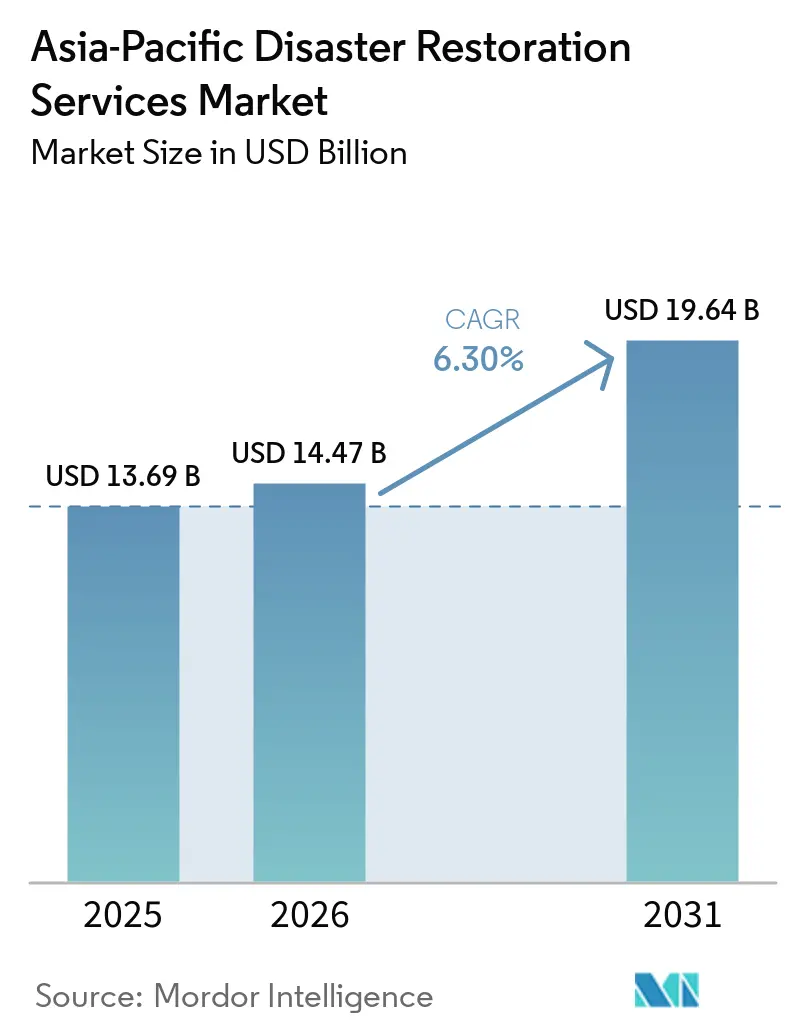
The Asia-Pacific Disaster Restoration Services Market size was valued at USD 13.69 billion in 2025 and is estimated to grow from USD 14.47 billion in 2026 to reach USD 19.64 billion by 2031, at a CAGR of 6.30% during the forecast period (2026-2031).
Floods, earthquakes, tropical cyclones, and bushfires continued to create demand for timely property recovery across the region. Flood losses accounted for more than half of Asia’s natural catastrophe losses in 2025, which kept water removal and drying work central to the Asia-Pacific disaster restoration services market. Insurers, governments, and large property owners increasingly require documented restoration work, which favors providers that can meet response, reporting, and certification requirements. Large commercial sites also raised the value of individual assignments because a delay can damage equipment, inventory, and operational continuity. Low insurance coverage and uneven technician availability limited the formal service base in several emerging economies, even where physical restoration needs remained high.
Key Report Takeaways
- By service type, water damage restoration held 38.0% of the Asia-Pacific disaster restoration services market share in 2025, while the others category is forecast to grow at a 7.2% CAGR through 2031.
- By application, commercial and industrial properties accounted for 55.0% of the Asia-Pacific disaster restoration services market size in 2025, while residential restoration is forecast to expand at a 7.0% CAGR through 2031.
- By customer/payor type, insurance-funded work held 58.0% of the Asia-Pacific disaster restoration services market share in 2025, while public-sector and government-funded work is forecast to grow at a 7.5% CAGR through 2031.
- By geography, China held 34.2% of the market revenue in 2025, while the Rest of Asia-Pacific is forecast to expand at a 6.7% CAGR through 2031.
Note: Market size and forecast figures in this report are generated using Mordor Intelligence’s proprietary estimation framework, updated with the latest available data and insights as of January 2026.
Asia-Pacific Disaster Restoration Services Market Trends and Insights
Drivers Impact Analysis*
| Driver | (~) % Impact on CAGR Forecast | Geographic Relevance | Impact Timeline |
|---|---|---|---|
| Rising Flood, Typhoon, Earthquake, and Bushfire Loss Exposure | +1.8% | Asia-Pacific, especially the Philippines, China, Japan, Australia, and Indonesia | Short term (≤ 2 years) |
| Insurance Penetration and Claims Outsourcing | +1.4% | China, India, ASEAN, and South Asia | Medium term (2-4 years) |
| Urban Property Density and Higher Asset Values | +0.9% | China, India, ASEAN cities, and industrial corridors | Long term (≥ 4 years) |
| Resilient Infrastructure and Business Continuity Investment | +0.7% | APAC, led by China, Japan, Australia, Singapore, and ASEAN corridors | Medium term (2-4 years) |
| Demand for Certified, Rapid Loss Mitigation | +0.5% | Australia, Japan, Singapore, and maturing Southeast Asian markets | Medium term (2-4 years) |
| Humidity-Related Secondary Damage Detection | +0.3% | ASEAN, India, Bangladesh, Sri Lanka, and the Pacific Islands | Long term (≥ 4 years) |
| Source: Mordor Intelligence | |||
Rising Flood, Typhoon, Earthquake, and Bushfire Loss Exposure
Flooding generated USD 31 billion in economic losses across Asia during 2025 and represented more than half of the region’s natural catastrophe losses. This loss pattern kept water removal, dehumidification, cleaning, and rebuilding work in steady demand across the Asia-Pacific disaster restoration services market. A sequence of tropical systems affected Thailand, Indonesia, and Malaysia from late November to early December 2025. The events occurred within 5-15 days, saturated soil, overwhelmed flood defenses, and generated at least USD 11 billion in losses. The March 2025 Myanmar earthquake added a different form of recovery demand, including structural remediation and cross-border mobilization. Australia’s Cyclone Alfred, May flooding, and late-year hail events also tested restoration panel capacity during 2025.
Increasing Insurance Penetration and Property-Insurance Claims Outsourcing
Insurance penetration remained uneven across Asia-Pacific, yet insured flood losses increased as more property owners entered formal coverage channels. The regional protection gap remained significant, which left governments and households responsible for a large share of disaster costs.[1]ASEAN+3 Macroeconomic Research Office, “Asia’s Natural Disasters Must Not Become Financial Crises,” AMRO, amro-asia.org The Asia-Pacific disaster restoration services market, therefore, includes both insurer-directed work and self-funded or public recovery activity. In Australia and Japan, insurer-panel systems have supported the use of certified providers with established reporting processes. Johns Lyng Group reported new multiyear contracts with Zurich, AIG, Aidacare, and TIO in FY2025, together with extensions involving Suncorp, Hollard, Allianz, Auto & General, and Market Lane Group. ASEAN+3 finance ministers endorsed the Disaster Risk Financing Initiative’s 2026-28 roadmap in May 2026, supporting stronger disaster-risk financing structures across the region.
Urban Property Density and Higher Replacement Value of Contents and Equipment
Flood-exposed coastal corridors in Asia-Pacific contain dense concentrations of semiconductor plants, electronics assembly sites, logistics facilities, and data centers. These facilities require rapid drying, controlled cleaning, equipment recovery, and temporary storage after water intrusion. The loss from service interruption can exceed the cost of building repairs for sites that depend on cleanroom conditions or continuous data operations. China’s flood-exposed built-up area expanded 480% between 1975 and 2025. Bangkok’s flood-vulnerable urban area also expanded 43% during the 20 years leading up to 2025. These conditions supported demand for pack-out services, electronics recovery, climate-controlled storage, document recovery, and specialty cleaning in the Asia-Pacific disaster restoration services market.
Government and Corporate Investment in Resilient Infrastructure and Business Continuity
Governments are moving toward arrangements that provide financing before a disaster occurs rather than relying only on post-event emergency appropriations. The Asian Development Bank established the PREPARE financing partnership facility in April 2026, with Japan as the inaugural financing partner.[2]Asian Development Bank, “Furthering Risk Finance and Resilience in the Pacific, PREPARE Trust Fund,” Asian Development Bank, adb.org This facility is intended to accelerate access to pre-arranged disaster risk financing in ADB developing member countries. The approach can support public infrastructure repair and formal procurement of qualified restoration providers. Japan’s resilience planning has also supported structured procurement for certified services on public assets. Corporate users in export manufacturing corridors are similarly using preferred vendor arrangements within business continuity plans. These arrangements can turn episodic repair spending into contracted work for providers able to meet technical and reporting requirements.
Restraints Impact Analysis*
| Restraint | (~) % Impact on CAGR Forecast | Geographic Relevance | Impact Timeline |
|---|---|---|---|
| Uneven Insurance Coverage and Direct-Pay Friction | -1.4% | Southeast Asia, South Asia, and the Pacific Islands | Long term (≥ 4 years) |
| Shortage of Certified Technicians and Disaster-Scale Equipment | -1.1% | Regional Australia, Pacific Islands, rural ASEAN, and tier-2 and tier-3 cities | Medium term (2-4 years) |
| Fragmented Claims Protocols and Restoration Standards | -0.8% | ASEAN, South Asia, and the Pacific Islands | Medium term (2-4 years) |
| Narrow Salvage Windows for Technology Assets | -0.5% | China, India, Singapore, and Japan | Short term (≤ 2 years) |
| Source: Mordor Intelligence | |||
Uneven Insurance Coverage and High Self-Pay Friction in Emerging Asia-Pacific Markets
Non-life insurance penetration in emerging and developing Asia-Pacific remained well below the average level across OECD countries during 2025.[3]OECD, “Protection Gaps in Insurance for Natural Hazards and Retirement Savings in Asia,” OECD, oecd.org Many disaster-affected property owners therefore paid for recovery directly, delayed work, reduced the scope of repairs, or relied on informal labor. This pattern constrained formal demand in the Asia-Pacific disaster restoration services market despite substantial physical damage exposure. AMRO reported an 88% protection gap for Asia over the 2016-2025 period. Government funding often filled part of this gap, but it did not always create standardized restoration assignments. Wider use of microinsurance, parametric products, and public risk pools could improve access over time, although these mechanisms have not reached a broad operating scale in lower-middle-income economies.
Shortage of Certified Technicians and Catastrophe-Scale Equipment Outside Major Cities
Qualified labor and specialized equipment were concentrated in major metropolitan areas, which reduced surge capacity after major events. Jobs and Skills Australia identified 67 occupations in the Technicians and Trades Workers category with persistent shortages in 2025.[4]Jobs and Skills Australia, “Skills Priority List 2025,” Australian Government, jobsandskills.gov.au The shortage became more serious when simultaneous reconstruction activity occurred across several regional locations. The IICRC identifies certification as a core part of the professional restoration career pathway. Large commercial buildings and industrial facilities often require drying arrays, atmospheric monitoring, and specialist oversight in addition to trained technicians. Equipment and skilled teams were more available in Sydney, Melbourne, Tokyo, Seoul, Singapore, and Shanghai than in secondary cities or remote areas. This imbalance limited operator coverage in parts of the Asia-Pacific disaster restoration services market where disaster exposure remained material.
*Our forecasts treat driver/restraint impacts as directional, not additive. The impact forecasts reflect baseline growth, mix effects, and variable interactions.
Segment Analysis
By Service Type: Water Damage Holds the Largest Position, While Specialty Work Expands
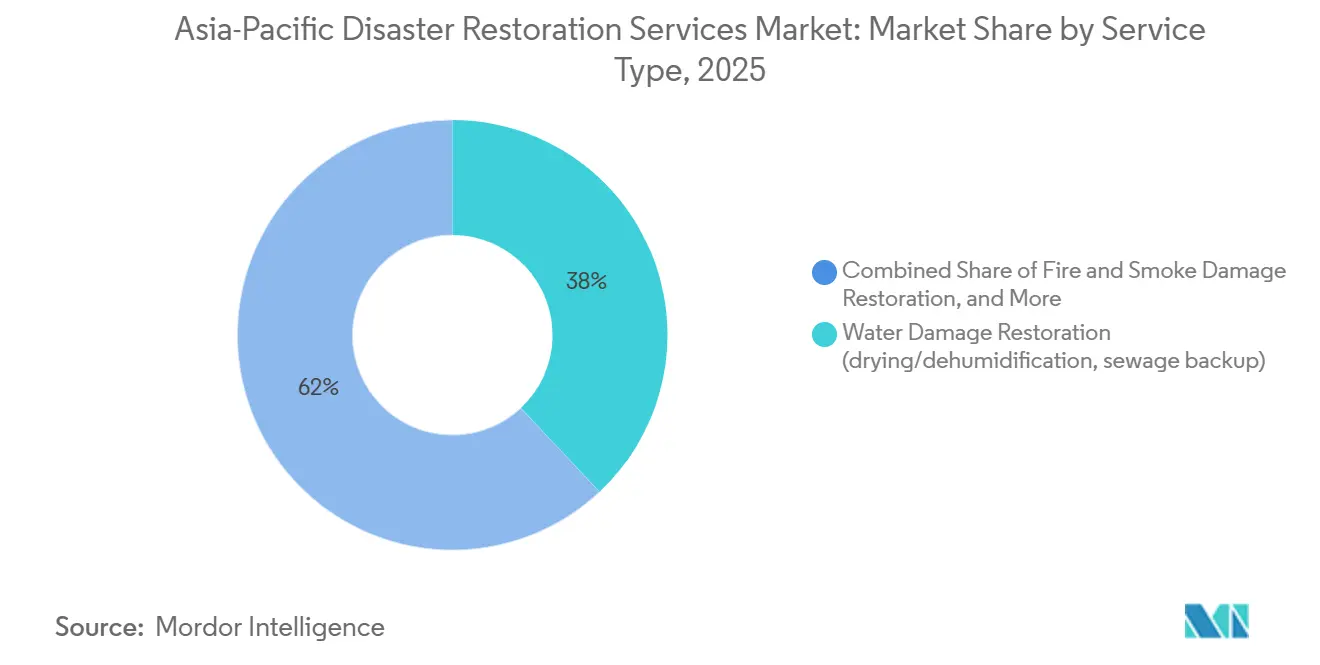
Water damage restoration held 38.0% of the Asia-Pacific disaster restoration services market size in 2025. The category included drying, dehumidification, and sewage backup remediation. Recurrent monsoons and typhoon flooding supported its leading position across the region. Floods accounted for more than half of Asia’s natural catastrophe losses in 2025, keeping water-related recovery work central to the service mix. Tropical humidity made timely moisture mapping and drying especially important for building assemblies and concealed mechanical systems. Providers with desiccant or refrigerant drying capability and microbial risk controls were better placed to manage insurer-funded assignments. Storm and catastrophe restoration also expanded as wind, hail, and flood events affected the Philippines, Japan, and Australia.
The others category is forecast to grow at a 7.2% CAGR during 2026-2031, making it the fastest-growing service type. It included contents restoration, pack-out logistics, cleaning, and storage. Higher values for electronics, furnishings, and business equipment increased the need to recover content rather than replace them. Specialty services included electronics and data recovery, cleanroom decontamination, and infrastructure-grade restoration. These services gained importance among semiconductor and logistics clients who used preferred vendor arrangements. Fire and smoke restoration remained relevant in Australia because of bushfire exposure and in dense cities where electrical faults can affect multiple floors. Biohazard and trauma cleanup remained smaller by revenue but continued to form part of the regional service offering. IICRC S500 and S520 standards shaped eligibility for water damage and mold remediation work in mature insurance systems.



By Application: Commercial and Industrial Sites Lead While Residential Demand Deepens
Commercial and industrial sites accounted for 55.0% of the Asia-Pacific disaster restoration services market share in 2025. High-value assets were concentrated in flood- and typhoon-exposed business districts, manufacturing areas, and logistics parks. Guangdong, the Yangtze Delta, Metro Manila Bay, and Bangkok’s eastern industrial estates were important examples. Commercial assignments often had higher values because they required moisture extraction, decontamination, monitoring, and business continuity support. A data center water intrusion could demand more extensive work than a residential flooding event of similar volume. Local contractors commonly handled routine small commercial claims. Large industrial losses favored providers with specialist inventories, experienced catastrophe teams, and the ability to mobilize across jurisdictions.
Residential restoration represented 45.0% of regional demand in 2025. It is forecast to grow at a 7.0% CAGR during 2026-2031, making it the fastest-growing application. Rising values for kitchen fittings, home-office electronics, and interior finishes improved the case for professional recovery rather than self-repair or replacement. Flooding in Bengaluru and Chennai created residential demand in India’s urban areas. Australia’s bushfire and storm activity also supported residential assignment volumes. Wider household insurance adoption in China, Vietnam, and Indonesia could convert more losses into formal restoration engagements. The Asia-Pacific disaster restoration services market remained dependent on local response capacity because household claims often require quick intervention after water damage. This need supported the role of local providers with established insurer-panel relationships.
By Customer and Payor Type: Insurance Funding Leads While Public Mandates Rise
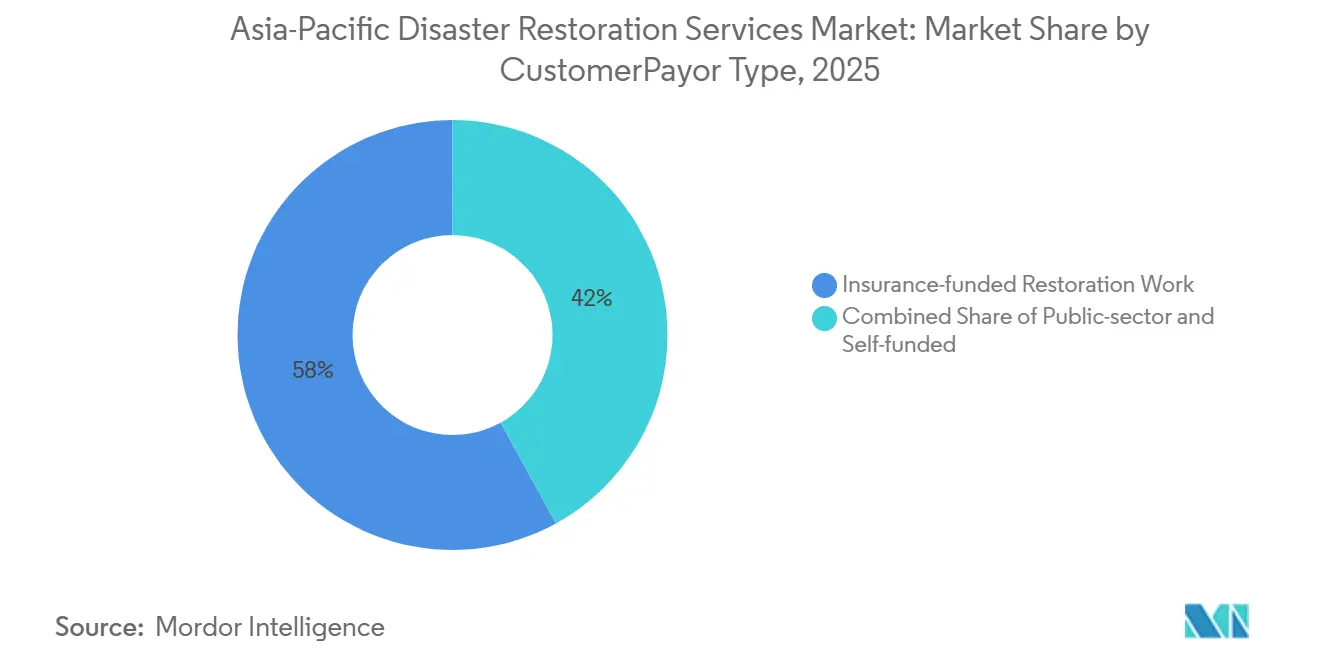
Insurance-funded work accounted for 58.0% of the Asia-Pacific disaster restoration services market size in 2025. Insurer panels directed work toward providers that met documentation, response time, and quality requirements. This model favored firms with certified technicians, digital workflows, and claims integration capability. Johns Lyng Group’s FY2025 contract announcements illustrated the importance of long-term relationships with insurers and other payors. These arrangements helped operators secure repeat assignments instead of relying only on catastrophe events. They also raised the importance of consistent reporting and transparent claims records. The Asia-Pacific disaster restoration services industry consequently placed significant value on operating systems that support panel eligibility.
Self-funded and direct-pay activity reflected the region’s insurance protection gap. Property owners without coverage faced the full cost of recovery, which could create pricing pressure and reduce the use of certified contractors. Public-sector and government-funded work is forecast to grow at a 7.5% CAGR during 2026-2031, making it the fastest-growing payor segment. Government contracts often covered larger infrastructure recovery scopes and required more rigorous compliance than small residential assignments. The ADB’s PREPARE facility provided an example of pre-arranged financing intended to support post-disaster response. Such facilities can help governments move from ad hoc emergency funding toward planned recovery arrangements. Providers that meet procurement and certification requirements can benefit, while the entry threshold remains high for less formal contractors.
Geography Analysis
China held 34.2% of the Asia-Pacific disaster restoration services market share in 2025. The country’s large urban construction base and recurring flooding in northeastern China and the Pearl River Delta supported regional demand. Northeastern China flooding generated USD 5.8 billion in economic losses during 2025, while insured losses were below USD 500 million. This gap supported separate government-funded, insurer-directed, and corporate self-funded recovery channels. China’s 15th Five-Year Plan period for 2026-2030 prioritizes smart-city resilience and property insurance expansion. Japan remained a mature regional market with an established earthquake insurance administration and structured public procurement. Technical thresholds under building rules and certification requirements limited access to higher-value public and insurance-funded assignments.
Australia and India were the region’s highest-growth large markets. Australia benefited from established insurer panels, comparatively strong property coverage, and recurring natural hazard exposure. Cyclone Alfred, May flooding, and late-year hail events made 2025 one of Australia’s costliest natural-disaster years. India combined rising urban property values in flood-prone tier-1 and tier-2 cities with growing corporate and residential insurance use. Indonesia, the Philippines, Thailand, Vietnam, and Malaysia formed a major volume-growth cluster. These countries experienced significant flood and cyclone losses during 2025 and showed deeper insurance participation. The late-2025 event affecting Thailand, Indonesia, and Malaysia showed the scale of demand and the limits of existing regional response capacity.
The Rest of Asia-Pacific is forecast to grow at a 6.7% CAGR during 2026-2031, making it the fastest-growing geographic segment. Growth began from a lower base and was linked to multilateral disaster-preparedness investment. The Asian Development Bank approved its first project under the Rapid Resource Reprogramming and Deployment Option crisis financing mechanism for Vanuatu in August 2026. Bangladesh and Iran remained early-stage settings where formal restoration capacity was limited despite flood and seismic exposure. Rising insurance awareness, urban property values, and resilience frameworks created conditions for more organized service provision. SEADRIF announced USD 2.28 million in payouts to Laos and the UN World Food Programme after flooding in September 2026. The payment illustrated the development of parametric insurance infrastructure in underserved areas.
Competitive Landscape
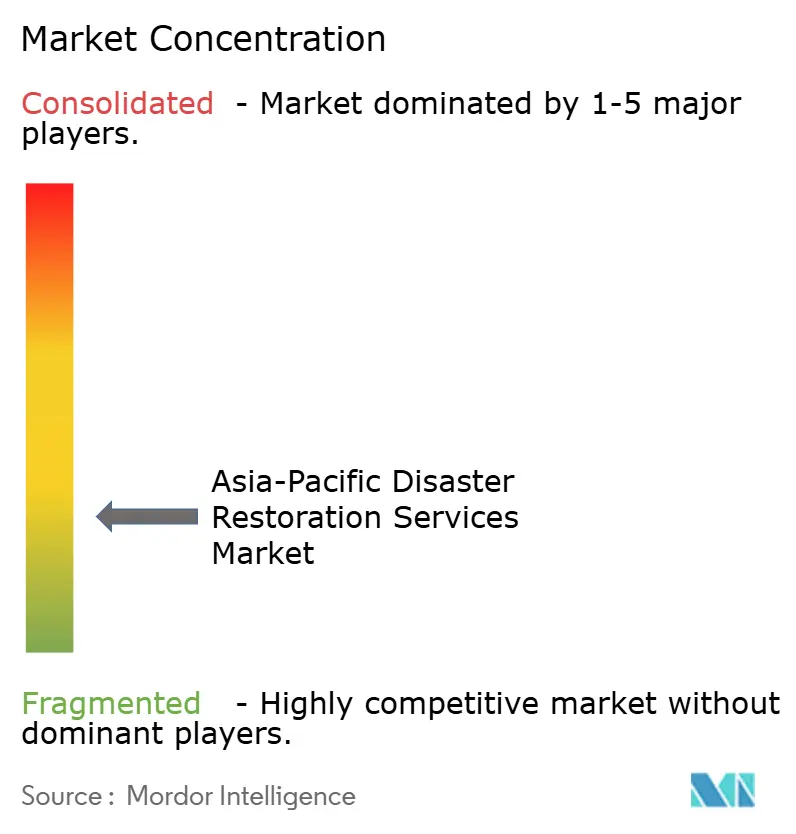
The Asia-Pacific disaster restoration services market was fragmented across many national markets. Global franchise networks and multinational specialists focused on large-loss industrial and multi-site commercial work. Domestic companies remained important in residential and small-commercial work because they could respond locally and maintain insurer-panel relationships. BELFOR operated through more than 550 offices worldwide and expanded its Southeast Asian footprint through a Malaysia operation in 2025. Its focus on industrial, electronics, document, and infrastructure recovery differentiated it from firms with fewer specialist assets. Johns Lyng Group held a leading position in Australia’s insurance-building restoration activity. Its contract pipeline also showed a growing role for government-contracted disaster management work.
Competition increasingly depended on the ability to shorten the period between damage assessment and field mobilization. Some operators used drone inspection, connected moisture sensors, and automated claims documentation to improve this process. These tools supported insurers that required faster information and consistent documentation. Another distinction existed between transaction-based repair providers and firms offering pre-event monitoring, post-event restoration, and post-restoration verification. Polygon emphasized drying and damage-control services across its operating markets. Smaller firms in Malaysia, Singapore, and Australia competed through 24/7 response and insurer-specific reporting. IICRC training and digital workflow integration could help these providers qualify for preferred-vendor work.
Opportunity remained in remote assessment and claims integration, where insurer outsourcing was still developing. Biohazard and specialty environmental remediation outside major cities also remained less developed. Preventive moisture monitoring and building hygiene assessments could create recurring work before a loss event. Johns Lyng Group’s reported multi-year contracts with insurers and other counterparties showed the value of deeper payor relationships. BELFOR’s Malaysia expansion was designed to strengthen regional response capability and 24/7 coverage. The Asia-Pacific disaster restoration services industry, therefore, rewarded operational reach, technical capability, and reliable claims documentation more than price alone.
Asia-Pacific Disaster Restoration Services Industry Leaders
BELFOR Holdings, Inc.
Johns Lyng Group Limited
Steamatic Australia
Cowan Restoration Group
Elite Restoration
- *Disclaimer: Major Players sorted in no particular order

Recent Industry Developments
- August 2026: The Asian Development Bank approved the first project under its Rapid Resource Reprogramming and Deployment Option crisis financing mechanism for Vanuatu, establishing a new channel for pre-arranged post-disaster restoration and infrastructure-repair financing in small island developing states across the Pacific.
- April 2025: The Asian Development Bank established the PREPARE, Pre-Arranged Resources for Enhancing Preparedness and Resilience, financing partnership facility, with the Government of Japan as the inaugural financing partner. The facility is designed to give ADB developing member countries faster, pre-arranged access to post-disaster restoration and infrastructure-repair financing, directly expanding the government-payor segment in frontier markets.
- January 2026: BELFOR expanded its disaster recovery operations in Malaysia, establishing full 24/7 coverage following the opening of its Penang branch. The expansion was designed to address logistics delays that had previously hampered regional large-loss response.
- October 2025: Pacific Equity Partners and CPP Investments completed the privatization of Johns Lyng Group for AUD 1.3 billion (USD 871.19 million), taking Australia’s largest integrated building and restoration services firm off the ASX. Under private ownership, the group entered 2026 with a growing pipeline of multi-year disaster management contracts and an objective to deepen its public-sector restoration business.


Asia-Pacific Disaster Restoration Services Market Report Scope
| Water Damage Restoration (drying/dehumidification, sewage backup) |
| Fire & Smoke Damage Restoration |
| Mold Remediation |
| Storm / Catastrophe Restoration (wind, hail, flood response, large-loss) |
| Biohazard & Trauma Cleanup (crime scene, unattended death, infectious cleanup) |
| Specialty Services |
| Others (contents restoration, pack-out, cleaning, storage, etc.) |
| Residential |
| Commercial & Industrial |
| Insurance-funded Restoration Work |
| Self-funded / Direct-pay Restoration Work |
| Public-sector / Government-funded Restoration Work |
| China |
| India |
| Japan |
| Australia |
| Indonesia |
| Philippines |
| Thailand |
| Vietnam |
| Malaysia |
| Bangladesh |
| Rest of Asia-Pacific |
| By Service Type | Water Damage Restoration (drying/dehumidification, sewage backup) |
| Fire & Smoke Damage Restoration | |
| Mold Remediation | |
| Storm / Catastrophe Restoration (wind, hail, flood response, large-loss) | |
| Biohazard & Trauma Cleanup (crime scene, unattended death, infectious cleanup) | |
| Specialty Services | |
| Others (contents restoration, pack-out, cleaning, storage, etc.) | |
| By Application | Residential |
| Commercial & Industrial | |
| By Customer/Payor Type | Insurance-funded Restoration Work |
| Self-funded / Direct-pay Restoration Work | |
| Public-sector / Government-funded Restoration Work | |
| By Geography | China |
| India | |
| Japan | |
| Australia | |
| Indonesia | |
| Philippines | |
| Thailand | |
| Vietnam | |
| Malaysia | |
| Bangladesh | |
| Rest of Asia-Pacific |


Key Questions Answered in the Report
What is the 2026 value of Asia-Pacific disaster restoration services?
The sector is estimated at USD 14.47 billion in 2026 and is forecast to reach USD 19.64 billion by 2031 at a 6.3% CAGR.
Which service has the largest role in disaster restoration across the Asia-Pacific?
Water damage restoration led with 38.0% of regional revenue in 2025, equal to USD 5.2 billion, while the others category is forecast to grow at a 7.2% CAGR through 2031.
Why do floods matter for restoration demand in the Asia-Pacific?
Floods generated USD 31 billion in economic losses across Asia in 2025 and accounted for more than half of regional catastrophe losses.
Which customer group provides the most restoration revenue?
Insurance-funded work accounted for 58.0% of demand in 2025, while public-sector and government-funded work is forecast to grow at a 7.5% CAGR through 2031.
Which country has the largest regional demand for disaster restoration?
China held 34.2% of regional demand in 2025, while the Rest of the Asia-Pacific is forecast to expand at a 6.7% CAGR through 2031.
What capabilities matter for restoration providers in Asia-Pacific?
Providers need rapid response, certified technicians, specialist drying and monitoring equipment, and documentation that supports insurer or government requirements.
Page last updated on:


 Your data is secure and never sold or shared.


