Market Overview
| Study Period | 2021 - 2031 |
|---|---|
| Forecast Data Period | 2026 - 2031 |
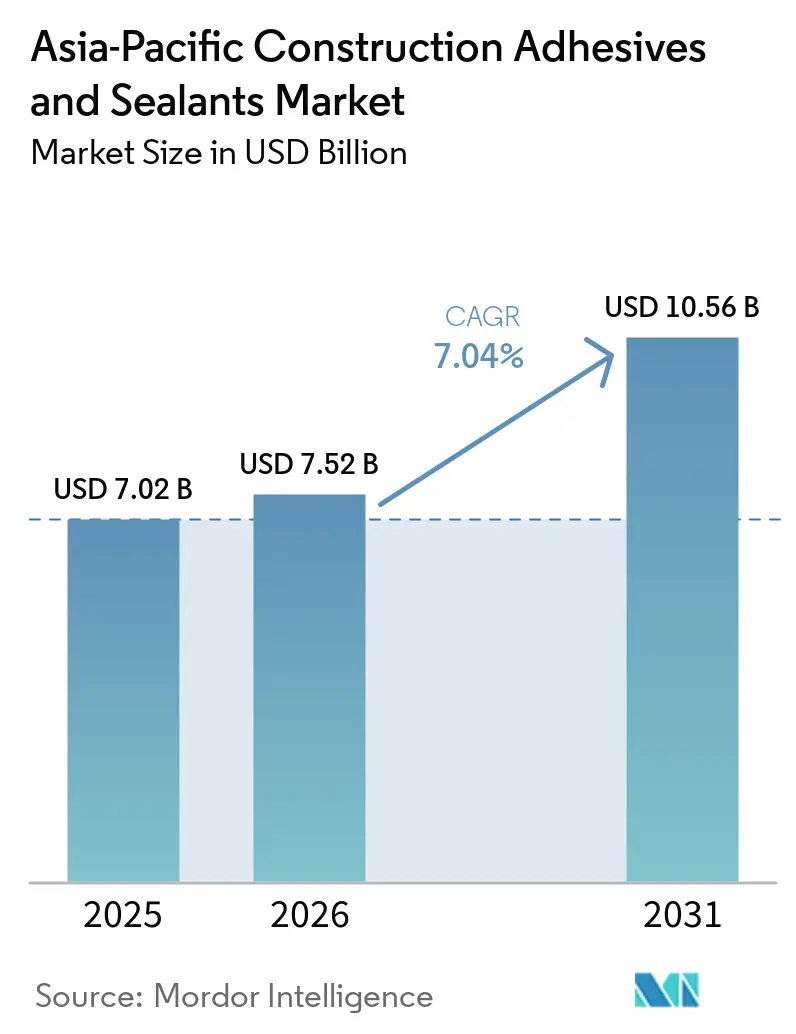
| Base Year Market Size (2025) | USD 7.02 Billion |
| Market Size (2026) | USD 7.52 Billion |
| Market Size (2031) | USD 10.56 Billion |
| Growth Rate (2026 - 2031) | 7.04% CAGR |
| Market Concentration | Medium |
Major Players *Disclaimer: Major Players sorted in no particular order Image © Mordor Intelligence. Reuse requires attribution under CC BY 4.0. | |
Asia-Pacific Construction Adhesives And Sealants Market Analysis by Mordor Intelligence
The Asia-Pacific Construction Adhesives And Sealants Market size was valued at USD 7.02 billion in 2025 and is estimated to grow from USD 7.52 billion in 2026 to reach USD 10.56 billion by 2031, at a CAGR of 7.04% during the forecast period (2026-2031). Transport corridor megaprojects are widening demand for marine-grade polyurethane sealants, while seismic-retrofit programs in mature economies are accelerating the shift toward neutral-cure silicones that tolerate ±25% joint movement. Beijing’s tighter volatile-organic-compound (VOC) limits are catalyzing adoption of water-borne acrylics; these products now underwrite fast-track prefabricated-module assembly timelines that favor moisture-cure polyurethane and two-part epoxy chemistries. Multinational formulators are investing in regional production hubs to cushion raw-material volatility, yet localized blenders continue to compete on logistics cost inside the residential channel. Dimethyl-carbonate and silicon-metal supply shocks remain watchpoints because they can elongate sealant lead times to 12 weeks, steering some projects toward modified-silane alternatives.
Key Report Takeaways
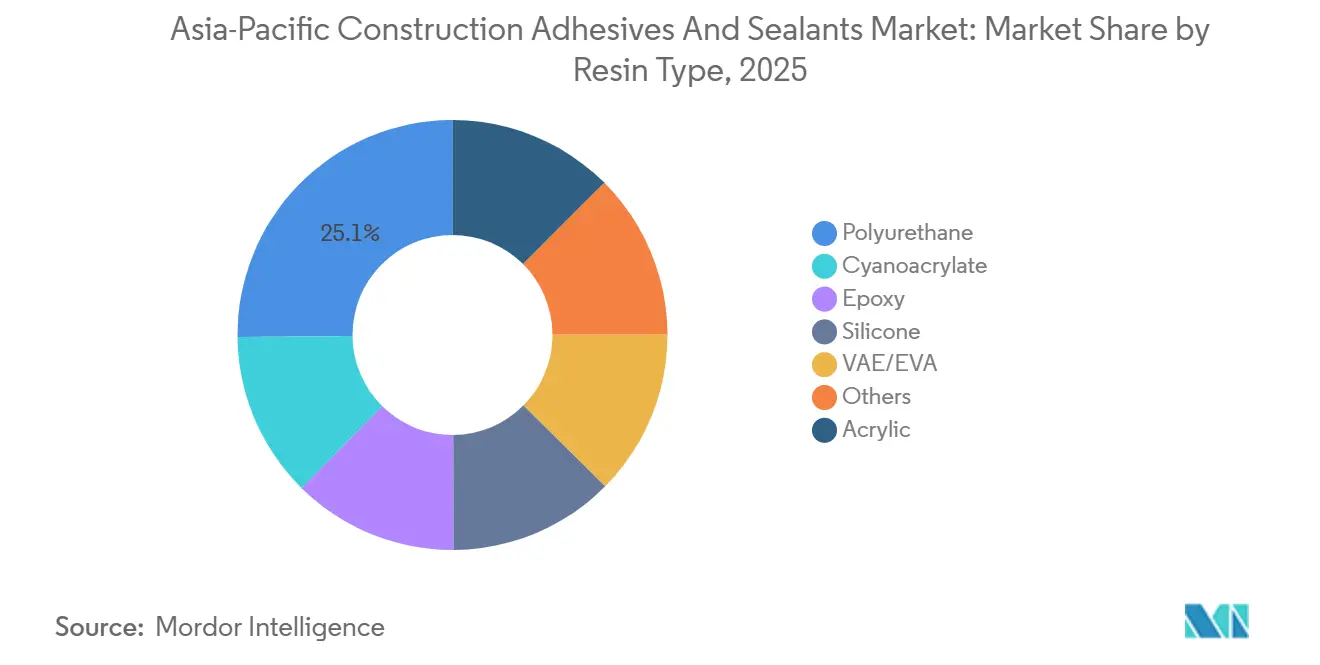
- By resin type, polyurethane resins held the largest share at 25.14% of the Asia-Pacific Construction Adhesives and Sealants market in 2025, while silicone will advance at a 7.18% CAGR through 2031.
- By technology, sealants (1K and 2K) accounted for 44.37% of the Asia-Pacific Construction Adhesives and Sealants market size in 2025, and water-borne-based ones are forecast to expand at a 7.32% CAGR to 2031.
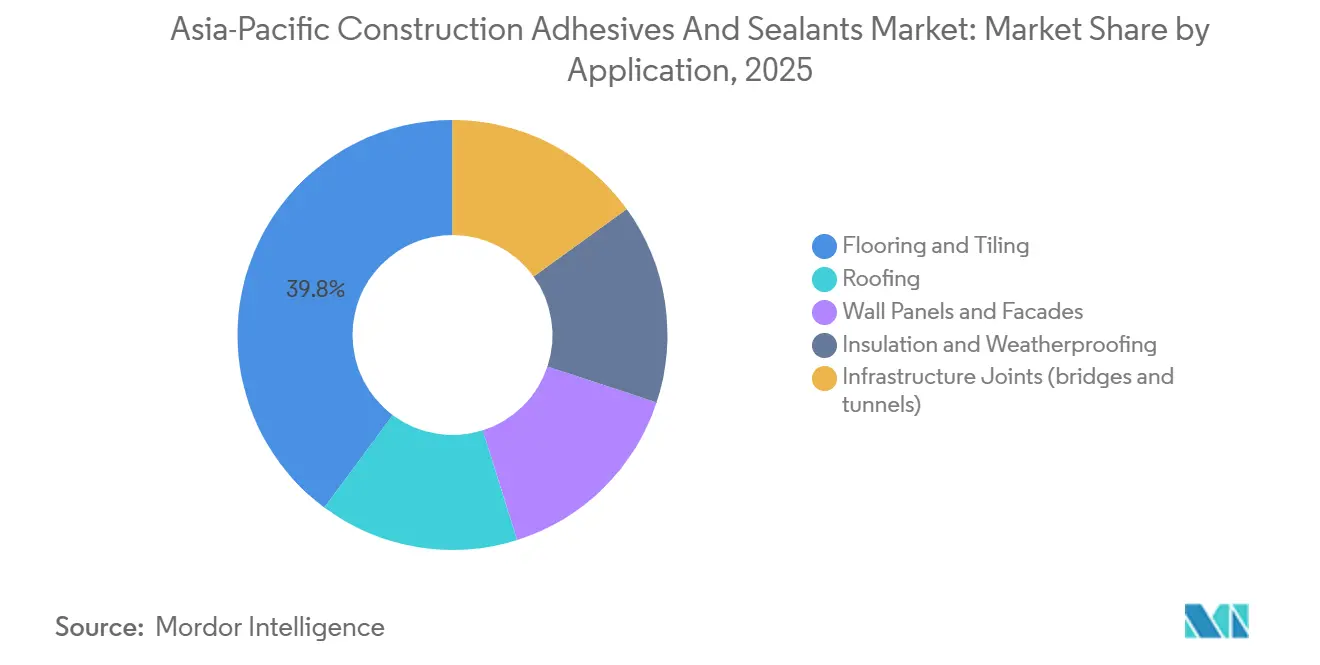
- By application, flooring and tiling captured 39.83% of the Asia-Pacific Construction Adhesives and Sealants market size in 2025; infrastructure joints (bridges and tunnels) will post the fastest 7.18% CAGR to 2031.
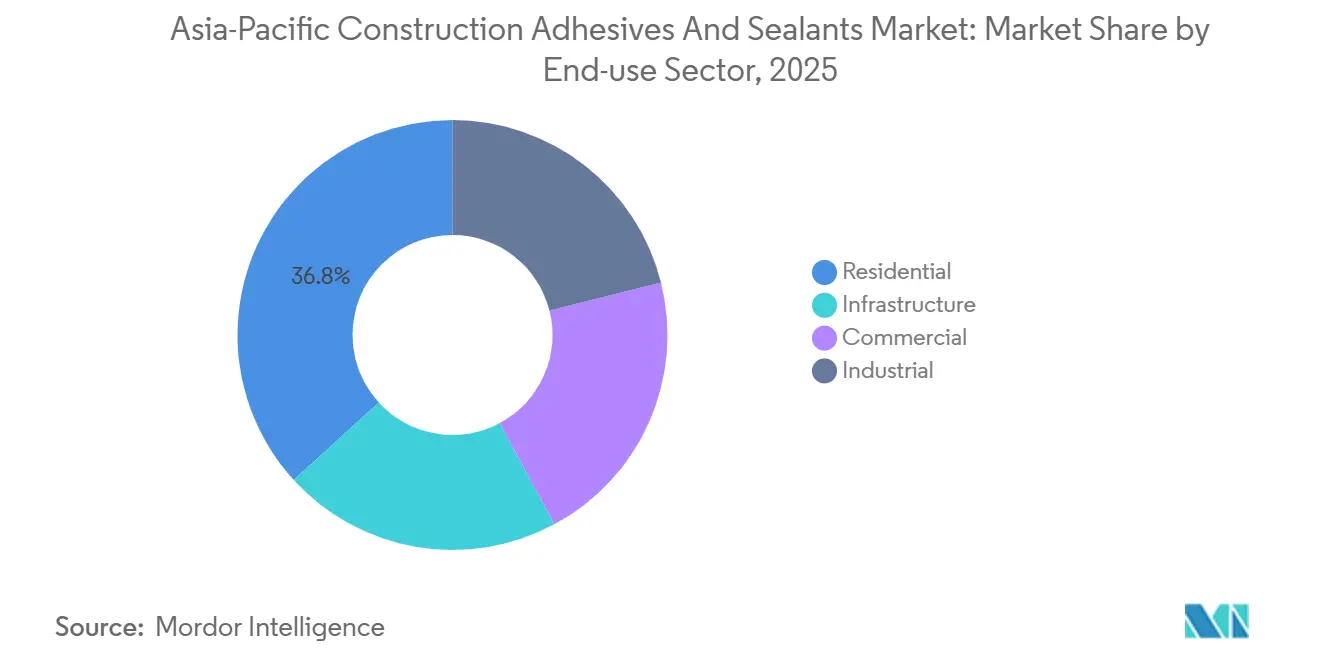
- By end-use sector, residential construction accounted for 36.78% of 2025 demand; infrastructure end-use is projected to expand at 7.23% CAGR during the forecast period (2026-2031) as fiscal stimulus focuses on climate-resilient assets.
- By geography, China held a market share of 46.74% in 2025 and India's share is expected to increase at a CAGR of 6.89% during the forecast period (2026-2031).
Note: Market size and forecast figures in this report are generated using Mordor Intelligence’s proprietary estimation framework, updated with the latest available data and insights as of January 2026.
Asia-Pacific Construction Adhesives And Sealants Market Trends and Insights
Drivers Impact Analysis*
| Driver | (~) % Impact on CAGR Forecast | Geographic Relevance | Impact Timeline |
|---|---|---|---|
| Infrastructure megaproject pipeline across APAC | +1.2% | China, India, ASEAN-5 (Indonesia, Thailand, Vietnam, Philippines, Malaysia), spill-over to Australia | Medium term (2–4 years) |
| Green-building codes boosting low-VOC sealants demand | +0.9% | Global, with early adoption in China (Beijing, Shanghai), Singapore, Hong Kong, Japan | Short term (≤ 2 years) |
| Rapid growth of modular and prefab construction | +0.8% | India, China, Vietnam, Indonesia, with pilot projects in Australia and Singapore | Medium term (2–4 years) |
| E-commerce warehousing fuelling industrial flooring adhesives | +0.7% | China, India, Southeast Asia (Vietnam, Indonesia, Thailand), Australia | Short term (≤ 2 years) |
| Substitution of mechanical fasteners by structural adhesives | +0.6% | Japan, South Korea, Australia, Singapore, with adoption spreading to China tier-1 cities | Long term (≥ 4 years) |
| Ageing building stock retrofits in mature Asia-Pacific economies | +0.5% | Japan, Australia, Singapore, South Korea, Hong Kong | Medium term (2–4 years) |
| Source: Mordor Intelligence | |||


Infrastructure Megaproject Pipeline Across APAC
Thailand’s USD 36 billion land-bridge will specify marine-grade polysulfide sealants for tidal-zone piers and tunnel linings[1]Ministry of Finance Thailand, “Land Bridge Project Factsheet,” mof.go.th. Vietnam’s Thu Thiem 4 Bridge used expansion-joint systems that endured 100,000 compression cycles, a performance now replicated in metro-viaduct projects. BMI forecasts regional construction spending to climb from USD 2,429 billion in 2025 to USD 2,580.4 billion in 2026, led by India at 6.2% growth. Automated adhesive-dispensing systems are trimming on-site labor by 30% and lifting bond-strength consistency by 40%, raising entry barriers for smaller blenders. Collectively, megaproject pipelines anchor long-run visibility that sustains the Asia-Pacific Construction Adhesives and Sealants market.
Green-Building Codes Boosting Low-VOC Sealants Demand
China’s GB 33372-2020 sets differentiated VOC ceilings, and Beijing’s DB11/1983-2022 tightens limits to 50 g/L for interior applications, effectively banning solvent-borne mastics in state projects[2]Beijing Municipal Ecology Bureau, “DB11/1983-2022 Standard,” beijingstandards.gov.cn. Hong Kong’s Construction Industry Council certification caps exterior sealant emissions at 100 g/L, favoring water-borne acrylics and modified-silane polymers. Japan’s 4VOC voluntary registry lets architects select products with verified emission data, dovetailing with JPY 208.8 billion (USD 1.395 billion) allocated for seismic upgrades in FY2025. Singapore’s Green Building Masterplan requires 80% of new builds to achieve Green Mark Platinum by 2030, incentivizing Environmental Product Declarations that multinational suppliers can readily furnish. These codes accelerate substitution toward water-borne chemistries, expanding the Asia-Pacific Construction Adhesives and Sealants market.
Rapid Growth of Modular and Prefab Construction
India’s affordable-housing initiatives use fast-setting epoxies that reach handling strength in 6 minutes, cutting on-site labor 30%. China produced roughly 1 billion m² of prefabricated buildings in 2024, with provinces mandating 30% prefab content on projects above 10,000 m². Vietnam and Indonesia deploy donor-funded modular schools that specify EMICODE EC1 Plus adhesives, placing MAPEI’s Ultrabond ECO MS 4 LVT in pole position. Panel manufacturers negotiate annual supply contracts for viscosity-controlled products, while small fabricators still rely on regional distributors with flexible minimum orders. Prefab momentum therefore tilts demand toward high-reactivity polyurethane and epoxy systems inside the Asia-Pacific Construction Adhesives and Sealants market.
E-Commerce Warehousing Fuelling Industrial Flooring Adhesives
Fulfillment centers run forklifts that impose dynamic loads, steering developers to polyurethane screeds that tolerate moisture-vapor-emission rates above 12 lb/1,000 ft²/24 hour. TEC’s Fortane LVT-1F maintains bond integrity at 99% relative humidity, eliminating vapor-barrier cost lines. India absorbed 50 million ft² of industrial space in 2025, and tier-2 hubs such as Pune and Ahmedabad account for 40% of new supply. Epoxy flooring adhesives add 15-20% to upfront budgets but stretch maintenance cycles from three to seven years, a trade-off institutional landlords now favor. The logistics boom thus reinforces volume growth in the Asia-Pacific Construction Adhesives and Sealants market.
Restraints Impact Analysis*
| Restraint | (~) % Impact on CAGR Forecast | Geographic Relevance | Impact Timeline |
|---|---|---|---|
| Volatile petrochemical feedstock prices | -0.8% | Global, with acute impact in Northeast Asia (China, Japan, South Korea) and Southeast Asia dependent on Middle East naphtha | Short term (≤ 2 years) |
| Stricter VOC limits on solvent-borne technologies | -0.5% | China (Beijing, Shanghai), Hong Kong, Singapore, Japan, with gradual adoption in India and ASEAN | Medium term (2–4 years) |
| Silicone monomer supply disruptions in China | -0.4% | Global, with concentrated impact on high-performance sealant segments in Japan, South Korea, Australia, Singapore | Short term (≤ 2 years) |
| Skilled labour shortage for advanced application methods | -0.3% | Indonesia, Vietnam, Philippines, India, with localized gaps in Australia and Singapore for specialized trades | Long term (≥ 4 years) |
| Source: Mordor Intelligence | |||
Volatile Petrochemical Feedstock Prices
Ethylene margins slid 50% in H2 2024 as capacity additions outpaced polymer demand. A 90% shipping-lane closure scenario in the Strait of Hormuz during mid-2025 forced South Korean crackers to idle units, slashing regional olefin supply. Adhesive formulators cannot hedge beyond six months because forward curves lack liquidity, so spot price spikes squeeze margins. Bio-naphtha pilots in Thailand and Malaysia trade at 30-40% premiums, confining uptake to green-building showcases. Feedstock volatility, therefore, tempers margin expansion inside the Asia-Pacific Construction Adhesives and Sealants market.
Stricter VOC Limits on Solvent-Borne Technologies
Beijing’s 50 g/L interior VOC cap renders many solvent-borne mastics non-compliant in municipal projects. Hong Kong’s 100 g/L exterior ceiling and Singapore’s Green Mark Platinum pathway tighten procurement filters that smaller blenders struggle to meet. Reformulation toward water-borne systems demands capital and technical resources that thin-margin players may lack, driving consolidation. In regions with lax enforcement, legacy solvent products still circulate, but cross-border contractors impose stricter corporate standards, slowly retiring high-VOC chemistries. The transition weighs on near-term growth for solvent segments in the Asia-Pacific Construction Adhesives and Sealants market.
*Our forecasts treat driver/restraint impacts as directional, not additive. The impact forecasts reflect baseline growth, mix effects, and variable interactions.
Segment Analysis
By Resin Type: Polyurethane Retains Leadership as Silicone Surges
Polyurethane captured 25.14% of 2025 revenue, anchoring its leadership across roofing, insulation, and flooring. Silicone is set to outpace at 7.18% CAGR during the forecast period (2026-2031) because supertall façades require ±25% movement plus UV stability. Neutral-cure profiles avert corrosion on anodized aluminum, making them the default for curtain-wall contractors. Epoxy remains a niche, but its 3,500 PSI tensile strength enables weld-free prefab steel connections, saving hot-work permits and insurance surcharges.
Volume dynamics pivot on sustainability. Dow’s carbon-neutral silicone service provides Life-Cycle-Assessment documentation that eases Green Mark Platinum submissions, tilting premium projects toward silicone. Acrylics dominate luxury-vinyl-tile installations, especially in e-commerce warehouses where pressure-sensitive tack accelerates handover. Commodity VAE dispersions in dry-mix mortars face price pressure as Chinese overcapacity drags margins. Cyanoacrylates and hot-melts stay confined to modular-factory lines where instant tack justifies price premiums. Each resin tier, therefore, targets discrete value pools inside the Asia-Pacific Construction Adhesives and Sealants market.


By Technology: Sealants Dominate While Water-Borne Advances Rapidly
Sealant (1K and 2K) combined for 44.37% of 2025 sales, reflecting reliance on weatherproofing and structural glazing in seismic-prone geographies. One-component silicones are prevalent in residential façades due to application simplicity, whereas two-component systems prevail on bridges and tunnels that demand extended pot life. The Asia-Pacific Construction Adhesives and Sealants market share for water-borne adhesives is poised to climb at a CAGR of 7.32% during the forecast period (2026-2031). Beijing’s procurement standards already enforce near-zero-VOC interiors, pushing contractors toward water-borne acrylics.
Reactive chemistries, moisture-cure polyurethanes, and two-part epoxies are stealing share in prefab factories where six-minute handling strength boosts throughput. Hot-melts remain small because outdoor durability concerns persist, but they retain popularity in furniture edge-banding. Enforcement gaps between tier-1 and interior provinces create dual pricing structures: solvent-borne acrylics linger in rural zones, while city-center towers specify water-borne or modified-silane systems. This policy gradient will continue to shape technology substitution inside the Asia-Pacific Construction Adhesives and Sealants market.
By Application: Flooring Rules Today, Infrastructure Joints Accelerate
Flooring and tiling owned 39.83% of the 2025 volume as luxury-vinyl-tile installations proliferated in residential renovations and automated warehouses. Infrastructure joints, such as bridges and tunnels, exhibit the fastest 7.18% CAGR for the forecast period (2026-2031) owing to seismic-upgrade mandates in Japan, Australia, and Singapore. Roofing demand ties closely to green-roof policies in Hong Kong and Singapore, requiring root-resistant polyurethane systems that withstand typhoon uplift pressures.
Tunnel linings now specify polyurethane foam backer rods plus two-component elastomeric sealants to manage water ingress at 10 bar pressure. Flooring chemistries are migrating toward moisture-tolerant adhesives like TEC’s Fortane LVT-1F, which negate vapor barriers on high groundwater sites. In retrofits, carbon-fiber-reinforced polymer strips bonded with epoxies allow vertical extensions without overloading foundations, a technique applied on Sydney’s Quay Quarter Tower. These nuanced requirements generate resin-specific tailwinds inside the Asia-Pacific Construction Adhesives and Sealants market.
By End-use Sector: Residential Dominates but Infrastructure Gains Momentum
Residential projects commanded 36.78% of 2025 demand as aging stock in Japan and new-build apartments in China consumed contact adhesives and sealants. Infrastructure will rise fastest at 7.23% CAGR during the forecast period (2026-2031) because metro extensions, port expansions, and renewable-energy substations all require long-life joint systems. Japan’s Q3 FY2025 renovation orders jumped 24.4% YoY to JPY 4.05 trillion (USD 25.92 billion), lifting interior-finish adhesive pull-through. Commercial refurbishment rebounds on embodied-carbon targets; Sydney’s Invicta House retrofit reused 65% of its structure, banking carbon savings verified by a third-party Life Cycle Assessment.
Industrial demand rides e-commerce. Developers accept epoxy adhesives’ 15-20% cost premium because maintenance intervals stretch from three to seven years, a boon for institutional landlords. Government design-build-finance-operate concessions now stipulate 25-year durability warranties, nudging specifiers toward premium resin systems. Meanwhile, skilled-labor shortages in Indonesia and Vietnam constrain the adoption of two-component products, so suppliers run applicator academies to seed demand. These cross-currents sustain growth in the Asia-Pacific Construction Adhesives and Sealants market.
Geography Analysis
China led regional share with 46.74% in 2025, but moderates to mid-single-digit growth as residential construction cools. Producers such as Sika expanded Xi’an mortar output to target metro and supertall façade projects. Strict local VOC rules in Beijing and Shanghai accelerate water-borne adoption, whereas inland provinces still rely on solvent-borne acrylics due to enforcement gaps. Silicone supply bottlenecks linked to dimethyl-carbonate volatility have prompted some curtain-wall contractors to pre-qualify polyurethane back-ups, diversifying resin risk.
India delivers the fastest 6.89% CAGR through 2031 on the back of its USD 1.5 trillion National Infrastructure Pipeline. Modular-housing roll-outs in tier-2 cities drive polyurethane and epoxy uptake in off-site factories. Government incentives for affordable-housing developers demand 30-year weatherproof warranties, fortifying demand for high-grade joint sealants. Domestic champion Pidilite leverages its technology spending and its Grupo Puma venture to supply finishing systems at scale.
In Japan, renovation outlays reached JPY 4.05 trillion (USD 25.92 billion) that year, up 24.4% YoY, and interior-finish adhesives benefited from a 23% lift in plumbing refurbishments. High-rise façades also require Class 25 neutral-cure silicones that preserve elasticity at -50°C, reinforcing premium demand. Aging residential stock spurs sanitary-fixture sealant volumes as households upgrade bathrooms to universal design standards.
Southeast Asia, Indonesia, Thailand, Vietnam, Philippines remain a hotbed for above-average growth. Indonesia’s 8.3 million-strong construction labor force hosts fewer than 1 million certified tradespeople, capping adoption of two-component systems. Mowilex’s 2025 academy trained 210 applicators, and the labor ministry targets 12 million certified workers by 2030. Thailand’s USD 36 billion land bridge demands polysulfide and polyurethane sealants to resist saltwater intrusion. Vietnam’s plan to add 3,000 km of expressways by 2030 lifts bridge-joint demand.
Australia and South Korea present mature yet opportunity-rich niches. Sydney’s Quay Quarter Tower retrofit demonstrated epoxy-bonded carbon-fiber upgrades can halve embodied carbon compared with demolition-and-rebuild scenarios. Wacker’s Jincheon plant in South Korea now ranks among the world’s largest silicone-sealant facilities, cutting lead times for Class 25 neutral-cure products. Both countries channel public-private partnerships into metro expansions that specify 20-year durability warranties, reinforcing volume for premium chemistries.
Competitive Landscape
The Asia-Pacific Construction Adhesives and Sealants market is moderately concentrated. Labor and training surface as competitive wedges. Applicator academies run by Sika, Wacker, and Pidilite mitigate skilled-labor shortages and lock in brand loyalty through equipment-leasing programs. Automated mixing pumps embedded with IoT sensors feed real-time viscosity data, reducing rework by 25% and differentiating suppliers who invest in digital twins. These dynamics collectively sculpt rivalry inside the Asia-Pacific Construction Adhesives and Sealants market.
Asia-Pacific Construction Adhesives And Sealants Industry Leaders
3M
Henkel AG & Co. KGaA
Sika AG
Arkema
H.B. Fuller Company
- *Disclaimer: Major Players sorted in no particular order

Recent Industry Developments
- January 2026: Pidilite Industries Limited announced a plan to set up a new adhesives and waterproofing manufacturing facility in Punjab. The new plant will produce products based on the core adhesives and waterproofing portfolios offered by Pidilite, which are used by retail and institutional purchasers of housing, infrastructure, and industrial markets.
- July 2025: TEX YEAR INDUSTRIES INC. opened and launched Asia’s first biodegradable hot melt adhesive dedicated production line, along with the newly established Innovation Building, a dedicated research and development and production facility at its Tex Year Taoyuan factory.


Asia-Pacific Construction Adhesives And Sealants Market Report Scope
Adhesives are substances that join or bond two or more surfaces together by sticking to them. They are a type of material that provides cohesion between different substrates, creating a durable and often permanent bond. Adhesives are used in various applications, from everyday household use to industrial and technological processes.
Sealants are materials used to fill, seal, or close gaps and joints to prevent the passage of liquids or gases. They are designed to provide a barrier against moisture, air, dust, and other environmental elements. Sealants are commonly used in construction, automotive, aerospace, and other industries to create airtight and watertight seals and provide insulation and protection.
The Asia-Pacific Construction Adhesives and Sealants market is segmented by resin type, technology, application, end-use sector, and geography. By resin type, the market is segmented into acrylic, cyanoacrylate, epoxy, polyurethane, silicone, VAE/EVA, and other resins. By technology, the market is segmented into water-borne, solvent-borne, reactive, hot-melt, and sealants (1K and 2K). By application, the market is segmented into flooring and tiling, roofing, wall panels and facades, insulation and weatherproofing, and infrastructure joints (bridges and tunnels). By end-use sector, the market is segmented into residential, commercial, industrial, and infrastructure. The report also covers the market size and forecasts for construction adhesives and sealants in 11 countries across the region. The market sizes and forecasts are provided in terms of value (USD).
By Resin
| Acrylic |
| Cyanoacrylate |
| Epoxy |
| Polyurethane |
| Silicone |
| VAE/EVA |
| Others |
By Technology
| Water-borne |
| Solvent-borne |
| Reactive |
| Hot-melt |
| Sealants (1K and 2K) |
By Application
| Flooring and Tiling |
| Roofing |
| Wall Panels and Facades |
| Insulation and Weatherproofing |
| Infrastructure Joints (bridges and tunnels) |
By End-use Sector
| Residential |
| Commercial |
| Industrial |
| Infrastructure |
By Country
| Australia |
| China |
| India |
| Indonesia |
| Japan |
| Malaysia |
| Singapore |
| South Korea |
| Thailand |
| Vietnam |
| Philippines |
| Rest of Asia-Pacific |
| By Resin | Acrylic |
| Cyanoacrylate | |
| Epoxy | |
| Polyurethane | |
| Silicone | |
| VAE/EVA | |
| Others | |
| By Technology | Water-borne |
| Solvent-borne | |
| Reactive | |
| Hot-melt | |
| Sealants (1K and 2K) | |
| By Application | Flooring and Tiling |
| Roofing | |
| Wall Panels and Facades | |
| Insulation and Weatherproofing | |
| Infrastructure Joints (bridges and tunnels) | |
| By End-use Sector | Residential |
| Commercial | |
| Industrial | |
| Infrastructure | |
| By Country | Australia |
| China | |
| India | |
| Indonesia | |
| Japan | |
| Malaysia | |
| Singapore | |
| South Korea | |
| Thailand | |
| Vietnam | |
| Philippines | |
| Rest of Asia-Pacific |


Market Definition
- End-user Industry - Residential construction, commercial construction, public buildings, industrial buildings and infrastructure projects are considered under the construction industry.
- Product - All adhesive and sealant products used in construction industry are considered in the market studied
- Resin - Under the scope of the study, resins like Polyurethane, Epoxy, Acrylic, Cyanoacrylate, VAE/EVA, and Silicone are considered
- Technology - For the purpose of this study, Water-borne, Solvent-borne, Reactive, Hot Melt, and Sealants technologies are taken into consideration.
| Keyword | Definition |
|---|---|
| Hot-melt Adhesive | Hot melt adhesives are generally 100% solid formulations, based on thermoplastic polymers. They are solid at room temperature and are activated upon heating above their softening point, at which stage they are liquid, and hence, can be processed. |
| Reactive Adhesive | A reactive adhesive is made up of monomers that react in the adhesive curing process and do not evaporate from the film during use. Instead, these volatile components become chemically incorporated into the adhesive. |
| Solvent-borne Adhesive | Solvent-borne adhesives are mixtures of solvents and thermoplastic, or slightly cross-linked polymers, such as polychloroprene, polyurethane, acrylic, silicone, and natural and synthetic rubbers (elastomers). |
| Water-borne Adhesive | Water-borne adhesives use water as a carrier or diluting medium to disperse a resin. They are set by allowing the water to evaporate or be absorbed by the substrate. These adhesives are compounded with water as a diluent, rather than a volatile organic solvent. |
| UV Cured Adhesive | UV curing adhesives induce curing and create a permanent bond without heating by using ultraviolet (UV) light or other radiation sources. An aggregation of monomers and oligomers is cured or polymerized by ultraviolet (UV) or visible light in a UV adhesive. Because UV is a radiating energy source, UV adhesives are often referred to as radiation curing or rad-cure adhesives. |
| Heat-resistant Adhesive | Heat-resistant Adhesives refer to those that do not break down under high temperatures. One aspect of a complicated system of circumstances is the adhesive's capacity to withstand disintegration brought on by high temperatures. As the temperature rises, adhesives may liquefy. They can withstand stresses resulting from differing coefficients of expansion and contraction, which might be an additional advantage. |
| Reshoring | Reshoring is the practice of moving commodity production and manufacturing back to the nation where the business was founded. Onshoring, inshoring, and back shoring are further terms used. Offshoring, the practice of producing items abroad to lower labor and manufacturing costs, is the opposite of this. |
| Oleochemicals | Oleochemicals are compounds produced from biological oils or fats. They resemble petrochemicals, which are substances made from petroleum. The oleochemical business is built on the hydrolysis of oils or fats. |
| Nonporous Materials | Nonporous materials are substances that do not permit the passage of liquid or air. Nonporous materials are those that are not porous, such as glass, plastic, metal, and varnished wood. Since no air can get through, less airflow is required to raise these materials, negating the requirement for high airflow. |
| EU-Vietnam Free Trade Agreement | A trade agreement and an investment protection agreement were concluded between the European Union and Vietnam on June 30, 2019. |
| VOC content | Compounds with limited solubility in water and high vapor pressure are known as Volatile Organic Compounds (VOCs). Many VOCs are human-made chemicals that are used and produced in the manufacture of paints, pharmaceuticals, and refrigerants. |
| Emulsion Polymerization | Emulsion polymerization is a method of producing polymers or connected groups of smaller chemical chains known as monomers, in a water solution. The method is often used to make water-based paints, adhesives, and varnishes, in which the water stays with the polymer and is marketed as a liquid product. |
| 2025 National Packaging Targets | In 2018, the Australian Environment Ministry set the following 2025 National Packaging Targets: 100% of the packaging must be reusable, recyclable, or compostable by 2025, 70% of plastic packaging must be recycled or composted by 2025, 50% of average recycled content must be included in packaging by 2025, and problematic and unnecessary single-use plastic packaging must be phased out by 2025. |
| Russian Government’s Import Substitution Policy | The Western sanctions suspended the distribution of several high-tech items to Russia, including those required by the raw material export sectors and the military-industrial complex. In response, the government launched an "import substitution" scheme, appointing a special commission to oversee its implementation in early 2015. |
| Paper Substrate | Paper substrates are paper sheets, reels, or boards with a base weight of up to 400 g/m2 that has not been converted, printed or otherwise altered. |
| Insulation Material | A material that inhibits or blocks heat, sound, or electrical transmission is known as Insulation Material. The variety of insulation materials includes thick fibers like fiberglass, rock and slag wool, cellulose, and natural fibers as well as stiff foam boards and sleek foils. |
| Thermal Shock | A temperature change known as thermal shock generates stress in a material. It commonly results in material breakdown and is especially prevalent in brittle materials like ceramics. When there is a quick temperature change, either from hot to cold or vice versa, this process occurs abruptly. It occurs more frequently in materials with poor heat conductivity and insufficient structural integrity. |


Research Methodology
Mordor Intelligence follows a four-step methodology in all our reports.
- Step-1: Identify Key Variables: The quantifiable key variables (industry and extraneous) pertaining to the specific product segment and country are selected from a group of relevant variables & factors based on desk research & literature review; along with primary expert inputs. These variables are further confirmed through regression modeling (wherever required).
- Step-2: Build a Market Model: In order to build a robust forecasting methodology, the variables and factors identified in Step-1 are tested against available historical market numbers. Through an iterative process, the variables required for market forecast are set and the model is built on the basis of these variables.
- Step-3: Validate and Finalize: In this important step, all market numbers, variables and analyst calls are validated through an extensive network of primary research experts from the market studied. The respondents are selected across levels and functions to generate a holistic picture of the market studied.
- Step-4: Research Outputs: Syndicated Reports, Custom Consulting Assignments, Databases & Subscription Platforms


