Market Overview
| Study Period | 2020 - 2031 |
|---|---|
| Forecast Data Period | 2026 - 2031 |
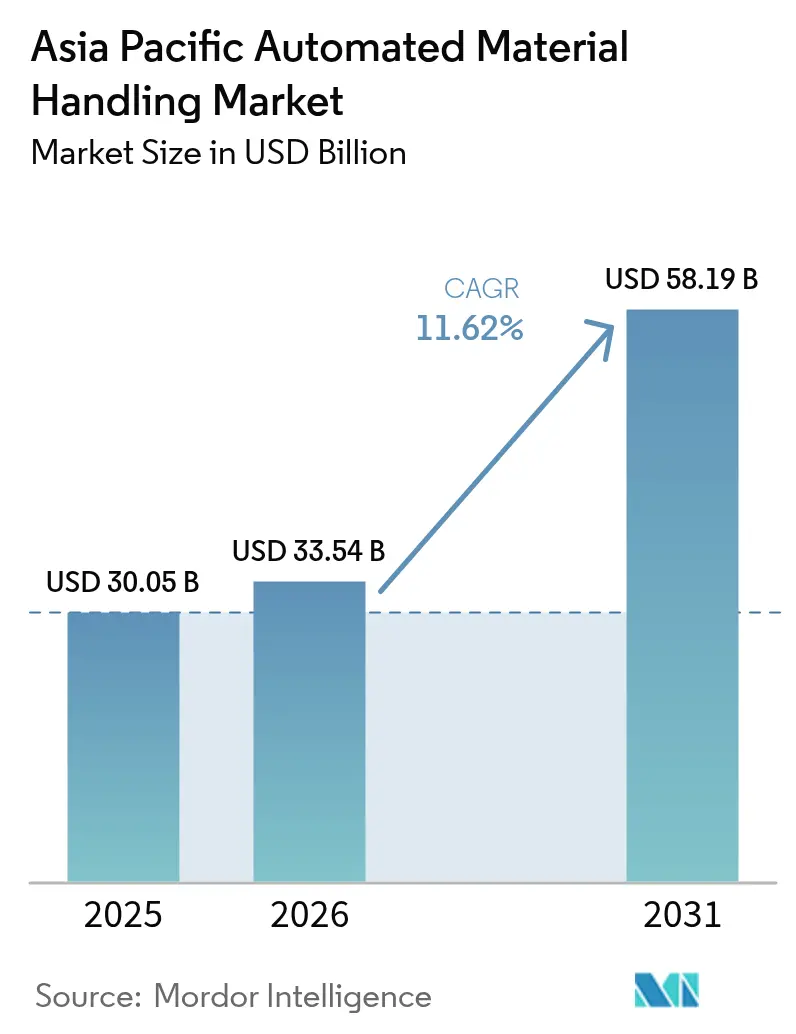
| Base Year Market Size (2025) | USD 30.05 Billion |
| Market Size (2026) | USD 33.54 Billion |
| Market Size (2031) | USD 58.19 Billion |
| Growth Rate (2026 - 2031) | 11.62% CAGR |
| Market Concentration | Medium |
Major Players *Disclaimer: Major Players sorted in no particular order Image © Mordor Intelligence. Reuse requires attribution under CC BY 4.0. | |
Asia Pacific Automated Material Handling Market Analysis by Mordor Intelligence
Asia Pacific automated material handling market size in 2026 is estimated at USD 33.54 billion, growing from 2025 value of USD 30.05 billion with 2031 projections showing USD 58.19 billion, growing at 11.62% CAGR over 2026-2031. Rapid digitalization of regional logistics networks, steady Industry 4.0 rollouts, and persistent e-commerce growth underpin this expansion. Capital programs such as China’s USD 1.4 trillion Manufacturing 2025 initiative and ASEAN’s Digital Economy Framework Agreement push factories and warehouses to embed autonomous equipment that bridges information and physical flows. Hardware continues to dominate spending, yet software accelerates fastest as operators pivot toward data-driven orchestration. Mobile robots lead equipment adoption because they reconfigure quickly when order profiles shift, while labor shortages in developed economies and compliance mandates in pharmaceuticals strengthen the business case for autonomy. China retains the largest regional share, but India now delivers the highest growth rate as production-linked incentives stimulate automation investments.
Key Report Takeaways
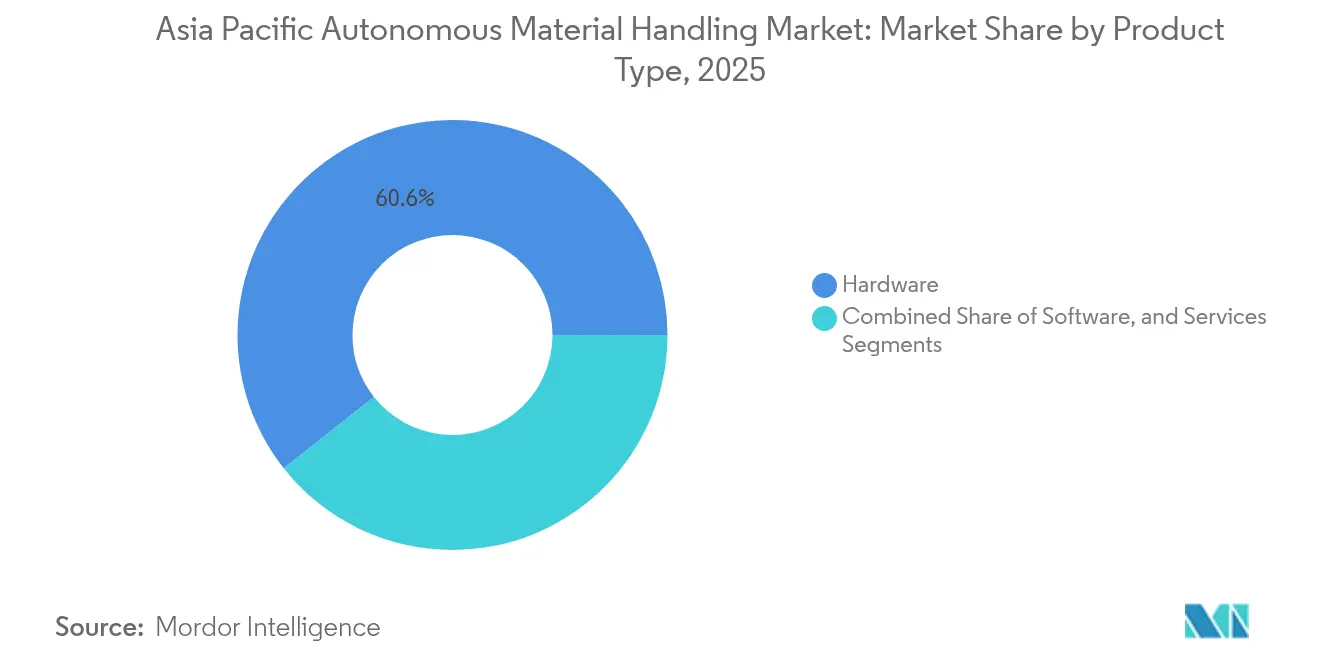
- By product type, hardware captured 60.63% share of the Asia Pacific automated material handling market size in 2025; software is forecast to expand at a 13.32% CAGR to 2031.
- By equipment type, mobile robots held 33.22% share of the Asia Pacific automated material handling market size in 2025, while automated storage and retrieval systems are projected to grow at 10.86% CAGR through 2031.
- By end-user vertical, retail, warehousing, and distribution commanded a 27.41% share of the Asia Pacific automated material handling market size in 2025; pharmaceuticals will post the fastest 11.89% CAGR between 2026 and 2031.
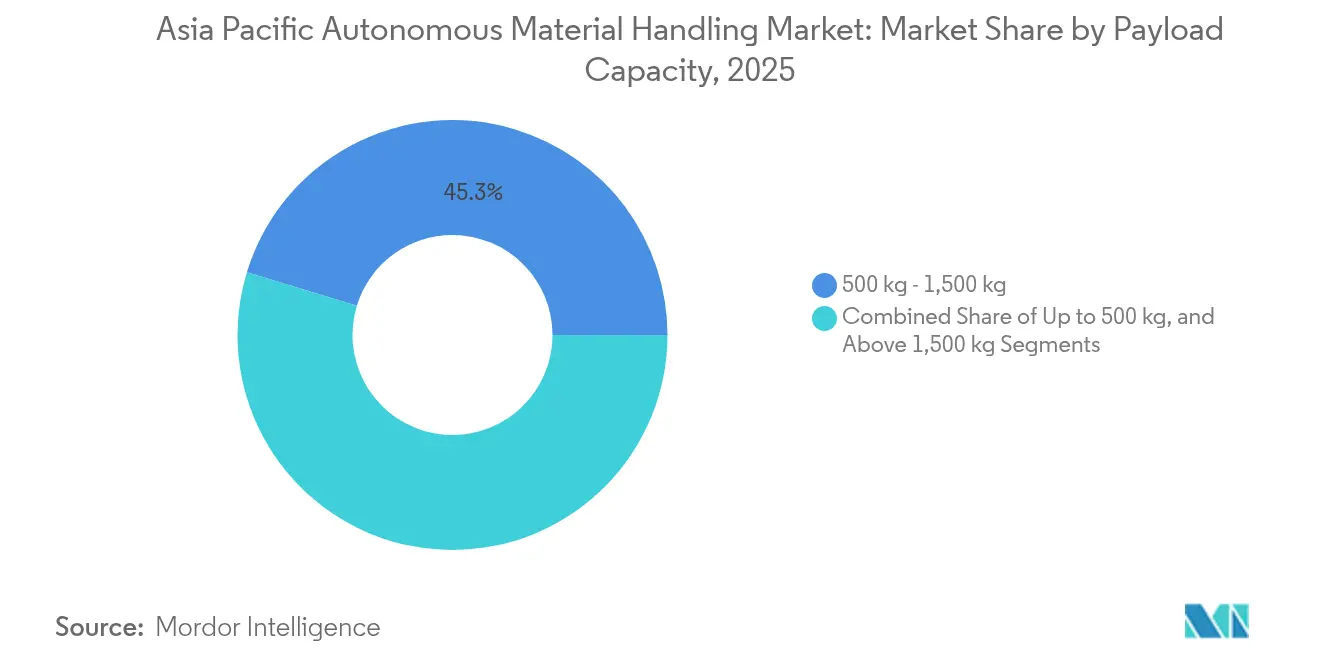
- By payload capacity, 500 kg-1,500 kg systems led with 45.28% share of the Asia Pacific automated material handling market size in 2025, whereas sub-500 kg platforms are expected to grow at a 13.18% CAGR.
- By navigation technology, laser guidance maintained a 37.45% share of the Asia Pacific automated material handling market size in 2025; SLAM-based natural feature guidance is projected to rise at a 12.08% CAGR to 2031.
- By region, China accounted for 41.92% share of the Asia Pacific automated material handling market size in 2025; India is projected to advance at a 12.19% CAGR through 2031.
Note: Market size and forecast figures in this report are generated using Mordor Intelligence’s proprietary estimation framework, updated with the latest available data and insights as of 2026.
Asia Pacific Automated Material Handling Market Trends and Insights
Drivers Impact Analysis*
| Driver | (~) % Impact on CAGR Forecast | Geographic Relevance | Impact Timeline |
|---|---|---|---|
| Increasing Industry 4.0 Investments in Logistics Facilities | +2.8% | China, Japan, South Korea, Singapore | Medium term (2-4 years) |
| Proliferation of E-Commerce Fulfillment Centers | +3.1% | China, India, Southeast Asia | Short term (≤2 years) |
| Rapid Adoption of Autonomous Mobile Robots in Warehousing | +2.4% | Core Asia-Pacific markets | Medium term (2-4 years) |
| Rising Labor Cost and Scarcity in Asia Pacific | +2.2% | Japan, South Korea, Singapore, urban China | Long term (≥4 years) |
| Government Incentives for Smart Industrial Parks in ASEAN | +1.1% | Thailand, Malaysia, Indonesia, Vietnam | Medium term (2-4 years) |
| Integration of 5G Private Networks Enabling Real-Time Fleet Coordination | +0.4% | China, South Korea, Japan, Singapore | Long term (≥4 years) |
| Source: Mordor Intelligence | |||
Increasing Industry 4.0 Investments in Logistics Facilities
Regional manufacturers channel record budgets into cyber-physical upgrades that unite production lines, warehouse control systems, and enterprise software. China’s annual smart-factory spend already exceeds USD 200 billion, while Japan’s Society 5.0 program earmarks USD 130 billion for industrial IoT.[1]China State Council, “Made in China 2025 Strategy,” gov.cn These commitments translate directly into orders for autonomous tuggers, shuttles, and forklifts that synchronize material flows with real-time planning systems. Singapore’s Smart Nation agenda shows how public co-investment catalyzes adoption: 40% of the city-state’s warehouses had deployed autonomous mobile robots by 2024. Operators now view integrated material handling as a prerequisite for extracting promised Industry 4.0 efficiency gains.
Proliferation of E-Commerce Fulfillment Centers
Asia Pacific online retail penetration rose to 18.3% of total sales in 2024, outpacing all other regions. Massive order surges compress delivery windows, forcing fulfillment hubs to automate picking, sorting, and dispatch. China’s 2024 Singles Day moved 1.48 billion parcels within 24 hours, a feat achievable only through high-throughput autonomous fleets. Platforms such as JD.com now operate more than 1,000 automated warehouses, prompting regional peers Shopee and Lazada to replicate similar robotics playbooks.[2]JD Logistics, “JD Logistics Announces Third Quarter 2024 Results,” ir.jd.com Each new fulfillment node spurs parallel investments in upstream and downstream logistics sites, sustaining a virtuous demand cycle for autonomous solutions.
Rapid Adoption of Autonomous Mobile Robots in Warehousing
Pilot projects have matured into deployments counted in the thousands. Leading providers report productivity gains of 200%-400% over manual picking, mainly through travel-time reduction and real-time task allocation. Geek+ alone has shipped over 30,000 robots across the Asia Pacific.[3]Geek+ Technology, “Geek+ Completes Series E Funding Round of Over USD 100 Million,” geekplus.com Chinese innovators VisionNav and Quicktron supply localized variants that address narrow aisles, mezzanine levels, or outdoor yards, broadening potential use cases. Facility managers prefer AMRs because they re-route easily when SKU mixes or peak seasons change, protecting automation investments against demand volatility.
Rising Labor Cost and Scarcity in the Asia Pacific
Demographics tighten warehouse labor pools in mature economies. Japan faces an estimated 2.8 million shortfall in logistics personnel, and South Korean warehouse wages inflate at roughly 15% each year. Singapore’s foreign-labor quotas amplify the crunch, urging firms to maintain throughput with 30% fewer workers. Autonomous fleets now deliver payback within 18 months, a dramatic improvement from 36 months in 2020. For many operators, robots have shifted from optional efficiency upgrades to essential continuity tools.
Restraints Impact Analysis*
| Restraint | (~) % Impact on CAGR Forecast | Geographic Relevance | Impact Timeline |
|---|---|---|---|
| High Upfront Capex of Integrated Automation Projects | -1.8% | Emerging Asia-Pacific economies, SME segments | Short term (≤2 years) |
| Limited Interoperability Standards Across Vendor Ecosystems | -1.2% | Global multi-vendor sites | Medium term (2-4 years) |
| Delayed Port Infrastructure Digitalization in Emerging Economies | -0.8% | Indonesia, Thailand, Malaysia, Philippines | Long term (≥4 years) |
| Data Security Concerns in Cloud-Managed Fleets | -0.6% | Regulated industries worldwide | Medium term (2-4 years) |
| Source: Mordor Intelligence | |||
High Upfront Capex of Integrated Automation Projects
Deploying end-to-end systems often requires USD 2-5 million for a mid-size site, excluding building modifications and change-management costs. Indonesian warehouses earning under USD 10 million annually view such commitments as 25%-50% of yearly turnover. Financing channels remain limited, and robotics-as-a-service plans, while reducing entry fees, can inflate the total cost of ownership. Until equipment prices fall or credit access widens, smaller operators may delay adoption, moderating overall market growth.
Limited Interoperability Standards Across Vendor Ecosystems
Warehouse managers integrating conveyors, AMRs, and shuttle systems from different suppliers encounter proprietary interfaces that complicate command hand-offs. The Industrial Internet Consortium promotes open frameworks, yet intellectual-property concerns keep major vendors invested in closed architectures. As software intelligence grows more valuable than hardware, vendors guard algorithms that orchestrate fleets, hindering cross-brand collaboration. Interoperability challenges increase integration timelines and costs, deterring buyers who favor incremental expansion.
*Our forecasts treat driver/restraint impacts as directional, not additive. The impact forecasts reflect baseline growth, mix effects, and variable interactions.
Segment Analysis
By Product Type: Software Drives Intelligence Revolution
Hardware held 60.63% of the Asia Pacific automated material handling market share in 2025, reaffirming that physical assets still anchor operations. Yet software revenue will climb at a 13.32% CAGR through 2031 as enterprises pursue data-centric performance boosts. The autonomous material handling market size for software is projected to widen each year as predictive maintenance, energy optimization, and AI-based routing stack on top of existing fleets. Services revenues grow steadily because rising system complexity pushes demand for consulting, integration, and lifecycle support. Vendors such as KION expanded into software by acquiring Dematic, illustrating how mechanical-first firms pivot toward holistic solutions.
Hardware growth decelerates from the 2019-2024 period because many first-wave installations are complete. Operators now refine returns through software-enabled tweaks rather than large capital swaps. Regulatory focus also shifts toward firmware safety checks in ISO 3691-4, amplifying the value of code quality over steel strength. As regional networks mature, software-centric offerings should capture incremental budgets while hardware refresh cycles lengthen, deepening the installed base’s stickiness.


By Equipment Type: Mobile Robots Lead Flexibility Revolution
Mobile robots controlled 33.22% of equipment demand in 2025 and will grow at a 12.21% CAGR through 2031. These platforms lower entry barriers because they require minimal fixed infrastructure, enabling brownfield sites to automate aisles without costly retrofits. Within the Asia Pacific automated material handling market size for equipment, automated storage and retrieval systems (ASRS) still corner high-density use cases, while conveyors remain indispensable for bulk flow. Nonetheless, AMRs win share by excelling in variable SKUs and rapid SKU expansion environments.
The shift from automated guided vehicles to natural-navigation AMRs underscores a broader preference for flexibility. AMRs equipped with vision sensors and AI algorithms plot adaptive routes, sidestepping rigid guidepaths. Fixed systems still serve profitable niches, especially where high throughput outweighs change frequency. Yet survey data confirm budget allocations moving toward software-rich mobile platforms that integrate seamlessly with warehouse execution systems. Compliance with IEC 61508 functional safety elevates trust in mobile options across regulated industries.
By End-User Vertical: Pharmaceuticals Emerge as Growth Leader
Retail, warehousing, and logistics centers accounted for 27.41% of 2025 demand, benefiting from early e-commerce automation waves. However, pharmaceuticals will grow fastest at 11.89% CAGR as serialization laws mandate end-to-end traceability. The Asia Pacific automated material handling market size earmarked for pharmaceutical operations expands because temperature-controlled picking and dispensing demand high precision. Cold-chain obligations and contamination risk discourage manual handling, turning autonomous shuttles and AMRs into compliance enablers.
Automotive plants maintain a robust baseline owing to just-in-time production disciplines, while food and beverage factories balance hygiene with throughput. Airports adopt baggage-handling AMRs to address surging passenger volumes. In post and parcel, national posts modernize to combat private couriers’ speed advantage. As drug regulations tighten across China and India, pharmaceutical warehouses will deploy redundant sensor layers and validation software, widening the lead over retail in absolute spending by decade’s end.
By Payload Capacity: Light Systems Drive E-Commerce Adaptation
Platforms rated for 500 kg-1,500 kg commanded 45.28% of 2025 flows, offering versatility across consumer goods and automotive parts. Yet sub-500 kg units will compound at 13.18% CAGR through 2031, mirroring parcel profiles that trend toward lighter, high-velocity orders. As cross-border e-commerce grows, pick faces carry smaller cartons to shuttle zones, making compact robots ideal. Operators thus re-optimize grids for speed rather than tonnage.
Heavy-payload robots above 1,500 kg serve niche metal fabrication or pallet sequencing, but slow 10.52% CAGR. Manufacturing footprints gradually orient toward finished goods rather than raw bulk, decreasing average item weight. ASEAN incentives under the Regional Comprehensive Economic Partnership propel consumer-product plants that mostly ship lighter SKUs, reinforcing the tilt toward lower-capacity fleets. Facility designers now plan multi-tier mezzanines where small bots travel vertical lifts, compressing cubic utilization without sacrificing cycle time.
By Navigation Technology: SLAM Gains Ground on Traditional Methods
Laser guidance preserved a 37.45% share in 2025, prized for millimeter accuracy inside purpose-built aisles. Yet SLAM-based natural feature navigation is poised to outpace all other formats at 12.08% CAGR because it dispenses with reflectors or magnetic tape. The Asia Pacific automated material handling market share commanded by SLAM systems gains momentum where floor plans evolve frequently, such as 3PL multipurpose warehouses.
Magnetic and wire guidance survive in price-sensitive facilities, while vision guidance tackles irregular environments like yard operations. SLAM elevates human-machine collaboration because robots interpret dynamic obstacles without external beacons, fulfilling ISO 13482 stipulations for human-shared spaces. As AI vision components drop in cost, operators reassess total lifetime economics and lean toward navigation technologies that cut infrastructure upkeep, tilting future rollouts decisively toward SLAM.
Geography Analysis
China generated 41.92% of regional value in 2025, buoyed by vertically integrated robotics supply chains and ample subsidy pools under Manufacturing 2025. Domestic brands accelerate iteration cycles by colocating R&D, component manufacturing, and user pilots within single economic zones, compressing concept-to-commercial timelines. Japan and South Korea rank next, focusing on mitigating chronic labor shortages through advanced fleets that merge AMRs with 5G private networks for ultra-reliable low-latency control.
India represents the fastest-growing territory, advancing at 12.19% CAGR through 2031. The Production Linked Incentive scheme injects USD 26 billion into automation expenditures, while fast-growing middle-class consumption swells domestic e-commerce nodes. Multinationals open greenfield factories to hedge supply-chain concentration, driving parallel warehouse investments that embed autonomous sorters and forklifts from day one.
Emerging ASEAN markets, including Indonesia, Thailand, Vietnam, and Malaysia, are scaling adoption behind tax holidays and import duty waivers for robotics under smart-industrial-park programs. Thailand’s Board of Investment grants up to 13-year corporate tax exemptions to autonomated material handling deployments, stimulating uptake in automotive clusters. Singapore anchors regional innovation as a demonstration hub, having reached 40% warehouse automation penetration by 2024. Australia and Taiwan occupy specialized niches: miners automate heavy-duty haulage while semiconductor fabs require wafer-handling precision far exceeding general manufacturing tolerances.
Competitive Landscape
The Asia Pacific automated material handling market shows moderate concentration where global conglomerates coexist with fast-scaling regional specialists. DAIFUKU, KION Group, and Jungheinrich leverage broad portfolios and deep service reach to secure multi-country rollouts for blue-chip customers. Chinese challengers Geek+, Quicktron, VisionNav, and Hai Robotics expand aggressively by customizing solutions for local operating conditions and competing on total cost of ownership.
Strategic plays cluster into three templates. First, global integration: KION acquired Dematic to blend equipment with warehouse execution software, offering turnkey deliverables that reduce integration risk for enterprise accounts. Second, regional specialization: VisionNav centers on autonomous forklifts suited to high-humidity Southeast Asian climates, while Hai Robotics optimizes tote-handling solutions for Chinese e-grocers. Third, technology partnerships: Toyota Industries pairs with SoftBank to embed 5G modules into forklifts, jointly monetizing private-network ecosystems.
Product differentiation pivots increasingly on software. Vendors race to refine traffic simulators, predictive maintenance algorithms, and multi-agent orchestration platforms that boost fleet utilization. Hardware reliability remains essential, yet buyers now scrutinize API openness and cybersecurity certifications such as ISO 27001. Service scope also shapes bids as lifecycle contracts extend 10-15 years. Against this backdrop, vendors able to balance mechanical robustness, advanced analytics, and responsive field service capture share in a market gradually consolidating around full-stack capability.
Asia Pacific Automated Material Handling Industry Leaders
DAIFUKU Co., Ltd.
Kardex Holding AG
KION GROUP AG
John Bean Technologies Corporation
JUNGHEINRICH AG
- *Disclaimer: Major Players sorted in no particular order

Recent Industry Developments
- January 2025: KION Group announced a USD 500 million expansion of its automated material handling plant in Jinan, China, including a new AI-focused R&D center.
- December 2024: Geek+ closed a Series E round exceeding USD 100 million to accelerate ASEAN expansion and next-gen AMR development.
- November 2024: DAIFUKU won a USD 300 million contract to automate Alibaba’s Hangzhou fulfillment hub with 2,000 AMRs and high-speed sorters.
- October 2024: Toyota Industries partnered with SoftBank to co-develop 5G-enabled autonomous forklifts for Japanese factories.


Asia Pacific Automated Material Handling Market Report Scope
Automated material handling equipment eliminates the need for human interference in a material handling process. Continuous rise in the demand for automation, with the advent of technologies, such as robotics, wireless technologies, and driverless vehicles, in different industries, like food and beverages, retail, general manufacturing, pharmaceuticals, and post and parcel, revolutionized the adoption of automated material handling equipment.
The Asia Pacific Automated Material Handling Market is segmented by Product Type ( Hardware, Software, Services), By Equipment Type (Mobile Robots (Automated Guided Vehicles, Autonomous Mobile Robots), Automated Storage and Retrieval System (Fixed Aisle, Carousel, Vertical Lift Module), Automated Conveyors (Belt, Roller, Pallet, Overhead), Palletizers (Conventional, Robotic), Sortation System), End-user Vertical (Airport, Automotive, Food and Beverage, Retail, Warehousing/Distribution Centers/Logistics Centers, General Manufacturing, Pharmaceutical, Post and Parcel, and Electronics And Semi-Conductor Manufacturing ), and Country.
By Product Type
| Hardware |
| Software |
| Services |
By Equipment Type
| Mobile Robots | Automated Guided Vehicles (AGV) | Automated Forklift |
| Automated Tow / Tractor / Tug | ||
| Unit Load | ||
| Assembly Line | ||
| Special Purpose | ||
| Autonomous Mobile Robots (AMR) | ||
| Laser Guided Vehicle | ||
| Automated Storage and Retrieval System (ASRS) | Fixed Aisle (Stacker Crane + Shuttle System) | |
| Carousel (Horizontal Carousel + Vertical Carousel) | ||
| Vertical Lift Module | ||
| Automated Conveyor | Belt | |
| Roller | ||
| Pallet | ||
| Overhead | ||
| Palletizer | Conventional (High Level + Low Level) | |
| Robotic | ||
| Sortation System |
By End-User Vertical
| Airport |
| Automotive |
| Food and Beverage |
| Retail / Warehousing / Distribution / Logistics Centers |
| General Manufacturing |
| Pharmaceuticals |
| Post and Parcel |
| Other End-User Verticals |
By Payload Capacity
| Up to 500 kg |
| 500 kg - 1,500 kg |
| Above 1,500 kg |
By Navigation Technology
| Laser Guidance |
| Vision Guidance |
| Magnetic Tape / Wire Guidance |
| Natural Feature Guidance (SLAM) |
By Region
| China |
| Japan |
| India |
| South Korea |
| Australia |
| Indonesia |
| Thailand |
| Singapore |
| Malaysia |
| Taiwan |
| Rest of Asia Pacific |
| By Product Type | Hardware | ||
| Software | |||
| Services | |||
| By Equipment Type | Mobile Robots | Automated Guided Vehicles (AGV) | Automated Forklift |
| Automated Tow / Tractor / Tug | |||
| Unit Load | |||
| Assembly Line | |||
| Special Purpose | |||
| Autonomous Mobile Robots (AMR) | |||
| Laser Guided Vehicle | |||
| Automated Storage and Retrieval System (ASRS) | Fixed Aisle (Stacker Crane + Shuttle System) | ||
| Carousel (Horizontal Carousel + Vertical Carousel) | |||
| Vertical Lift Module | |||
| Automated Conveyor | Belt | ||
| Roller | |||
| Pallet | |||
| Overhead | |||
| Palletizer | Conventional (High Level + Low Level) | ||
| Robotic | |||
| Sortation System | |||
| By End-User Vertical | Airport | ||
| Automotive | |||
| Food and Beverage | |||
| Retail / Warehousing / Distribution / Logistics Centers | |||
| General Manufacturing | |||
| Pharmaceuticals | |||
| Post and Parcel | |||
| Other End-User Verticals | |||
| By Payload Capacity | Up to 500 kg | ||
| 500 kg - 1,500 kg | |||
| Above 1,500 kg | |||
| By Navigation Technology | Laser Guidance | ||
| Vision Guidance | |||
| Magnetic Tape / Wire Guidance | |||
| Natural Feature Guidance (SLAM) | |||
| By Region | China | ||
| Japan | |||
| India | |||
| South Korea | |||
| Australia | |||
| Indonesia | |||
| Thailand | |||
| Singapore | |||
| Malaysia | |||
| Taiwan | |||
| Rest of Asia Pacific | |||


Key Questions Answered in the Report
What is the current valuation of the autonomous material handling market in Asia Pacific?
The market is valued at USD 33.54 billion in 2026 and is set to reach USD 58.19 billion by 2031.
Which equipment type is gaining the most share in regional warehouses?
Mobile robots lead adoption, holding 33.22% of 2025 deployments and growing at 12.21% CAGR through 2031.
Why are pharmaceuticals investing heavily in autonomous systems?
Drug traceability laws and cold-chain compliance needs drive a 11.89% CAGR for pharmaceutical automation spending.
Which navigation technology is expected to grow fastest?
SLAM-based natural feature guidance will expand at 12.08% CAGR because it removes the need for fixed infrastructure.
How quickly can companies recoup investments in autonomous fleets?
Payback periods have fallen to roughly 18 months in developed APAC markets due to rising labor costs and productivity gains.
Which Asia Pacific country shows the highest growth potential?
India leads with a projected 12.19% CAGR, fueled by production-linked incentives and rapid expansion of e-commerce fulfillment.
Page last updated on:


