ASEAN Domestic Courier Market Size and Share
Market Overview
| Study Period | 2018 - 2031 |
|---|---|
| Forecast Data Period | 2026 - 2031 |
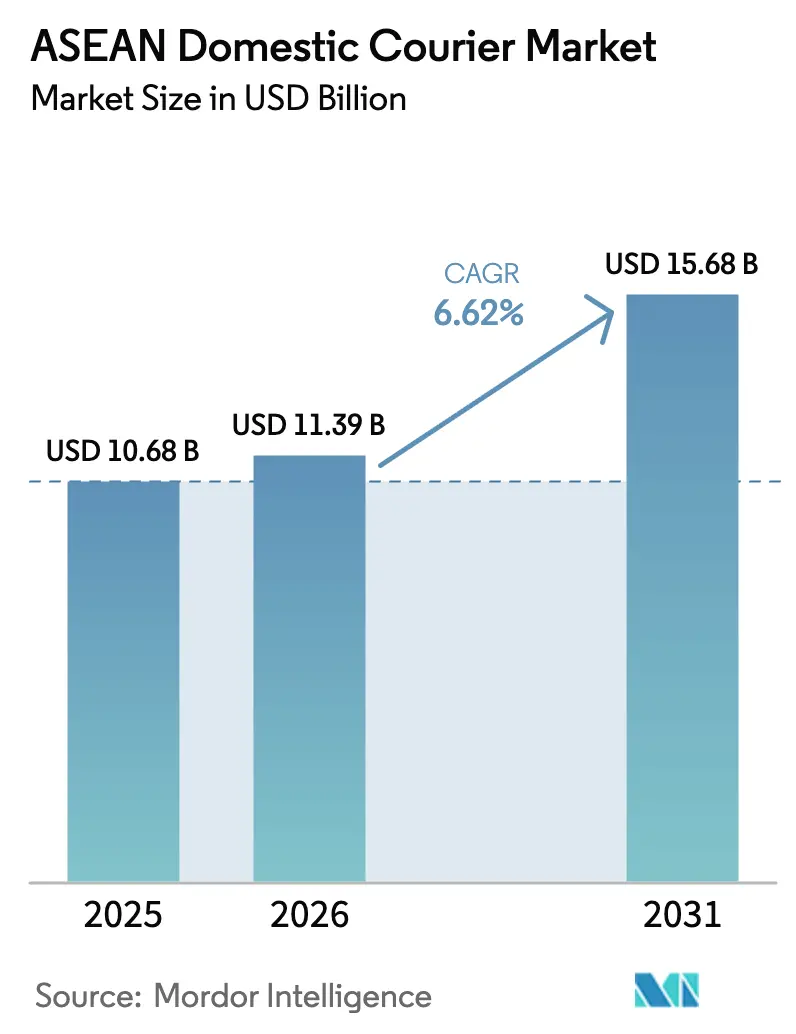
| Base Year Market Size (2025) | USD 10.68 Billion |
| Market Size (2026) | USD 11.39 Billion |
| Market Size (2031) | USD 15.68 Billion |
| Growth Rate (2026 - 2031) | 6.62% CAGR |
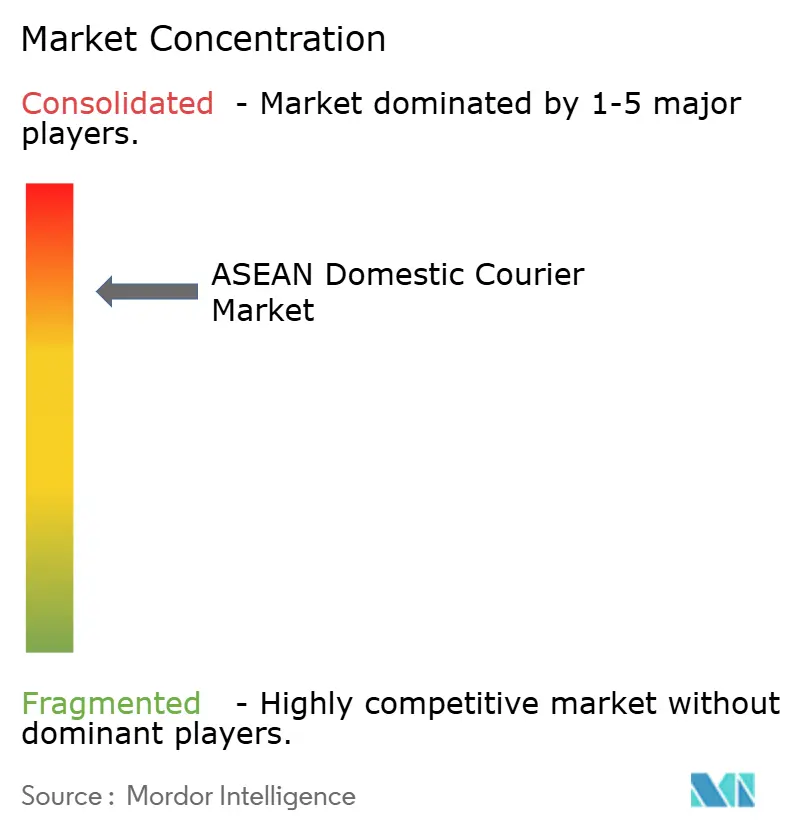
| Market Concentration | High |
Major Players *Disclaimer: Major Players sorted in no particular order Image © Mordor Intelligence. Reuse requires attribution under CC BY 4.0. | |
ASEAN Domestic Courier Market Analysis by Mordor Intelligence
The ASEAN domestic courier market size was valued at USD 10.68 billion in 2025 and estimated to grow from USD 11.39 billion in 2026 to reach USD 15.68 billion by 2031, at a CAGR of 6.62% during the forecast period (2026-2031). Digital commerce scale-up, sustained intra-regional trade, and technology-enabled delivery networks propel revenue, while persistent price competition keeps operators focused on efficiency gains. Express delivery adoption accelerates as platforms promise same-day fulfillment, yet standard services remain essential for budget-sensitive shoppers. Cross-border merchandise from China reshapes parcel composition and pushes couriers to integrate customs-clearing capabilities. Government-led road, port, and 5G upgrades improve network density, but infrastructure gaps outside tier-one cities continue to inflate last-mile costs. Competitive intensity centers on scale, automation, and fleet electrification as companies look to defend margins while meeting rising service expectations.
Key Report Takeaways
- By speed of delivery, non-express held 71.20% of the ASEAN domestic courier market share in 2025, whereas express is forecast to grow at a 7.52% CAGR between 2026-2031.
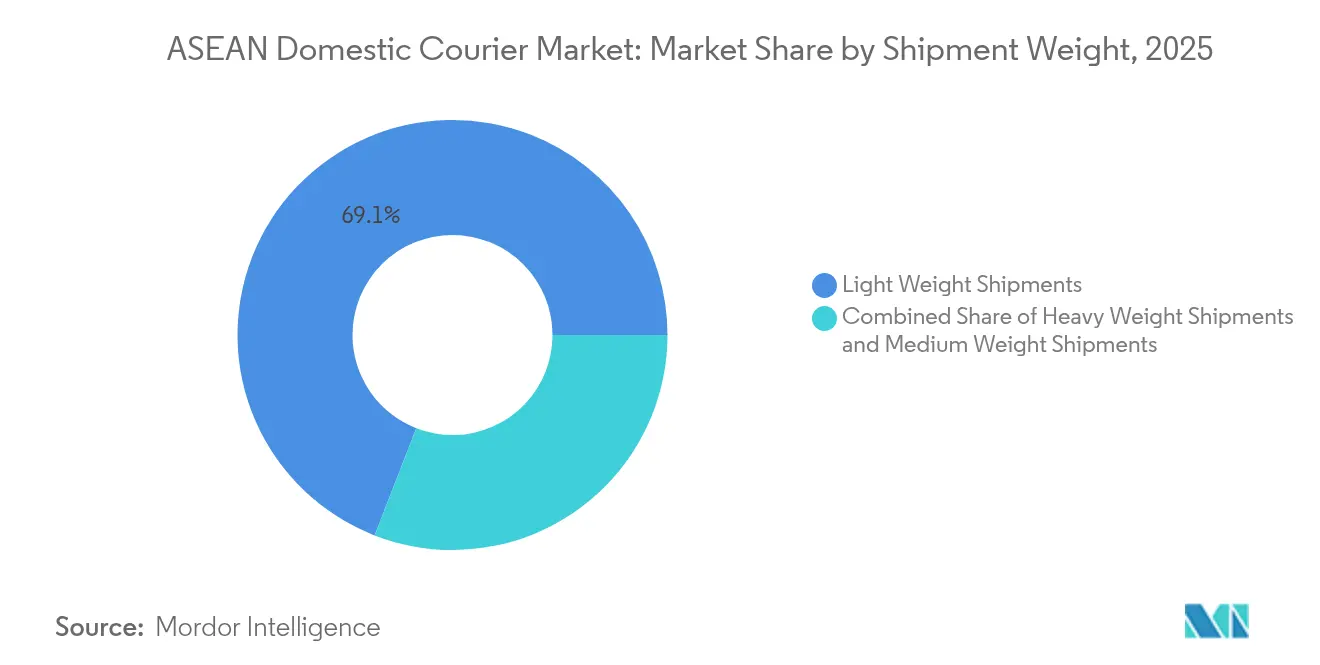
- By shipment weight, lightweight parcels accounted for 69.10% of the ASEAN domestic courier market size in 2025, while heavyweight parcels are poised to advance at a 6.78% CAGR between 2026-2031.
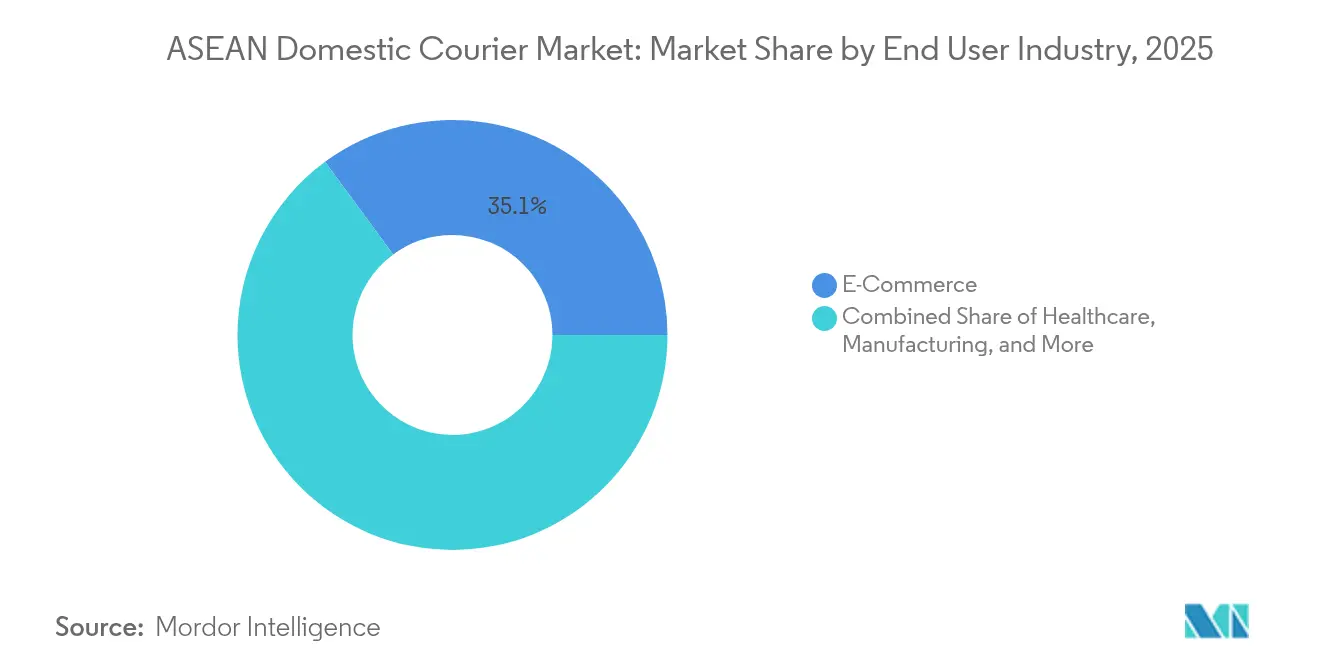
- By end user industry, e-commerce led with 35.10% revenue share in 2025; healthcare is projected to expand at a 7.05% CAGR over 2026-2031.
- By model, the business-to-consumer (B2C) segment commanded 50.10% of the revenue share in 2025, as the consumer-to-consumer (C2C) segment is expected to record the fastest 6.72% CAGR between 2026-2031.
- By country, Indonesia captured 46.30% revenue share in 2025, while Vietnam is expected to log the highest 7.26% CAGR between 2026-2031.
Note: Market size and forecast figures in this report are generated using Mordor Intelligence’s proprietary estimation framework, updated with the latest available data and insights as of 2026.
ASEAN Domestic Courier Market Trends and Insights
Drivers Impact Analysis*
| Driver | (~)% Impact on CAGR Forecast | Geographic Relevance | Impact Timeline |
|---|---|---|---|
| Explosive B2C e-commerce GMV growth | +2.1% | Indonesia, Vietnam, Thailand, Philippines | Short term (≤ 2 years) |
| Rising demand for same-day/instant delivery | +1.8% | Urban centers across ASEAN, Singapore, Malaysia | Medium term (2-4 years) |
| Rapid digital-payment adoption reduces COD frictions | +1.2% | Vietnam, Philippines, Indonesia | Short term (≤ 2 years) |
| Government infrastructure upgrades (roads, ports, digital) | +0.9% | Vietnam, Thailand, Indonesia | Long term (≥ 4 years) |
| Fleet electrification of motorcycles lowers OPEX | +0.7% | Vietnam, Indonesia, Thailand | Medium term (2-4 years) |
| Horizontal collaboration platforms cut empty-backhaul costs | +0.5% | Cross-border corridors, Malaysia-Singapore | Medium term (2-4 years) |
| Source: Mordor Intelligence | |||


Explosive B2C E-commerce GMV Growth
Rising online shopping penetration lifts daily parcel volumes, giving couriers the density required to widen network reach and drop per-unit costs. Shopee, Lazada, and TikTok Shop invest in fulfillment hubs that outsource last-mile legs to asset-heavy partners, ensuring a steady parcel pipeline. The surge of low-value Chinese goods has prompted ASEAN customs to streamline low-value shipment clearance to keep packages flowing smoothly[1]Philip Wen et al., “Cheap Chinese Goods Are Flooding South-East Asia,” The Straits Times, straitstimes.com. As volumes climb, larger operators secure bulk discounts on airlift and trunk haul capacity, widening their pricing advantage. Smaller firms respond by joining shared-capacity alliances that aggregate volumes onto common line-haul routes. Over the next two years, the ASEAN domestic courier market will see further consolidation as scale economies intensify.
Rising Demand for Same-Day/Instant Delivery
Urban shoppers now treat same-day arrival as default, pressuring couriers to locate micro-fulfillment nodes closer to demand clusters. Best Inc. in Malaysia demonstrates the asset model, running 10 hubs and 300 stations to push 500,000 parcels per day. Operators deploy AI route engines that rebalance capacity in real time, trimming idle mileage and ensuring service-level adherence. Average order values rise for same-day shipments, partially offsetting higher driver and vehicle standing costs. Platforms reward speed with visibility boosts, reinforcing the service upgrade cycle. The driver adds 1.8 percentage points to forecast CAGR as speed moves from premium to baseline expectation.
Rapid Digital-Payment Adoption Reduces COD Frictions
Mobile wallets replace cash at the doorstep, slashing failed-delivery rates tied to payment disputes. ViettelPost’s app cuts order-creation time by two-thirds and accelerates settlement, improving driver productivity[2]Viettel Post JSC, “Smartphone Application,” asia.stevieawards.com. Digital receipts feed data lakes that power credit-scoring engines, allowing couriers to bundle micro-lending and parcel insurance and diversify revenue. Reduced cash handling also lowers security costs and shrinkage risk, indirectly lifting profitability. The change is most pronounced in Vietnam and the Philippines, where wallet adoption crossed 70% of internet users in 2025. Seamless payments add 1.2 percentage points to growth prospects for the ASEAN domestic courier market.
Government Infrastructure Upgrades (Roads, Ports, Digital)
Projects such as Vietnam’s north-south expressway and Thailand’s Eastern Economic Corridor shorten line-haul transit by several hours per trip. Expanded deep-water berths in Hai Phong and Laem Chabang improve vessel frequency, supporting multimodal courier flows. National 5G rollouts enable Internet-of-Things sensors that feed real-time truck telemetry into dynamic routing dashboards. ASEAN’s Single Window digitizes customs paperwork, clipping border dwell time for small parcels[3]ASEAN Secretariat, “ASEAN Trade Statistics Database,” asean.org. Infrastructure gains spread slowly to secondary towns, but once operational, they lock in permanent cost savings that compound over the long term.
Restraints Impact Analysis*
| Restraint | (~)% Impact on CAGR Forecast | Geographic Relevance | Impact Timeline |
|---|---|---|---|
| Poor first/last-mile infrastructure in secondary cities | -1.4% | Rural areas across ASEAN; secondary cities in Indonesia, Philippines | Long term (≥ 4 years) |
| Margin-eroding price wars among major players | -1.1% | Indonesia, Vietnam, Thailand | Short term (≤ 2 years) |
| Foreign-ownership caps and data-localization rules | -0.8% | Indonesia, Vietnam, Malaysia | Medium term (2-4 years) |
| High courier turnover and welfare concerns | -0.6% | Urban centers, gig-economy hubs | Medium term (2-4 years) |
| Source: Mordor Intelligence | |||
Poor First/Last-Mile Infrastructure in Secondary Cities
Patchy road surfaces and incomplete address databases lengthen delivery windows and hike costs outside metropolitan hubs. Vietnam’s logistics bill stands at 16-20% of GDP, far above the global 11.6% benchmark. Drivers spend extra time locating recipients, leading to redeliveries that inflate unit economics. Shippers raise surcharges for out-of-delivery-area shipments, dampening order volumes and slowing e-commerce adoption among rural consumers. Courier firms experiment with community pickup points, but progress is gradual because digital literacy and smartphone penetration lag urban rates. The constraint shaves 1.4 percentage points off the ASEAN domestic courier market CAGR outlook.
Margin-Eroding Price Wars Among Major Players
Aggressive discounting, led by J&T Express, pushes average delivery fees below cost in Indonesia and Vietnam, sparking regulators to study price floors[4]CafeF, “Courier Price Wars Trigger Regulatory Review,” cafef.vn. Smaller couriers exit or merge, reducing service diversity. The razor-thin margin environment delays automation capex and wages, triggering quality slippage that undermines customer trust. Investors demand profitability milestones, forcing firms to reassess unsustainable promotions. The restraint knocks 1.1 percentage points from growth during the next two years but is expected to ease as consolidation progresses.
*Our forecasts treat driver/restraint impacts as directional, not additive. The impact forecasts reflect baseline growth, mix effects, and variable interactions.
Segment Analysis
By End User Industry: Healthcare Emerges as High-Growth Specialist Segment
E-commerce remained the top revenue generator, driving 35.10% of the ASEAN domestic courier market size in 2025. Market leaders integrate last-mile APIs directly into seller dashboards, enabling real-time label creation and pickup booking. Dynamic discount programs incentivize merchants to consolidate shipments, improving load factors. Continuous urban population growth and high smartphone usage sustain volume momentum.
Healthcare, though smaller, is projected to expand fastest at 7.05% CAGR between 2026-2031 on the back of pharmaceutical cold-chain demand and direct-to-patient models. DHL earmarked EUR 500 million for Asia-Pacific life-sciences logistics, underscoring the margin upside of temperature-controlled capacity. Compliance requirements such as GDP (Good Distribution Practice) certifications raise barriers to entry, allowing incumbents to price at premium levels. Manufacturing continues to generate industrial-courier needs, especially as ASEAN participates deeper in regional value chains for electronics and automotive. BFSI uses couriers for secure document movement and debit-card distribution, but digitalization moderates volume growth compared to other verticals.


By Speed of Delivery: Express Gains Momentum Amid Cost-Sensitive Non-Express Base
Express services generated a 28.80% slice of the ASEAN domestic courier market size in 2025 and are projected to post a 7.52% CAGR between 2026-2031. Higher-priced same-day options attract platform subsidies that bundle shipping into promotional campaigns, reinforcing demand. Operators invest in automated sorters capable of processing 30,000 parcels per hour, cutting hub dwell times and trimming delivery windows. Network models shift toward cross-dock micro hubs located within 15 kilometers of core consumption clusters, shortening stem mileage. Customer satisfaction scores improve when estimated delivery windows narrow to two-hour blocks, boosting platform conversion rates.
Non-Express delivery retains a dominant 71.20% share in 2025 because price-sensitive shoppers still choose economy options for non-urgent items. Couriers rely on multi-day line-haul loops utilizing hybrid road-rail solutions to maximize capacity. Retailers push bulky consumer-durable shipments through economy lanes because delivery speed contributes less to purchase decisions compared to price. Nevertheless, service expectations continue to rise, and several operators embed transit-time guarantees even on standard tiers to preserve competitiveness. As e-commerce adoption deepens, average parcel weight inches upward, blurring the traditional Express versus Non-Express split and encouraging hybrid offerings that price on size and urgency.
By Shipment Weight: Light Parcels Dominate While Heavy Parcels Accelerate
Light parcels represented 69.10% of the ASEAN domestic courier market share in 2025, capturing most fashion, beauty, and small electronics orders. Automation favors this segment; high-speed sorters can handle uniform packages with minimal manual touchpoints. Low weight also enables electric two-wheelers to cover dense urban drops without range anxiety. Efficient handling keeps per-item fees low, sustaining affordability for casual sellers in C2C channels.
Heavy parcels above 10 kilograms are forecast to record a 6.78% CAGR between 2026-2031 as near-shoring relocates regional manufacturing. Automotive components, white goods, and machine parts flow between newly established industrial parks in Thailand, Vietnam, and Indonesia. Couriers diversify into palletized freight and value-added warehouse services, bridging the gap between small-parcel couriers and traditional freight forwarders. Specialized depots equipped with forklifts, dock-levelers, and climate controls allow safe handling of bulky or sensitive cargo. Medium weight parcels continue to fill the middle band, often linked to B2B office-supply replenishment, but growth lags as shippers upsize or downsize toward the more cost-efficient extremes.
By Model: C2C Rapidly Expands Within B2C-Dominated Landscape
The B2C model held 50.10% of the ASEAN domestic courier market share in 2025, benefiting from massive platform ecosystems that aggregate seller volumes. Couriers negotiate master contracts that lock in minimum volumes, stabilizing revenue streams. Platform-branded ship options such as “Shopee Express” embed loyalty perks like free returns, further entrenching B2C dominance.
C2C parcels are on track for a 6.72% CAGR between 2026-2031 as social-commerce and live-stream selling lower entry barriers for individuals. TikTok Shop’s rollout spurred micro-seller growth, and flexible pickup scheduling tools make doorstep collection convenient. ViettelPost’s cross-border subsidiaries in Laos, Cambodia, and China position the firm to tap budding regional C2C flows. B2B shipments retain strategic importance, delivering higher average weights and value-added services such as scheduled delivery or reverse logistics for warranty returns. Though smaller in share, B2B remains sticky owing to long-term service contracts and integration with enterprise resource planning systems.
Geography Analysis
Indonesia led the ASEAN domestic courier market in 2025 with a 46.30% revenue share, driven by its 280 million population and thriving digital-commerce scene. Dense inter-island networks rely on a mix of trucking, coastal shipping, and air cargo. Competitive rivalry is fiercest, prompting regulators to debate price floors to curb predatory discounting. Infrastructure initiatives such as the Trans-Java toll road and new logistics parks in Surabaya improve regional connectivity, yet capacity bottlenecks persist in eastern islands.
Vietnam is forecast to log the fastest 7.26% CAGR between 2026-2031 as the government channels investment toward modern logistics hubs. Vietnam Post Logistics will open seven centers in 2025 across key economic zones, boosting north-south throughput. Nationwide 5G coverage enhances parcel tracking accuracy, strengthening customer confidence. Trade integration through free-trade agreements attracts manufacturing FDI, adding industrial courier volumes. High smartphone penetration and vibrant social-commerce scenes further propel delivery demand.
Malaysia, Thailand, the Philippines, and the rest of ASEAN collectively complement the regional landscape. Malaysia acts as a regional trans-shipment hub; Pos Malaysia’s fleet electrification pilot aims to trim carbon intensity and operating cost. Thailand leverages its Eastern Economic Corridor to streamline supply routes into Cambodia and Laos, while platform-led promotions stimulate last-mile volumes in Bangkok and Chiang Mai. The Philippines grapples with archipelagic geography; roll-on roll-off ferry upgrades underpin inter-island courier flows but rural roads need improvement. Singapore, though small in domestic scale, functions as a headquarters and technology testbed; FedEx’s new automated sort facility in Changi exemplifies high-throughput design. Collectively these markets maintain double-digit growth contributions and diversify risk for regional operators.
Competitive Landscape
Competition in the ASEAN domestic courier market centers on network scale, technology sophistication, and pricing power. J&T Express wields volume leverage to negotiate favorable air and trucking rates, sustaining its cost-leadership play albeit with profitability concerns. Ninja Van and UPS expanded their partnership in 2025, combining Ninja’s dense pickup points with UPS’s global gateway access. DHL targets high-margin healthcare logistics, deploying GDP-certified facilities and IoT-enabled packaging to safeguard temperature-sensitive drugs.
Technology investments underpin differentiation. FedEx Surround offers predictive disruption alerts, letting shippers intervene before delivery failure. CJ Logistics deploys automated sort lines capable of handling 65,000 parcels per hour across Singapore and Vietnam, shrinking hub dwell time and labor dependence. ViettelPost and SF Express pursue regional expansion through subsidiaries and partnerships, chasing cross-border synergies that blend express documents, parcels, and freight.
Sustainability emerges as a competitive lever. Pos Malaysia pilots battery-swap motorcycles that lower running costs while satisfying corporate clients’ emission targets. JWD Group opens automated ambient-cold warehouses that cut energy usage via high-density storage. Firms able to quantify carbon savings win bids with multinational retailers bound by Scope 3 reporting needs. Meanwhile, labor practices surface as a reputational battlefield; delivery-person welfare debates push leaders to introduce social-security coverage, which may raise operating costs but also curb attrition.
ASEAN Domestic Courier Industry Leaders
J&T Express
Ninja Van
PT Pos Indonesia (Persero)
Thailand Post
ViettelPost
- *Disclaimer: Major Players sorted in no particular order

Recent Industry Developments
- May 2025: Vietnam Post Logistics to commission seven new logistics centers in 2025.
- April 2025: DHL Group announces EUR 2 billion (USD 2.20 billion) global life-sciences logistics investment with EUR 500 million (USD 551.82 million) allocated to Asia-Pacific.
- April 2025: FedEx launches FedEx Surround in Indonesia.
- December 2024: CJ Logistics highlights partnerships with Ninja Van and Saigon Co.op in 2024 expansion update.


ASEAN Domestic Courier Market Report Scope
Express, Non-Express are covered as segments by Speed Of Delivery. Heavy Weight Shipments, Light Weight Shipments, Medium Weight Shipments are covered as segments by Shipment Weight. E-Commerce, Financial Services (BFSI), Healthcare, Manufacturing, Primary Industry, Wholesale and Retail Trade (Offline), Others are covered as segments by End User Industry. Business-to-Business (B2B), Business-to-Consumer (B2C), Consumer-to-Consumer (C2C) are covered as segments by Model. Indonesia, Malaysia, Philippines, Thailand, Vietnam are covered as segments by Country.| Express |
| Non-Express |
| Heavy Weight Shipments |
| Light Weight Shipments |
| Medium Weight Shipments |
| E-Commerce |
| Financial Services (BFSI) |
| Healthcare |
| Manufacturing |
| Primary Industry |
| Wholesale and Retail Trade (Offline) |
| Others |
| Business-to-Business (B2B) |
| Business-to-Consumer (B2C) |
| Consumer-to-Consumer (C2C) |
| Indonesia |
| Malaysia |
| Philippines |
| Thailand |
| Vietnam |
| Rest of ASEAN |
| Speed of Delivery | Express |
| Non-Express | |
| Shipment Weight | Heavy Weight Shipments |
| Light Weight Shipments | |
| Medium Weight Shipments | |
| End User Industry | E-Commerce |
| Financial Services (BFSI) | |
| Healthcare | |
| Manufacturing | |
| Primary Industry | |
| Wholesale and Retail Trade (Offline) | |
| Others | |
| Model | Business-to-Business (B2B) |
| Business-to-Consumer (B2C) | |
| Consumer-to-Consumer (C2C) | |
| Country | Indonesia |
| Malaysia | |
| Philippines | |
| Thailand | |
| Vietnam | |
| Rest of ASEAN |


Market Definition
- Courier, Express, and Parcel - The Courier, Express, and Parcel services, often called as CEP Market, refers to the logistics and postal service providers which specialize in moving small goods (parcels/packages). It captures the overall market size (USD) and market volume (number of parcels) of (1) the shipments/parcels/packages which are under 70kgs/ 154lbs weight, (2) Business Customer packages viz. Business-to-Business (B2B) & Business-to-Consumer (B2C) as well as private customer packages (C2C), (3) non-express parcel delivery services (Standard and Deferred) as well as express parcel delivery services (Day-Definite-Express and Time-Definite-Express), (4) domestic as well as international shipments.
- Demographics - To analyse total addressable market demand, population growth & forecasts have been studied and presented in this industry trend. It represents population distribution across categories like gender (male/female), development area (urban/rural), major cities among other key parameters like population density and final consumption expenditure (growth and share % of GDP). This data has been used for assessing the fluctations in demand & consumption expenditure, and the major hotspots (cities) of potential demand.
- Domestic Courier Market - Domestic Courier Market refers to the CEP shipments wherein the origin and destination is within the boundary of the geography studied (country or region as per the scope of report). It captures the market size (USD) and market volume (number of parcels) of (1) the shipments/parcels/packages which are under 70kgs/ 154lbs weight, including light weight shipments, medium weight shipments and heavy weight shipments (2) Business Customer packages viz. Business-to-Business (B2B) & Business-to-Consumer (B2C) as well as private customer packages (C2C), (3) non-express parcel delivery services (Standard and Deferred) as well as express parcel delivery services (Day-Definite-Express and Time-Definite-Express).
- E-Commerce - This end user industry segment captures the external (outsourced) logistics expenditure incurred by the e-tailers, through online sales channel, on Courier, Express, and Parcel (CEP) services. The scope includes (i) the supply chain of a company's online customer orders being fulfilled, (ii) the process of getting a product from the point of manufacturing to the point at which it is delivered to consumers. It involves managing inventory (deferred as well as time critical), shipping, and distribution.
- Export Trends and Import Trends - Overall logistics performance of an economy is positively and significantly (statistically) correlated to its trade performance (exports and imports). Hence, in this industry trend, total value of trade, major commodities/ commodity groups and the major trade partners, for the studied geography (country or region as per the scope of report) have been analysed alongside the impact of major trade/logistics infrastructure investments & regulatory environment.
- Financial Services (BFSI) - This end user industry segment captures the external (outsourced) logistics expenditure incurred by the BFSI players, on Courier, Express, and Parcel (CEP) services. CEP is important to the financial services industry in shipping of confidential documents and files. The establishments in this sector are engaged in (i) financial transactions (that is, transactions involving the creation, liquidation, or change in ownership of financial assets) or in facilitating financial transactions, (ii) financial intermediation, (iii) the pooling of risk by underwriting annuities and insurance, (iv) providing specialized services that facilitate or support financial intermediation, insurance and employee benefit programs, and (v) monetary control - the monetary authorities.
- Fuel Price - Fuel price spikes can cause delays and diruption for logistics service providers (LSPs), while drops in the same can result in higher short-term profitability and increased market rivalry to offer consumers with the best deals. Hence, the fuel price variations have been studied over the review period and presented along with the causes as well as market impacts.
- GDP Distribution by Economic Activity - Nominal Gross Domestic Product and distribution of the same, across major economic sectors in the geography studied (country or region as per scope of the report) have been studied and presented in this industry trend. As GDP is positively related to the profitability and growth of logistics industry, this data has been used in adjunction to the input-output tables/ supply-use tables for analyzing the potential major contributing sectors towards the logistics demand.
- GDP Growth by Economic Activity - Growth of Nominal Gross Domestic Product across major economic sectors, for the geography studied (country or region as per scope of the report) have been presented in this industry trend. This data has been utilized for assessing the growth of logistics demand from all the market end users (economic sectors considered here).
- Healthcare - This end user industry segment captures the external (outsourced) logistics expenditure incurred by the Healthcare players (Hospitals, clinics, mrdical centres) , on Courier, Express, and Parcel (CEP) services. The scope includes CEP services involved in the defrerred as well time critical movement of medical goods & supplies (surgical supplies and instruments, including gloves, masks, syringes, equipment). The establishments in this sector (i) include the ones providing medical care exclusively (ii) deliver services by trained professionals (iii) involve processes, including labor inputs of health practitioners with the requisite expertise (iv) are defined based on the educational degree held by the practitioners included in the industry.
- Inflation - Variations in both Wholesale Price Inflation (YoY change in producer price index) and Consumer Price Inflation have been presented in this industry trend. This data has been used to assess the inflationary environment as it plays a vital role in smooth functioning of the supply chain, directly impacting the logistics operational cost components e.g., pricing of tyres, driver wages & benefits, energy/fuel prices, maintenace costs, toll charges, warehousing rents, custom brokerage, forwarding rates, courier rates etc. hence impacting the overall freight and logistics market.
- Infrastructure - As infrastructure plays a vital role in an economy's logistics performance, variables like length of roads, distribution of road length by surface category (paved v/s unpaved), distribution of road length by road classification (expressways v/s highways v/s other roads), rail length, volume of containers handled by major ports and tonnage handled by major airports have been analysed and presented in this industry trend.
- International Express Service Market - International Express Service Market refers to the CEP shipments wherein the origin or destination is not within the boundary of the geography studied (country or region as per the scope of report). It captures the market size (USD) and market volume (number of parcels) of (1) the shipments/parcels/packages which are under 70kgs/ 154lbs weight, including light weight shipments, medium weight shipments and heavy weight shipments (ii) Inter-Region as well as Intra-Region Shipments
- Key Industry Trends - The report section named "Key Industry Trends" include all the key variables/parameters studied to better analyze the market size estimates and forecasts. All the trends have been presented in the form of data points (time series or latest available data points) along with analysis of the paramter in the form of concise market relevant commentary, for the geography studied (country or region as per the scope of report).
- Key Strategic Moves - The action taken by a company to differentiate from its competitor or used as a general strategy is referred to as a key strategic move (KSM). This includes (1) Agreements (2) Expansions (3) Financial Restructuring (4) Mergers and Acquisitions (5) Partnerships, and (6) Product Innovations. Key players (Logistics Service Providers, LSPs) in the market have been shortlisted, their KSM have been studied and presented in this section.
- Logistics Performance - Logistics Performance and Logistics Costs are the backbone of trade, and influences trade costs, making countries compete globally. Logistics performance is influenced by market wide adopted supply chain management strategies, government services, investments & policies, fuel/ energy costs, inflationary environment etc. Hence, in this industry trend, the logistics performance of the geography studied (country/ region as per the scope of report) has been analysed and presented over the review period.
- Manufacturing - This end user industry segment captures the external (outsourced) logistics expenditure incurred by the Manufacturing industry (including Hi-Tech/Technology) players, on Courier, Express, and Parcel (CEP) services. The end user players considered are the establishments primarily engaged in the chemical, mechanical or physical transformation of materials or substances into new products. Logistics Service Providers (LSPs) play a crucial role in maintaining a smooth flow of raw materials across the supply chain, enabling timely delivery of finished goods to distributors or end customers and storing & supplying the raw materials to clients for just-in-time manufacturing.
- Other End Users - Other end user segment captures the external (outsourced) logistics expenditure incurred by the construction, real estate, educational services, and professional services (administrative, waste management, legal, architectural, engineering, design, consulting, scientific R&D), on Courier, Express, and Parcel (CEP) services. Logistics Service Providers (LSPs) plays a crucial role in the reliable movement of time critical supplies and documents to/from these industries such as transporting any equipment or resources required, shipping confidential documents and files.
- Primary Industry - This end user industry segment captures the external (outsourced) logistics expenditure incurred by the AFF (Agriculture, Fishing, and Forestry) and Extraction indsutry (Oil &Gas, Quarrying and Mining) players, on Courier, Express, and Parcel (CEP) services. The end user players considered are the establishments (i) primarily engaged in growing crops, raising animals, harvesting timber, harvesting fish & other animals from their natural habitats and providing related support activities; (ii) that extract naturally occurring mineral solids, such as coal and ores; liquid minerals, such as crude petroleum; and gases, such as natural gas. Herein, Logistics Service Providers (LSPs) (i) play a crucial role in acquisition, storage, handling, transportation, and distribution activities for the optimal & continuous flow of inputs (seeds, pesticides, fertilizers, equipment, and water) from manufacturers or suppliers to the producers and smooth flow of output (produce, agro-goods) to distributors/ consumers; (ii) cover entire phases from upstream to downstream and play a crucial role in the transportation of machinery, drilling equipments, extracted minerals, crude oil & natural gas and refined/ processed products from one place to another. This includes both termperature controlled and non-temperature controlled logistics, as and when required according to the shelf life of goods being transported or stored.
- Producer Price Inflation - It indicates inflation from viewpoint of the producers viz. the average selling price received for their output over a period of time. Annual change (YoY) of producer price index is reported as wholesale price inflation in the "Inflation" industry trend. As WPI captures dynamic price movements in most comprehensive way, it is widely used by governments, banks, industry, business circles and is deemed important in formulation of trade, fiscal and other economic policies. The data has been used in adjunction to consumer price inflation for better understanding the inflationary environment.
- Segmental Revenue - Segmental Revenue has been triangulated or computed and presented for all the major players in the market. It refers to the courier, express, and parcel (CEP) market specific revenue earned by the company, over the base year of study, in the geography studied (country or region as per the scope of report). It is computed through the study and analysis of major parameters like financials, service portfolio, employee strength, fleet size, investments, number of countries present in, major economies of concern, etc. that have been reported by the company in its annual reports, webpage. For companies having scarce financial disclosures, paid databases like D&B Hoovers, Dow Jones Factiva have been resorted to and verified through industry/expert interactions.
- Transport and Storage Sector GDP - Value and growth of Transport and Storage Sector GDP has a direct relation to the freight and logistics market size. Hence, this variable has been studied and presented over the review period, in value terms (USD) and as share % of total GDP, in this industry trend. The data has been supported by concise and relevant commentary around the investments, developments, and current market scenario.
- Trends in E-Commerce Industry - Enhanced internet connectivity and boom in smartphone penetration, coupled with increasing disposable incomes, has led to a phenomenal growth in the e-commerce market globally. Online shoppers require fast and efficient delivery of their orders leading to an increase in the demand for logistics services especially e-commerce fulfilment services. Hence, the Gross Merchandise Value (GMV), historial and projected growth, breakup of major commodity groups in e-commerce industry for the studied geography (country or region as per scope of the report) have been analysed and presented in this industry trend.
- Trends in Manufacturing Industry - Manufacturing industry involves the transformation of raw materials into finished products, while logistics industry ensures the efficient flow of raw materials to the factory, and the transport of manufactured products to the distributors & consumers. Demand-Supply of both industries are highly cross-linked and critical for a seamless supply chain. Hence, the Gross Value Added (GVA), breakup of GVA into major manufacturing sectors, and growth of manufacturing industry over the review period have been analysed and presented, in this industry trend.
- Wholesale and Retail Trade (Offline) - This end user industry segment captures the external (outsourced) logistics expenditure incurred by the wholesalers and retailers, through offline sales channel, on Courier, Express, and Parcel (CEP) services. The end user players considered are the establishments primarily engaged in wholesaling or retailing merchandise, generally without transformation, and rendering services incidental to the sale of merchandise. Logistics Service Providers (LSPs) plays a crucial role in the reliable movement of supplies to and finished products from production houses to the distributors and finally to the end customer covering activites like material sourcing, transportation, order fulfillment, warehousing & storage, demand forecasting, inventory management etc.
| Keyword | Definition |
|---|---|
| Axle Load | The axle load refers to the total load (weight) bearing on the roadway through wheels connected to a given axle. Across the globe, there are systems in place to ensure axle load monitoring, wherein surpassing the defined limits set by the concerned regulatory authority can lead to penalty/fine. For transportation of goods via road this can be an important determinant of costs as knowledge about the axle load limits can be used to (i) load the vehicle optimally for maximizing profits (ii) avoid exceeding the same and hence the probable fines associated (iii) avoid wear and tear of the vehicle (iv) avoid damage to pavement resulting in noticeable public maintenance and repair costs (v) achieve better turnaround time. |
| Back Haul | Backhaul is the return movement of a transport vehicle from its original destination to its original point of departure, and can include full, partial, or empty truck loads (all or part of the way) depending on the visibility of the local freight ecosystem. In this regard, transportation of empty containers to the point of origin, known as deadheading is also a significant factor, considering the supply/container shortages across the geographies, resulting in cost escalation and under optimized profit potential attainment. Generally, the carriers offer discounts on the backhaul, to secure freight for the trip. |
| Bill of Lading (BOL) | A bill of lading is a legal contract document issued by a carrier to a shipper to acknowledge reception of their cargo, and is evidence for the contract of carriage between the two parties. Broadly it details the (i) type, quantity, and other specifications of the goods being carried (ii) destination, and terms & conditions of the shipment (iii) carrier and drivers with all the necessary information to process the shipment, which can be used for insurance and customs clearance purposes (iv) assurance that the consignment is damage-free and ready to be shipped to the consignee. In this regard, a house bill of lading (HBL) is a document issued by a freight forwarder or a non-vessel operating common carrier (NVOCC) to acknowledge receipt of items for shipment (to a shipper). If shipments from several shippers are involved a master bill of lading (MBL) might be involved which is a consolidated version of the same for all the shipments being taken care of by the carrier (to a common destination) and might be issued by the carrier to the freight forwarder or the shipper (depending on who books the transport). |
| Bunkering | Bunkering is the process of supplying fuel to power the propulsion system of a ship. It includes the logistics of loading and distributing the fuel among available shipboard tanks. In this regard, (i) Bunker fuel is technically any type of fuel oil used aboard ships. It gets its name from the containers on ships and in ports that it is stored in; in the days of steam they were coal bunkers but now they are bunker-fuel tanks, (ii) Bunker refers to the spaces (Tank) on board a vessel to store fuel, (iii) Bunker trader refers to a person dealing in trade of bunker (fuel), (iv) Bunker call is made when a cargo ship anchors or berths in a port to take on bunker oil or supplies, (v) Bunkering service is the supply of a requested quality and quantity of bunkers to a ship. Bunkering is signficant from point of view of freight rates applicable to the shipper as Bunker Contribution (BUC)/ Fuel Adjustment Factor (FAF)/ Bunker Adjustment Factor (BAF) are applied by shipping lines to offset the effect of fluctuations in the cost of bunkers. |
| Cabotage | Transport by a vehicle registered in a country, performed on the national territory of another country. Cabotage law may restrict domestic cargo traffic to be carried in its own nationally registered, and sometimes built and crewed vehicles, though regulations vary across industries/commodity groups/countries and sometimes specify maximum allowable percentage of cabotage that can be serviced by foreign registered fleet. |
| C-commerce | Collaborative commerce (also known as C-commerce), (i) describes electronically enabled business interactions among an enterprise’s internal personnel, business partners and customers throughout a trading community (industry, industry segment, supply chain or supply chain segment); (ii) is the optimization of supply and distribution channels to capitalize on the global economy by using new technology efficiently. Advantages of C-commerce, to detail few include (i) maximization of organization's efficiency and profitability (ii) technology integration with physical channels to allow companies to work together (iii) increased information exchange such as inventory and product specifications, using the web as an intermediary (iv) increased competitiveness by reaching a broader audience. Examples of C-commerce, also known as peer-to-peer commerce, include (i) companies that allow consumers to rent things from each other, or marketplaces, such as Meta (formerly Facebook) Marketplace, that allow the sale of used goods; (ii) DoorDash teamed up with many national brands, such as McDonald’s and Chipotle, to offer fast food delivery, building their business model on c-commerce. They have since expanded their delivery service from restaurants to retailers and even offer 'fleets' of drivers to businesses. |
| Courier | A business/company that delivers packages/parcels/shipments (upto 70 kgs) including quick door to door pickup and delivery service for goods or documents, domestically or internationally, on a commercial contract basis. Example, DHL Group, FedEx, United Parcel Service of America, Inc., USPS, International Distributions Services, J&T Express, SF Express among several others |
| Cross docking | Cross docking is a practice in logistics management that includes unloading incoming delivery vehicles and loading the materials directly into outbound delivery vehicles, omitting traditional warehouse logistical practices and saving time and money. It requires close synchronization of both inbound and outbound movements. It is highly significant in reduction of costs pertaining to warehousing & storage (and the associated Value Added Services). |
| Cross Trade | International transport between two different countries performed by a vehicle registered in a third country. A third country is a country other than the country of loading/embarkation and the country of unloading/disembarkation. Cross Trade law may restrict international cargo traffic to be carried by respective country's registered vehicles, and sometimes built and crewed vehicles, though regulations vary across industries/commodity groups/countries and sometimes specify maximum allowable percentage of cross trade that can be serviced by foreign registered fleet. |
| Customs Clearance | The process of declaring and clearing cargoes through customs. It includes the procedures involved in getting cargo released by Customs through designated formalities such as presenting import license/permit, payment of import duties and other required documentations by the nature of the cargo. In this regard, a customs broker is a person or company licensed by the respective department of the country to act on behalf of freight importers and exporters. |
| Dangerous Goods | Dangerous goods (or hazardous materials or HAZMAT) include flammable liquids/solids, gases (compressed, liquified, dissolved under pressure), corrosives, oxidising substances, explosive substances and articles, substances which on contact with water emit flammable gasses, organic peroxides, toxic substances, infectious substances, radioactive materials, miscellaneous dangerous goods and articles. |
| First mile Delivery | First mile delivery refers to the (i) first stage of the freight/shipment/cargo/courier transportation (ii) the transportation of goods from a merchant’s premises or warehouse to the next fulfillment centre/warehouse/hub from where the goods are forwarded (iii) shipping goods from local distribution centers to stores (For retailers) (iv) transportation of finished goods from a plant or a factory to a distribution center (For manufacturers), (v) pick up of goods from the end-customer’s home or store followed by movement to a warehouse or storage location (movers and packers), (vi) process where goods are picked up from a retailer and then transferred to third-party logistics providers or courier service providers to be delivered to the end-consumer (e-commerce). Once the package reaches the next warehouse or the courier’s hub, it is then sorted and transported further until it reaches the customer’s doorstep. Example, if one chooses UPS as a courier, first-mile delivery will be the product being delivered from manufacturer's/retailer's warehouse to the UPS’s warehouse/ fulfilment centre. |
| Last Mile Delivery | Last mile delivery refers to the very last step of the delivery process when a parcel is moved from a transportation hub (warehouse or a distribution center or fulfillment centre) to its final destination, which usually is a personal residence/retail store/ business, or parcel locker. It accounts for around half of the total cost involved in entire process of first mile, middle mile, and last mile delivery, though it can vary shipment to shipment, based on commodity, business model and similar factors. |
| Milkrun | A Milk Run is a delivery method used to transport mixed loads from various suppliers to one customer, using lean management principles applied to logistics. Instead of each supplier sending a truck every week to meet the needs of one customer, one truck (or vehicle) visits the suppliers to pick up the loads for that customer. This method of transport got its name from the dairy industry practice, where one tanker used to collect milk from several dairy farms for delivery to a milk processing company. A milk run can be a more efficient way to handle logistics but require proper planning. If the route involves products from different companies, there is need for an agreement about cost-sharing and other aspects of the cooperative delivery arrangement. Once the group settles these issues, this delivery method can save time and money for everyone by pooling operation costs and resources. |
| Multi country consolidation | Multi-Country Consolidation (MCC) is a cost-effective solution that consolidates one's cargo from different countries of origin to build Full Container Loads (FCL). MCC is most suitable for companies that import light volumes of goods from multiple countries but want to take advantage of the more economic FCL freight rates. Apart from costing some of the other advantages include (i) flexibility to choose suppliers from a wider range of origin countries without worrying about the logistics to final destination from each origin, (ii) ability to pick the most suitable suppliers from many different countries for one's business operations. The increase in one's sourcing options by MCC provides the kind of flexibility needed in competitive global markets. |
| Q-commerce | Q-commerce, also referred to as quick commerce, is a type of e-commerce where emphasis is on quick deliveries, typically in less than an hour. The companies providing Q-Commerce services might have vertically intergrated model or might be using third party delivery platforms (outsourced logistics). It has advantages like (i) competitve USP, (ii) potential to earn greater profit margins, (iii) better customer experience, (iv) guaranteed availability of products, (v) traceability, and (vi) scaleability. |
| ReverseLogistics | Reverse logistics is a type of supply chain management that moves goods from customers back to the sellers or manufacturers and may involve ciruclar economy principles (3Rs) viz. recycling, reuse (repurposing, reselling), reducing or repairing. In this regard, reverse commerce (or Recommerce) is the selling of previously owned items through physical or online marketplaces/distribution channels to buyers who reuse, recycle or resell them. |


Research Methodology
Mordor Intelligence follows a four-step methodology in all our reports.
- Step-1: Identify Key Variables: In order to build a robust forecasting methodology, the variables and factors identified in Step-1 are tested against available historical market numbers. Through an iterative process, the variables required for market forecast are set and the model is built on the basis of these variables.
- Step-2: Build a Market Model: Market-size estimations for the forecast years are in nominal terms. Inflation is considered to be a part of the pricing, and the average selling price (ASP) is varying throughout the forecast period for each country
- Step-3: Validate and Finalize: In this important step, all market numbers, variables and analyst calls are validated through an extensive network of primary research experts from the market studied. The respondents are selected across levels and functions to generate a holistic picture of the market studied.
- Step-4: Research Outputs: Syndicated Reports, Custom Consulting Assignments, Databases & Subscription Platforms


