AR And VR Headsets Market Size and Share
Market Overview
| Study Period | 2020 - 2031 |
|---|---|
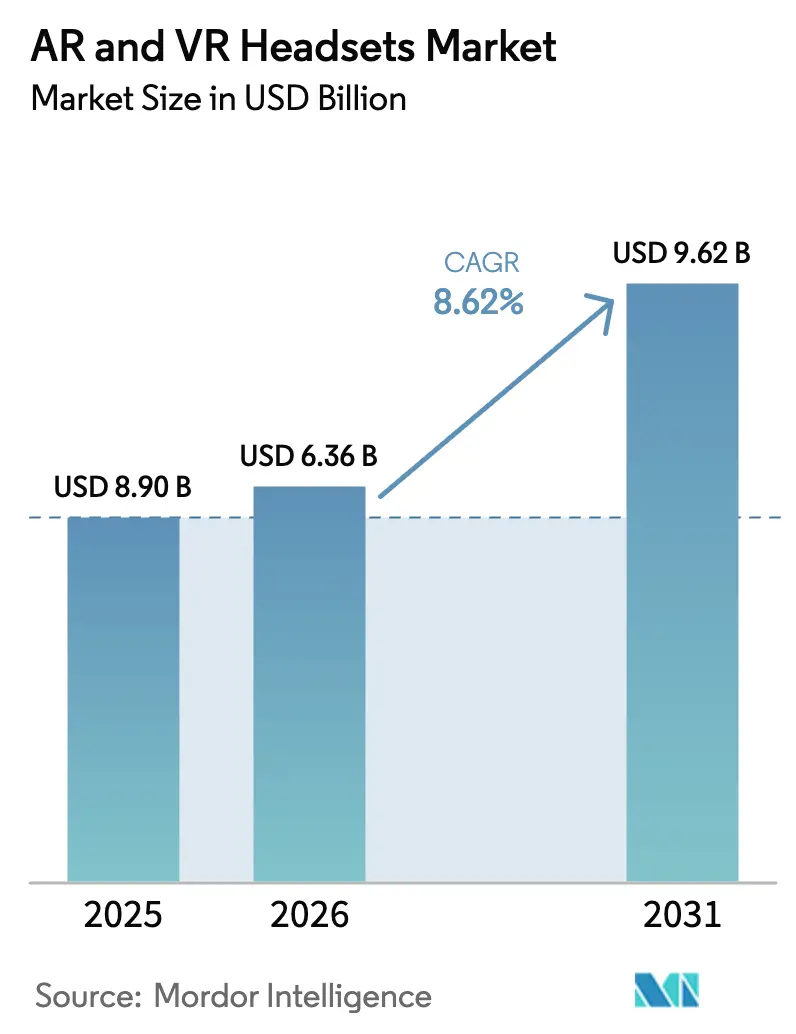
| Market Size (2026) | USD 6.36 Billion |
| Market Size (2031) | USD 9.62 Billion |
| Growth Rate (2026 - 2031) | 8.62% CAGR |
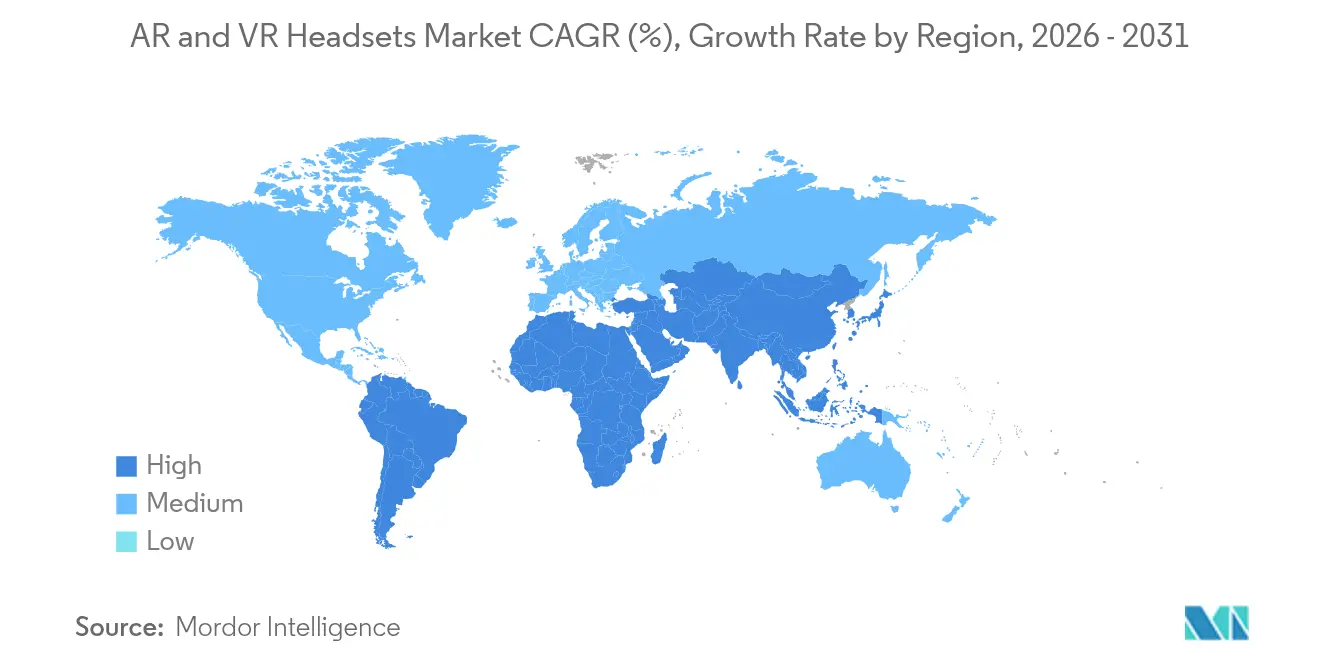
| Fastest Growing Market | Middle East and North Africa |
| Largest Market | Asia Pacific |
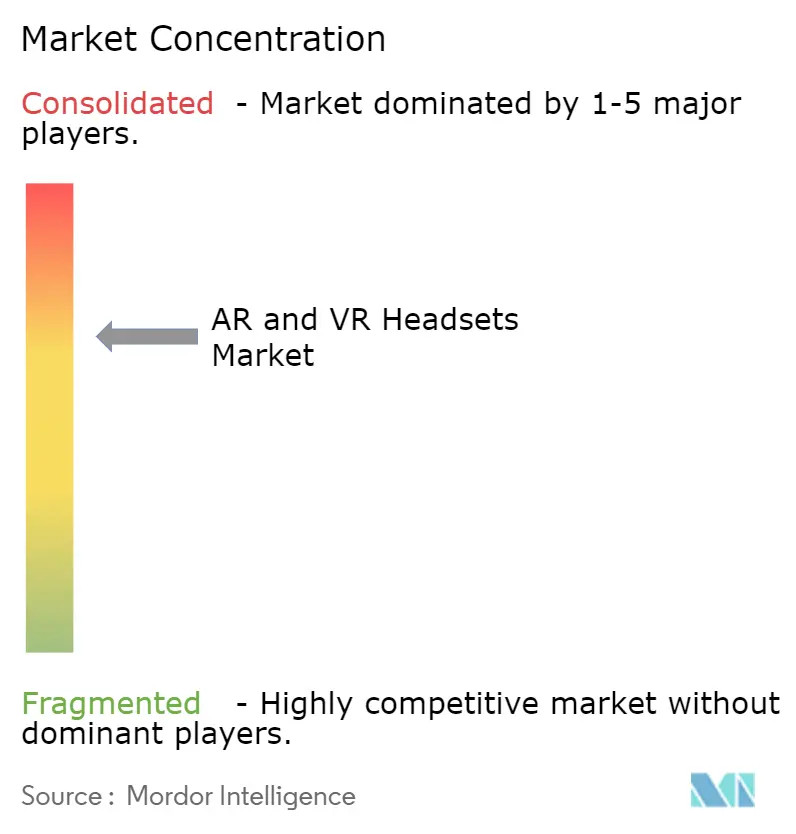
| Market Concentration | Medium |
Major Players*Disclaimer: Major Players sorted in no particular order Image © Mordor Intelligence. Reuse requires attribution under CC BY 4.0. |
|
AR And VR Headsets Market Analysis by Mordor Intelligence
The AR and VR headsets market size was valued at USD 5.86 billion in 2025 and estimated to grow from USD 6.36 billion in 2026 to reach USD 9.62 billion by 2031, at a CAGR of 8.62% during the forecast period (2026-2031). Steady enterprise roll-outs, breakthroughs in optics that shrink bill-of-materials cost, and national industrial policies that diversify the supply base are the main levers widening addressable demand. The share of companies that had live deployments rose to 17% in early 2024 from 8.9% one year earlier, signalling that professional use-not consumer gaming-now dictates technology road-maps. Developers are responding with lighter form factors, customised security stacks and open SDKs that plug directly into collaboration suites, PLM and electronic health-record platforms. Component vendors are also benefiting: micro-OLED suppliers reported record utilisation in 2025 after Sony’s 0.44-inch ECX350F display hit 10,000 cd/m² luminance while cutting thickness to 0.5 mm. Despite these upsides, short-run turbulence continues; Japanese and Taiwanese fabs face capacity limits, and stricter GDPR interpretations around biometric eye-tracking data have slowed monetisation plans in Europe.
Key Report Takeaways
- By device type, virtual-reality headsets held 74.60% of the AR and VR headsets market share in 2025, while augmented-reality headsets are forecast to grow at a 12.10% CAGR to 2031.
- By product type, standalone units accounted for 57.60% share of the AR and VR headsets market size in 2025; hybrid XR devices are poised to log a 12.80% CAGR through 2031.
- By end-user, consumer applications captured 66.50% share in 2025, whereas enterprise deployments are advancing at a 9.05% CAGR to 2031.
- By application, gaming and entertainment commanded 59.70% revenue share in 2025; healthcare and medical training is progressing at an 10.85% CAGR through 2031.
- By price tier, mid-range devices captured 44.10% share in 2025, while low-end devices are climbing at a 10.20% CAGR to 2031.
- By component, hardware contributed 80.40% of revenue in 2025, but software is slated to grow at a 9.75% CAGR over the forecast window.
- By geography, Asia–Pacific led with 41.00% revenue share in 2025; the Middle East & Africa region is projected to post the fastest growth at a 8.95% CAGR through 2031.
Note: Market size and forecast figures in this report are generated using Mordor Intelligence’s proprietary estimation framework, updated with the latest available data and insights as of 2026.
Global AR And VR Headsets Market Trends and Insights
Drivers Impact Analysis*
| Driver | (~)% Impact on CAGR Forecast | Geographic Relevance | Impact Timeline |
|---|---|---|---|
| Growing enterprise spend on immersive collaboration headsets | 1.80% | North America & Europe | Medium term (2-4 years) |
| Rapid scaling of XR developer ecosystems in East Asia | 1.50% | China & South Korea | Short term (≤ 2 years) |
| Healthcare accreditation of VR surgical-simulation modules | 1.20% | United States & EU | Long term (≥ 4 years) |
| Pass-through MR gaming titles expanding consumer TAM | 0.90% | Global | Medium term (2-4 years) |
| Indian PLI tax incentives for domestically-assembled AR gear | 0.70% | India, South Asia spill-over | Long term (≥ 4 years) |
| Declining ASP of pancake optics & micro-OLED below USD 150 | 1.40% | Global | Short term (≤ 2 years) |
| Source: Mordor Intelligence | |||
Growing enterprise spend on immersive collaboration headsets
Ford’s Dearborn plant implementation of HoloLens 2 showed how 25 technicians trimmed inspection cycles and improved quality yields, validating bigger headset line-items in IT budgets.[1]Joann Muller, “I Used Ford’s Mixed Reality Tech to Quality-Check an Engine,” Axios, axios.com HR-led roll-outs for onboarding, safety drills, and remote audits are also branching beyond manufacturing into utilities and pharma labs. Vendors now bundle mobile-device-management hooks, ISO 27001 data-at-rest controls, and Teams or Zoom plug-ins, raising switching costs for competitors. Because procurement metrics map directly to defect reduction, CFOs green-light multiyear refresh cycles, cementing the AR and VR headsets market as a core workplace tool. Long term, enterprise demand is forecast to stabilise shipment volatility traditionally driven by consumer hit titles.
Rapid scaling of XR developer ecosystems in China and South Korea
More than 100 new VR projects launched in mainland China during 2024 alone, fusing AI-driven language localisation with historic folklore storylines that attract inbound tourism licensing. South Korea’s “Hundred Lens War” sees five incumbents-XREAL, RayNeo, Rokid, INMO, Meizu-undercutting imported devices by up to 50% while offering tailored content packs. The self-reinforcing flywheel-device sales drive developer income which in turn spawns more local IP-shrinks payback periods for new headset SKUs. These network effects promise to lift the AR and VR headsets market in APAC faster than in regions still reliant on imported content.
Healthcare accreditation of VR surgical-simulation modules
Formal CME credit for immersive modules, endorsed by U.S. and EU surgical boards, transforms VR training from optional tool to budgeted necessity advancesinsimulation.[2]Megan Gemma et al., “Extended Reality in Surgical Training,” Systematic Reviews Journal, biomedcentral.com Peer-reviewed outcomes show 30% faster procedure completion and 25% error reduction, hard ROI figures that chief medical officers cite in funding applications. Specialised headsets ship with wipe-down coatings, autoclavable foam, and spatial tracking calibrated for OR lighting. As medical colleges incorporate modules into residencies, the AR and VR headsets market continues diversifying revenue beyond gaming.
Declining ASP of pancake optics and micro-OLED displays below USD 150
Optical-efficiency leaps to 93.2% allow smaller heat sinks and lighter chassis, lowering bill-of-materials sufficiently for USD 299 retail launch of Meta Quest 3S.[3]Editors, “Pancake Optics System Revolutionises VR Displays,” Phys.org, phys.org Sony’s sample micro-OLED price has fallen under USD 275, and volume orders trend south of USD 150, letting second-tier OEMs hit sub-USD 300 street prices while still achieving 4 K-per-eye resolution. Cost elasticity opens the AR and VR headsets market to new consumer cohorts in Latin America, Southeast Asia, and Eastern Europe where prior ASPs proved prohibitive.
Restraints Impact Analysis*
| Restraint | (~)% Impact on CAGR Forecast | Geographic Relevance | Impact Timeline |
|---|---|---|---|
| Micro-OLED supply bottlenecks in Japan/Taiwan | −1.3% | Global, premium segments most exposed | Short term (≤ 2 years) |
| Persistent user discomfort & cybersickness | −0.8% | Global | Medium term (2-4 years) |
| Data-privacy regulations limiting eye-tracking monetisation | −0.6% | Europe & North America with global spill-over | Medium term (2-4 years) |
| Complex integration with legacy PLM/ERP suites | −0.5% | Manufacturing hubs worldwide | Long term (≥ 4 years) |
| Source: Mordor Intelligence | |||
Micro-OLED supply bottlenecks (Japan/Taiwan) limiting shipments
Only a handful of fabs can mass-produce ≤6 µm pixel micro-OLED at defect rates acceptable for premium eyewear. Apple’s overtures to Samsung and LG confirm that secondary sourcing remains thin, stretching lead times to thirty-plus weeks and forcing allocation for high-margin SKUs first. Until capital expansions mature, constrained panel flow will cap upside for the AR and VR headsets market in the luxury tier.
Persistent user discomfort and cybersickness
GDPR classifies gaze vectors as special-category biometric data, triggering consent, minimisation, and deletion obligations that few headset ISVs can easily operationalise. A Neurorights Foundation audit found 96.67% of neuro-tech firms reserve the right to share neural metrics, a practice regulators deem non-compliant.[4]European Data Protection Supervisor, “Extended Reality,” edps.europa.eu The compliance burden discourages smaller app studios from building targeted-ad models, shrinking ancillary revenue streams and trimming overall AR and VR headsets market growth potential.
*Our forecasts treat driver/restraint impacts as directional, not additive. The impact forecasts reflect baseline growth, mix effects, and variable interactions.
Segment Analysis
By Device Type: AR Headsets Lead Innovation Despite VR Dominance
Virtual-reality models accounted for 74.60% of 2025 shipments, sustained by entrenched game libraries and simulation-training bundles that keep refresh cycles steady. Augmented-reality devices, although a minority today, clock a 12.10% CAGR as enterprise field service, logistics picking, and on-site engineering adopt see-through displays. Hybrid pass-through units blur boundaries by merging stereoscopic cameras with colour-corrected overlays, enabling a single SKU to serve both immersive training and heads-up information tasks. The AR and VR headsets market size tied to AR devices could more than treble by 2031 if component costs sustain their present downward trajectory. Meanwhile, VR purists gain from ongoing GPU software that up-scales to 120 Hz without upping silicon die area, letting headset OEMs limit power draw without compromising latency.
Sony’s micro-OLED breakthrough at 10,000 cd/m² means true outdoor use is now feasible, de-risking field deployments for telecom tower inspections and petrochemical plant walk-throughs. Interface convergence-gesture, voice, gaze-reduces training overhead, prompting IT departments to standardise procurement around dual-mode devices. Content studios are likewise adjusting pipelines so a single asset can toggle between occluded and pass-through rendering, streamlining monetisation across form factors. These convergences reinforce the AR and VR headsets market’s long-run trajectory toward platform abstraction rather than device-specific silos.


By Product Type: Standalone Devices Reshape Market Dynamics
Standalone headsets secured 57.60% revenue in 2025 because untethered operation removes the high-end PC barrier that once cordoned VR to affluent niches. Qualcomm’s XR2+ Gen 2 system-on-chip doubles GPU watt-per-frame efficiency, giving cordless units resolution parity with last-generation tethered rigs at half the power envelope. Hybrid XR devices-exemplified by Samsung’s Project Moohan-gain traction at 12.80% CAGR by offering both self-contained mode for field demos and plugged-in workstation mode for CAD renderings.
Tethered systems retain importance in surgical simulators where pixel fidelity and 6-DoF haptics trump portability. Smartphone-shell headsets continue losing share as component prices dip below USD 300, letting buyers opt for full CPUs and integrated cooling rather than rely on mobile devices ill-suited for 30-minute sessions. The AR and VR headsets market share of standalone units is poised to widen, though hybrid devices will cannibalise some mid-range tethered demand once high-bandwidth-USB docks standardise across operating systems.
By Application: Healthcare Training Disrupts Gaming Dominance
Gaming and entertainment retained a robust 59.70% stake in 2025 unit economics, propelled by AAA launches and cross-franchise monetisation. Yet hospitals and medical schools are adopting immersive curricula at an 10.85% CAGR, making healthcare the fastest-growing vertical. Ensuring faculty can manipulate anatomy in real time dramatically enhances retention, while licensing agencies extend CME credits to immersive modules.
Industrial maintenance modules show similarly attractive ROI: engineers overlay digital twins onto turbines, cutting downtime during inspections. Defense agencies continue procuring high-end headsets for flight and combat simulation, often at ASPs triple the consumer average. Retail AR try-ons and e-commerce visualisation gain momentum on smartphones, though full headset adoption is still gated by comfort and price. This broader use-case mix fortifies the AR and VR headsets market against any single-segment slowdown.
By Price Tier: Mid-Range Dominance Faces Low-End Disruption
Mid-range (USD 200-499) accounted for 44.10% of 2025 sales because it marries acceptable resolution with mass-market budgets. Continued optics cost deflation has pushed all-in manufacturing of 2.5K-per-eye systems under USD 180, giving OEMs headroom to launch USD 279 bundles without discounting content passes. Low-end ( Premium (>USD 500) remains aspirational, dominated by Apple Vision Pro’s USD 3,500 positioning, Sig Sauer-branded military variants, and Varjo’s photogrammetry rigs for aerospace. Enterprise buyers only partially absorb such pricing; multi-shift use cases often justify outlays when amortised over four-year cycles. Still, premium tiers will likely cede share unless vendors pair hardware with service SLAs, analytics dashboards, and co-development credits.
By Component: Software Growth Accelerates Hardware Innovation
Hardware delivered 80.40% of 2025 revenue, illustrating ongoing capex for micro-display fabs, lens arrays, and ASIC tape-outs. Yet software commands the fastest 9.75% CAGR as app stores transition from one-off sales to multi-tenant SaaS, usage metering, and live-ops cosmetics within shared virtual spaces. Tandem OLED stacks hitting 5,000 cd/m² allow foveated-rendering pipelines that slash GPU cycles, enabling lower-cost silicon without visible artefacts. On the software front, low-code build kits let hospital IT teams clone and edit CT-scan models for training in hours, not weeks. Digital-twin libraries sell as yearly licences, and telemetry APIs monetise anonymised heat-map data for ergonomic research. This layered revenue offsets the falling hardware ASP that accompanies the maturation of the AR and VR headsets market.
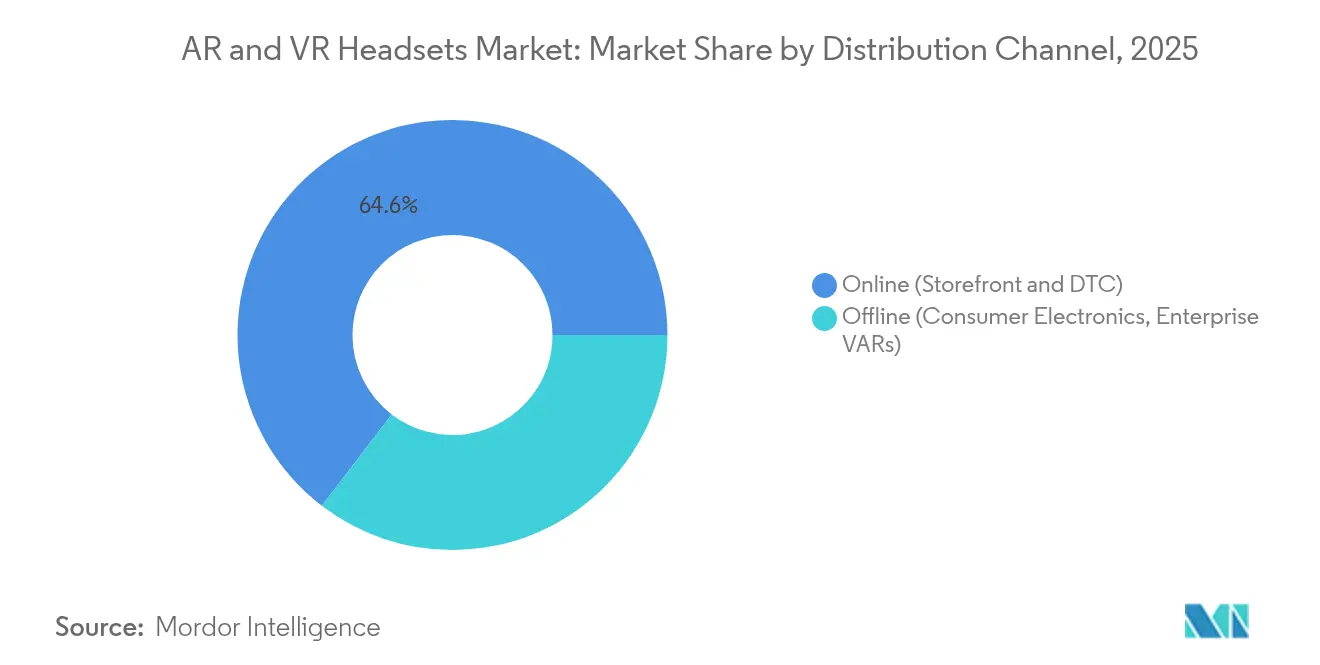
By Distribution Channel: Online Dominance Faces Enterprise VAR Growth
Online storefronts drove 64.60% of units in 2025, leveraging influencer reviews and spec comparators that convert fence-sitting gamers. Yet enterprise VARs are scaling at 9.30% CAGR because industrial buyers need proof-of-concept labs, staged firmware, and post-deployment training. Meta’s brick-and-mortar pilots in North America showcase fit-and-finish differences that web pages cannot convey, but the checkout remains digital, preserving channel margin. Traditional big-box electronics chains face hurdles: limited demo space for walk-in trials, staff education gaps on IPD calibration, and sanitisation protocols. Hybrid fulfilment-order online, pick up calibrated in-store-could address these pain points. For now, the AR and VR headsets market continues to skew digital while professional segments lean on VAR ecosystems.
By End-User: Enterprise Growth Accelerates Beyond Consumer Base
Consumer usage still drives 66.50% of headline revenue, yet enterprise spend is growing faster at 9.05% CAGR as CFOs green-light productivity-linked hardware outlays. Plant managers cite Ford’s HoloLens quality-check success, where on-boarding hours fell by 50% during engine block inspections. Professional service firms deploy AR overlays for on-site client walkthroughs, reducing travel costs and carbon footprints. Secure firmware stacks that integrate with single-sign-on protocols satisfy CISO requirements, positioning the AR and VR headsets market as a legitimate line item in digital-workspace budgets. Consumer gamers remain a volatile cohort; session lengths fluctuate with content release schedules and comfort improvements. Nevertheless, blockbuster IP, live sports VR feeds, and cross-play titles keep the funnel alive, especially with ticketed events like NBA VR driving headset sell-outs on game nights. The proliferation of subscription-based game passes mirrors console economics, promising steadier recurring revenue for platform owners and offsetting hardware margin erosion.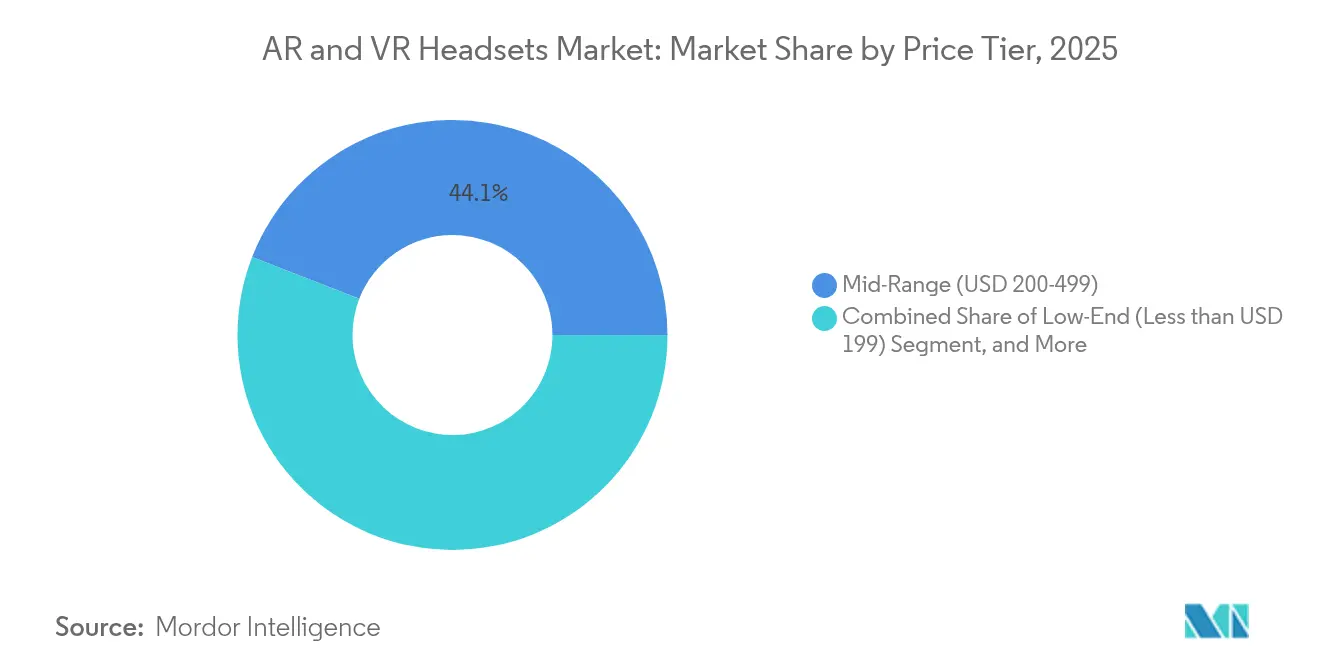
Geography Analysis
Asia–Pacific accounted for 41.00% of global shipments in 2025, benefiting from vertically integrated component supply chains, proactive subsidies, and culturally resonant content pipelines. China’s 100-plus VR mega-installations and South Korea’s aggressive lens pricing compress time-to-market for new entrants while fuelling local developer revenues. Sony’s micro-OLED campus in Aichi prefecture further anchors upstream dominance in optics. India’s INR 22,919 crore PLI outlay draws ODMs keen to hedge geopolitical risk, with several firms now shipping PCB and lens modules directly from Chennai to Southeast Asian assembly lines.
North America’s advantage centres on software and enterprise use cases: 17% of enterprises now operate at least one AR or VR deployment, up sharply from 8.9% a year earlier. Meta’s USD 100 billion spend plan and Google’s partnership with Magic Leap fortify the region’s R&D pipeline. Tight integration between cloud inference engines and edge rendering attracts enterprise developers, reinforcing software-first differentiators that compensate for higher labour costs. Europe presents a mixed landscape: GDPR’s stringent biometric rules complicate ad-tech monetisation, yet medical and industrial users prize compliance as a vendor differentiator. Estimates for AR and VR spending in Europe is expected to rise from USD 5.25 billion in 2025 to USD 13.35 billion by 2031, driven by discrete manufacturing and healthcare upgrades. Meanwhile, the Middle East and Africa, though smaller today, scales at 8.95% CAGR on the back of Dubai’s Metaverse Strategy and location-based attractions such as Sandbox VR’s planned 200 sites by 2027. Latin America trails in absolute numbers but sees momentum as low-end devices become affordable under USD 300, catalysing classroom VR pilots and telco-bundled gaming packages.

Competitive Landscape
Meta continues to dominate consumer shipments via its Quest line, underpinned by a USD 100 billion R&D pledge that spans optics, silicon, and mixed-reality operating systems. Apple’s Vision Pro has reframed premium thresholds, but at USD 3,500 it remains a halo product whose enterprise adoption depends on high-touch ROI proofs. Google re-entered hardware via a USD 150 million partnership with Warby Parker, combining Gemini AI assistants with prescription-ready smart glasses for post-2025 launch.
Strategic alliances proliferate: Samsung and Google share R&D on Project Moohan while LG co-develops display sub-assemblies, giving Samsung dual monetisation across its own SKU and third-party component sale. Meta’s tie-up with defense contractor Anduril targets up to USD 100 million in U.S. Army orders, signalling a pivot into stable government revenue.
Vuzix secured USD 15 million from Quanta Computer to expand enterprise smart-glass output, underscoring appetite for B2B niches . Chinese mid-tiers such as XREAL and Rokid pursue aggressive overseas licensing, pricing AR glasses at USD 275–550 to undercut Western imports. With the top five vendors estimated to control about 55% of units, the AR and VR headsets market remains moderately concentrated, leaving runway for regional disruptors anchored in local content or vertical specialisation.
AR And VR Headsets Industry Leaders
-
Meta Platforms, Inc.
-
Sony Group Corporation
-
HTC Corporation
-
Microsoft Corporation
-
Samsung Electronics Co., Ltd.
- *Disclaimer: Major Players sorted in no particular order

Recent Industry Developments
- June 2025: Vuzix received a USD 15 million investment from Quanta Computer to accelerate smart-glasses development, bolstering enterprise supply capacity.
- May 2025: Google announced a USD 150 million partnership with Warby Parker to launch Android XR smart glasses powered by Gemini AI after 2025.
- May 2025: Meta and Anduril formed a strategic alliance to build EagleEye headsets for the U.S. Army, targeting contracts up to USD 100 million.
- May 2025: Samsung unveiled 4K micro-OLED panels for next-gen headsets, raising peak brightness while slimming thickness
- March 2025: India approved an INR 22,919 crore PLI scheme to spur electronics component production, including AR optics and PCBs.
- February 2025: Meta committed USD 100 billion to R&D across smart glasses, VR headsets and mixed-reality devices.


Global AR And VR Headsets Market Report Scope
The AR and VR headsets market refers to the industry focused on the development, manufacturing, and sales of head-mounted devices that deliver augmented reality (AR) or virtual reality (VR) experiences. AR headsets overlay digital information onto the real world, while VR headsets create fully immersive virtual environments. These devices are used across various applications, including gaming, healthcare, education, and industrial sectors. The market is growing due to technological advancements, increasing consumer demand, and the expansion of use cases in both entertainment and enterprise sectors.
The AR and VR Headsets Market is segmented by product type (standalone headsets, tethered headsets, smartphone-enabled headsets), component (hardware, software), distribution channel (online, offline), industry vertical (gaming and entertainment, healthcare, education and training, retail and e-commerce, manufacturing and industrial, other industry verticals), and Geography (North America, Europe, Asia Pacific, Latin America, Middle East and Africa). The market sizes and forecasts are provided in terms of value (USD) for all the above segments.
| Augmented-Reality (Optical See-Through, Video See-Through) |
| Virtual-Reality (Semi-Immersive, Fully Immersive) |
| Mixed-Reality (Pass-Through) |
| Standalone Headsets |
| Tethered/PC-Connected Headsets |
| Smartphone-Enabled Headsets |
| Hybrid XR Headsets |
| Low-End (Less than USD 199) |
| Mid-Range (USD 200 - 499) |
| Premium (More than USD 500) |
| Hardware | Optics (Fresnel, Pancake, Waveguide) |
| Display Technology (LCD, AMOLED, Micro-OLED, MicroLED) | |
| Processing and Connectivity Chipsets | |
| Sensor Suite (IMU, Eye, Depth, Hand) | |
| Power and Battery Modules | |
| Software | Runtime OS and SDKs |
| Content and App Stores |
| Consumer |
| Enterprise |
| Gaming and Entertainment |
| Healthcare and Medical Training |
| Education and Workforce Training |
| Retail and E-commerce Visualisation |
| Manufacturing and Industrial Maintenance |
| Defense and Aerospace Simulation |
| Real Estate and AEC Visualisation |
| Online (Storefront and DTC) |
| Offline (Consumer Electronics, Enterprise VARs) |
| North America | United States | |
| Canada | ||
| Mexico | ||
| Europe | Germany | |
| United Kingdom | ||
| France | ||
| Nordics | ||
| Rest of Europe | ||
| South America | Brazil | |
| Rest of South America | ||
| Asia-Pacific | China | |
| Japan | ||
| India | ||
| South-East Asia | ||
| Rest of Asia-Pacific | ||
| Middle East and Africa | Middle East | Gulf Cooperation Council Countries |
| Turkey | ||
| Rest of Middle East | ||
| Africa | South Africa | |
| Rest of Africa | ||
| By Device Type | Augmented-Reality (Optical See-Through, Video See-Through) | ||
| Virtual-Reality (Semi-Immersive, Fully Immersive) | |||
| Mixed-Reality (Pass-Through) | |||
| By Product Type | Standalone Headsets | ||
| Tethered/PC-Connected Headsets | |||
| Smartphone-Enabled Headsets | |||
| Hybrid XR Headsets | |||
| By Price Tier | Low-End (Less than USD 199) | ||
| Mid-Range (USD 200 - 499) | |||
| Premium (More than USD 500) | |||
| By Component | Hardware | Optics (Fresnel, Pancake, Waveguide) | |
| Display Technology (LCD, AMOLED, Micro-OLED, MicroLED) | |||
| Processing and Connectivity Chipsets | |||
| Sensor Suite (IMU, Eye, Depth, Hand) | |||
| Power and Battery Modules | |||
| Software | Runtime OS and SDKs | ||
| Content and App Stores | |||
| By End-User | Consumer | ||
| Enterprise | |||
| By Application | Gaming and Entertainment | ||
| Healthcare and Medical Training | |||
| Education and Workforce Training | |||
| Retail and E-commerce Visualisation | |||
| Manufacturing and Industrial Maintenance | |||
| Defense and Aerospace Simulation | |||
| Real Estate and AEC Visualisation | |||
| By Distribution Channel | Online (Storefront and DTC) | ||
| Offline (Consumer Electronics, Enterprise VARs) | |||
| By Geography | North America | United States | |
| Canada | |||
| Mexico | |||
| Europe | Germany | ||
| United Kingdom | |||
| France | |||
| Nordics | |||
| Rest of Europe | |||
| South America | Brazil | ||
| Rest of South America | |||
| Asia-Pacific | China | ||
| Japan | |||
| India | |||
| South-East Asia | |||
| Rest of Asia-Pacific | |||
| Middle East and Africa | Middle East | Gulf Cooperation Council Countries | |
| Turkey | |||
| Rest of Middle East | |||
| Africa | South Africa | ||
| Rest of Africa | |||


Key Questions Answered in the Report
What is the current size of the AR and VR headsets market?
The AR and VR headsets market stands at USD 6.36 billion in 2026 and is forecast to rise to USD 9.62 billion by 2031.
Which device category is growing the fastest?
Augmented-reality headsets are expanding at a 12.10% CAGR through 2031, outpacing virtual-reality units.
Why are enterprises adopting headsets more rapidly now?
Quantifiable productivity gains—such as Ford’s reduced training time-justify capital spend, and devices now integrate easily with collaboration suites.
What is the biggest supply-chain risk for headset makers?
Limited micro-OLED capacity in Japan and Taiwan constrains premium device output, potentially delaying launches.
How are privacy regulations affecting monetisation strategies?
GDPR treats gaze tracking as sensitive biometric data, imposing strict consent and storage rules that complicate ad-targeting models.
Which region will contribute most to new demand by 2031?
Asia–Pacific leads today and benefits from both manufacturing depth and rising domestic consumption, while the Middle East & Africa records the fastest CAGR at 8.95%.
Page last updated on:


