
API Discovery and Inventory Market Size and Share
Market Overview
| Study Period | 2020 - 2031 |
|---|---|
| Market Size (2026) | USD 1.82 Billion |
| Market Size (2031) | USD 4.37 Billion |
| Growth Rate (2026 - 2031) | 19.13 % |
| Fastest Growing Market | Asia-Pacific |
| Largest Market | North America |
| Market Concentration | Medium |
Major Players *Disclaimer: Major Players sorted in no particular order Image © Mordor Intelligence. Reuse requires attribution under CC BY 4.0. | |
API Discovery and Inventory Market Analysis by Mordor Intelligence
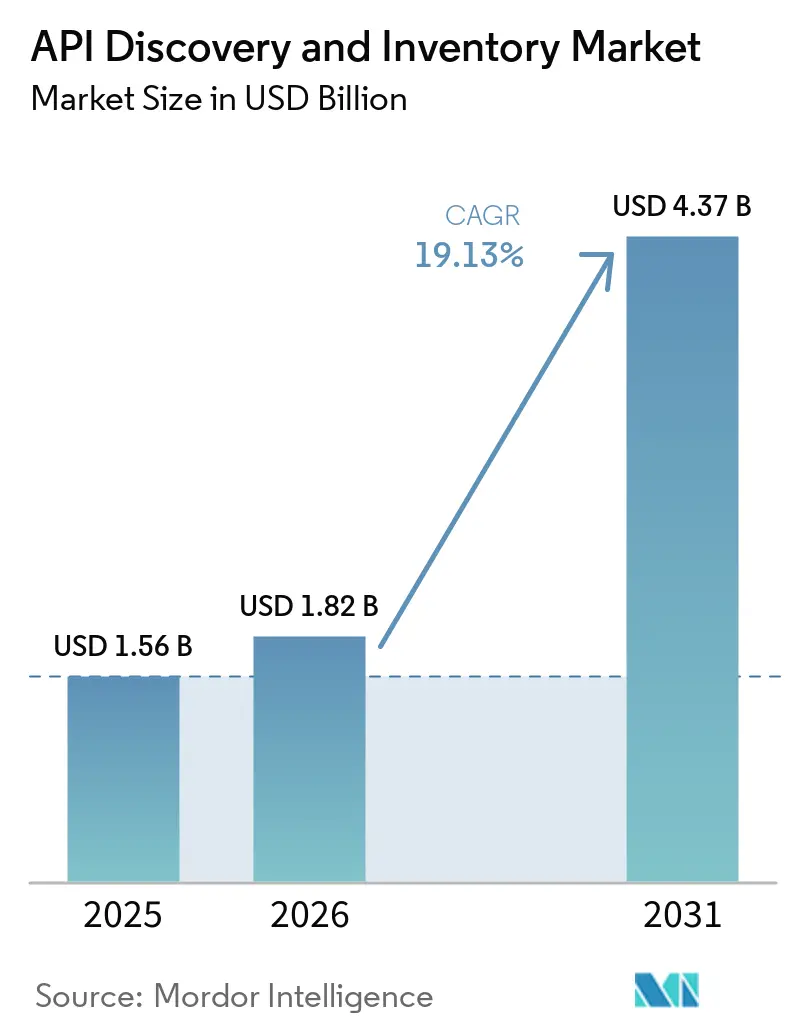
The API discovery and inventory market size is expected to increase from USD 1.56 billion in 2025 to USD 1.9 billion in 2026 and reach USD 4.37 billion by 2031, growing at a CAGR of 19.13% over 2026-2031. Enterprises are managing larger API estates as cloud-native applications, microservices, and AI systems create endpoints faster than conventional governance processes can keep pace with. The resulting gap between deployed and documented APIs is making continuous discovery a core operational requirement. Security, compliance, and data accountability are converging in purchasing decisions, particularly where unknown endpoints can expose sensitive information. Large platform providers are expanding bundled capabilities, while specialist vendors focus on cross-cloud completeness, runtime visibility, and governance for AI agents. These conditions create opportunities for providers to maintain an accurate inventory across changing deployment environments.
Key Report Takeaways
- By component, software held 70.31% of the API discovery and inventory market share in 2025, while services are projected to expand at a 21.62% CAGR through 2031.
- By deployment, cloud held 68.55% of the API discovery and inventory market share in 2025, while hybrid deployment is projected to expand at a 21.06% CAGR through 2031.
- By organization size, large enterprises held 72.16% of the API discovery and inventory market share in 2025, while SMEs are projected to expand at a 21.29% CAGR through 2031.
- By API type, REST APIs held 37.41% of the API discovery and inventory market share in 2025, while event-driven and asynchronous APIs are projected to expand at a 20.74% CAGR through 2031.
- By industry vertical, IT and telecommunication held 22.10% of the API discovery and inventory market share in 2025, while BFSI is projected to expand at a 20.14% CAGR through 2031.
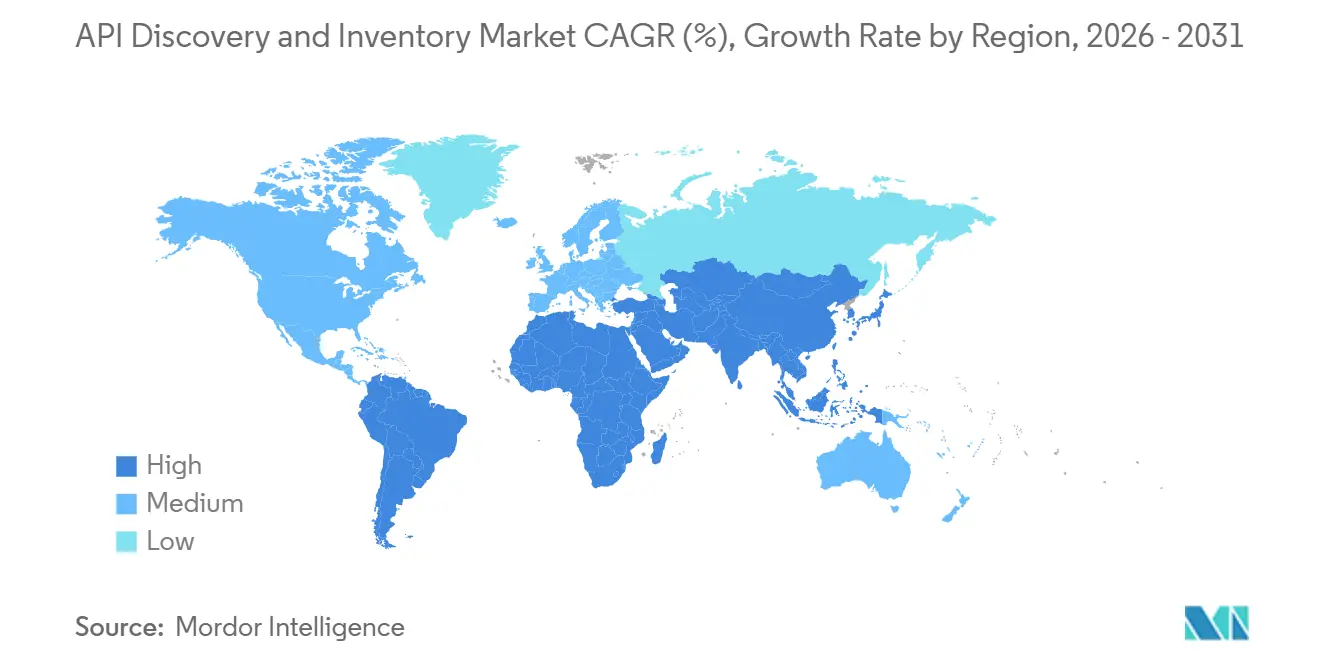
- By geography, North America held 38.19% of the API discovery and inventory market share in 2025, while Asia-Pacific is projected to expand at a 20.37% CAGR through 2031.
Note: Market size and forecast figures in this report are generated using Mordor Intelligence’s proprietary estimation framework, updated with the latest available data and insights as of January 2026.
Global API Discovery and Inventory Market Trends and Insights
Drivers Impact Analysis*
| Driver | (~) % Impact on CAGR Forecast | Geographic Relevance | Impact Timeline |
|---|---|---|---|
| API Sprawl from Cloud-Native and Microservices Architectures | +4.1% | Global | Short term (≤ 2 years) |
| Rising Shadow API and Zombie API Exposure | +3.8% | Global | Short term (≤ 2 years) |
| AI-Generated and Agent-Consumed API Proliferation | +3.3% | North America, Europe, APAC core | Short term (≤ 2 years) |
| Regulatory and Audit Demand For API Asset Accountability | +2.5% | Europe, North America, APAC | Medium term (2-4 years) |
| API Monetization and Developer-Ecosystem Expansion | +1.9% | North America, APAC, South America | Medium term (2-4 years) |
| Agentless Multi-Cloud Discovery for Faster Inventory Coverage | +1.6% | Global | Medium term (2-4 years) |
| Source: Mordor Intelligence | |||
API Sprawl from Cloud-Native and Microservices Architectures
Cloud-native development reduces the time between API creation and the point at which an endpoint requires governance. Microservice-based applications can add many endpoints during a deployment cycle, which makes periodic inventory updates less reliable. Salt Security reported in April 2026 that 66% of organizations saw API counts rise by more than 50% in 1 year.[1]Salt Security, “Salt Security Releases 1H 2026 State of AI and API Security,” Salt Security, salt.security. This pace can exceed the capacity of manual review and registration processes. The API discovery and inventory market benefits when organizations need continuous coverage to apply access policies, rate limits, and lifecycle controls. Automated discovery becomes more important when development teams release services frequently across cloud environments.
Rising Shadow API and Zombie API Exposure
Shadow and zombie APIs extend the need for discovery beyond development teams and into security operations. Salt Security reported in 2025 that 76% of organizations had shadow APIs and 43% had active zombie APIs. Shadow APIs operate without formal documentation, while zombie APIs remain exposed after their intended use has ended. Akamai reported that the share of respondents who knew which inventory APIs returned sensitive data declined from 40% in 2022 to 23% in 2026. Static, gateway-only inventories can miss endpoints that operate outside visible traffic paths. The API discovery and inventory market, therefore, favors platforms that use observed runtime traffic to identify undocumented services and support remediation.
AI-Generated and Agent-Consumed API Proliferation
AI agents create a separate inventory challenge because they can generate and consume APIs without the usual human design review. Salt Security reported in April 2026 that 92% of organizations lacked the security maturity required for agentic environments. This creates pressure to identify endpoints and the agents that access them before gaps become security or compliance problems. These systems can create activity beyond the normal review paths that support API documentation. Machine-readable catalogs help agents interact with documented services rather than relying on incomplete information. The API discovery and inventory market is consequently moving toward tools that combine asset visibility with controls for AI-related activity.
Regulatory and Audit Demand for API Asset Accountability
Regulatory requirements are expanding the role of API inventories within risk and compliance programs. The EU AI Act became generally applicable on August 2, 2026, increasing recordkeeping requirements for APIs that support high-risk AI systems. Organizations need to understand which endpoints expose data, the permissions applied to those endpoints, and the systems that receive the data. This need is especially important where records must be produced for audit or internal review. A current inventory can also support the examination of data flows when services change. The API discovery and inventory market gains relevance when buyers need auditable records of endpoint data exposure and access.
Restraints Impact Analysis*
| Restraint | (~) % Impact on CAGR Forecast | Geographic Relevance | Impact Timeline |
|---|---|---|---|
| Hyperscaler Bundling and Open-Source Substitution | -3.5% | Global | Short term (≤ 2 years) |
| Integration Complexity across Gateways, Meshes, and Runtime Telemetry | -2.6% | Global | Medium term (2-4 years) |
| Inventory Accuracy Erosion from Ephemeral and Encrypted Traffic | -1.8% | Global | Medium term (2-4 years) |
| Cross-Team Ownership Gaps for Remediation and Lifecycle Control | -1.3% | North America and Europe | Long term (≥ 4 years) |
| Source: Mordor Intelligence | |||
Hyperscaler Bundling and Open-Source Substitution
Cloud providers increasingly include catalog, discovery, and governance features in API gateway services. This bundling creates an alternative for buyers that primarily operate within 1 cloud environment. Open-source options such as Kong Community Edition, Gravitee, and Tyk can also appeal to budget-sensitive SMEs that prioritize vendor independence. These options can constrain standalone vendors where requirements are limited to basic catalog functions. Buyers may compare native features with the cost and effort of adding a dedicated platform. The API discovery and inventory market remains more favorable for providers that address multi-cloud estates or strict on-premises requirements that bundled tools may not cover fully.
Integration Complexity Across Gateways, Meshes, and Runtime Telemetry
Accurate inventories depend on integration across gateways, service meshes, serverless runtimes, and traffic telemetry. Each environment can expose metadata through different schemas and refresh cycles. This creates an operational burden because inventory tools must interpret data from multiple sources before presenting a common record. Vendors must maintain connectors and translators for various platforms, which can increase implementation time and professional services costs. The complexity also requires careful control over the integrations that access management and runtime data. Smaller organizations can face longer project schedules when they lack platform engineering resources to manage those integrations.
*Our forecasts treat driver/restraint impacts as directional, not additive. The impact forecasts reflect baseline growth, mix effects, and variable interactions.
Segment Analysis
By Component: Software Leads While Services Support Deployment
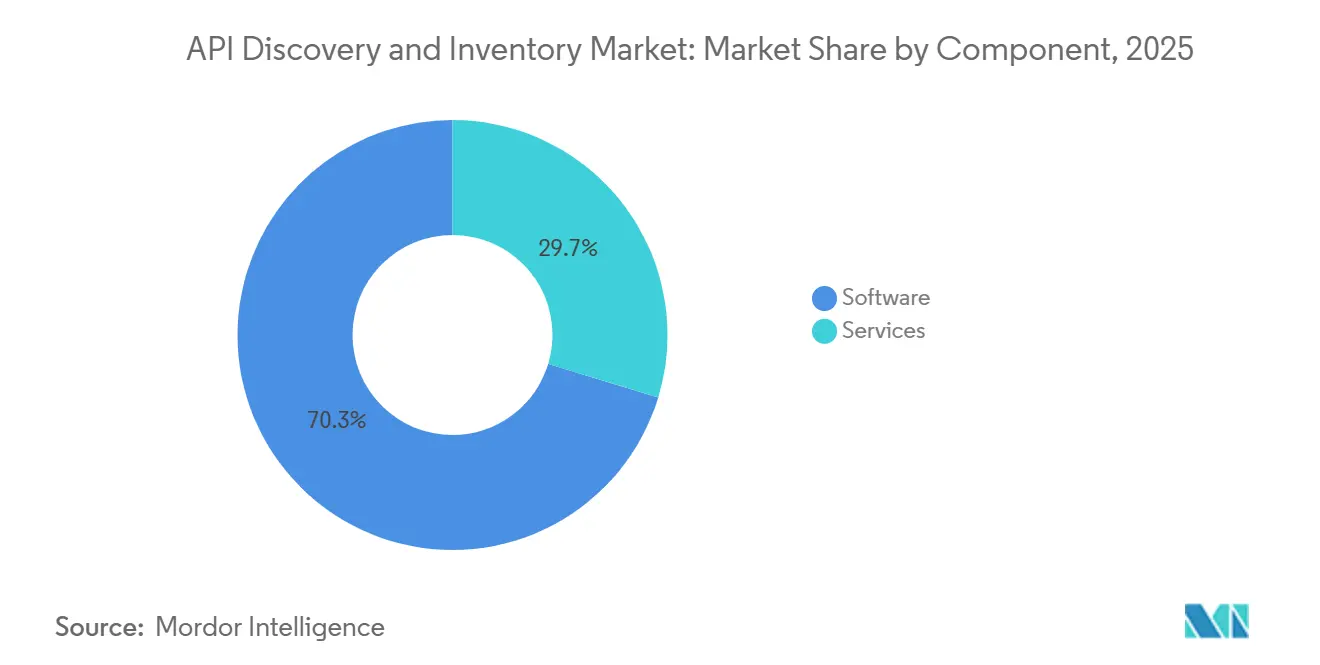
Software accounted for 70.31% of the API discovery and inventory market size in 2025. Catalog platforms, gateway-integrated modules, posture management dashboards, and classification capabilities form the software base for API governance. Many buyers need visibility into existing endpoints before adding managed or advisory services. Services are projected to grow at a 21.62% CAGR through 2031. Implementation consulting, managed discovery, and integration work address undocumented endpoints that software cannot resolve on its own.
Organizations operating across cloud and on-premises environments need help reconciling gateway metadata into 1 governed catalog. Postman introduced an AI-native API platform with an API Catalog in March 2026. The company described the catalog as a unified system of record for APIs and services across more than 40 million developers and 500,000 organizations. Embedded catalog capabilities can reduce the need for discovery-only services in simpler environments. They can still leave demand for lifecycle integration, remediation, and multi-environment governance.


By Deployment: Cloud Leads While Hybrid Demand Expands
Cloud held 68.55% of the API discovery and inventory market share in 2025. SaaS-delivered discovery reduces infrastructure management work and aligns with API estates built in public clouds. Cloud platforms expose API metadata through consoles and observability interfaces, which can help tools establish an initial inventory. Hybrid deployment is projected to expand at a 21.06% CAGR through 2031. Data residency requirements in financial services, healthcare, and government support this demand because traffic metadata may need to remain within an organization’s perimeter.
On-premises deployment remains relevant for air-gapped and heavily regulated environments. Defense, critical infrastructure, and banking organizations may restrict the movement of API metadata through public networks. WSO2 released its API Platform in March 2026 with self-managed, SaaS, and hybrid options under a unified control plane. The platform supports federation across Kong, AWS API Gateway, and Azure API Management. Vendors that cannot operate across cloud, hybrid, and on-premises models can face weaker positions in regulated procurement.
By Organization Size: Large Enterprises Lead While SMEs Gain Access
Large enterprises held 72.16% of the API discovery and inventory market share in 2025. Their multi-gateway and multi-cloud estates often require role-based access, version histories, and audit trails. Board-level security and compliance requirements can also support multi-year platform investments. SMEs are projected to grow at a 21.29% CAGR through 2031. Subscription SaaS products and open-source editions can lower entry costs for smaller technology teams.
AI-assisted development environments can make API specification work less burdensome for SMEs. A 2026 IEEE conference paper found that policy-as-code approaches and automated CI/CD gates can provide governance standards without the resource requirements of manual models. This makes governance more manageable as a configuration process rather than a dedicated headcount requirement. Smaller organizations can therefore formalize inventories earlier in their development cycle. Adoption still depends on whether integration needs remain proportionate to an SME’s platform capacity.
By API Type: REST Retains Scale While Asynchronous APIs Grow
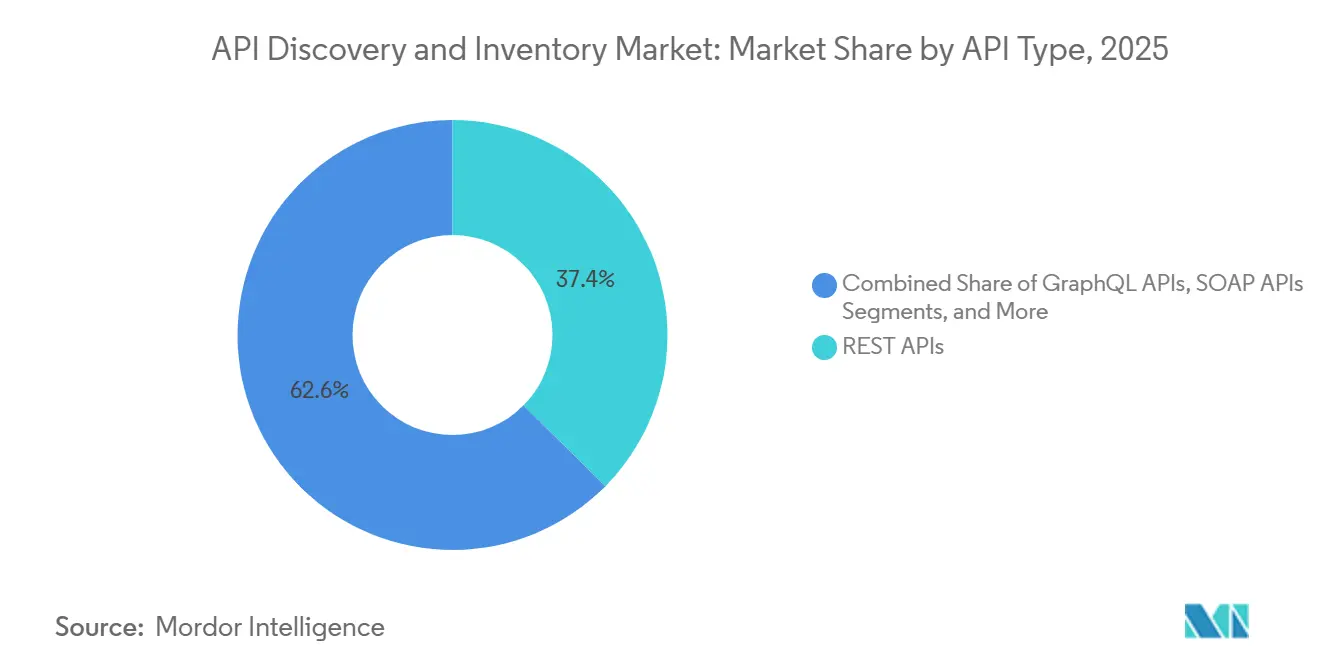
REST APIs accounted for 37.41% of the API discovery and inventory market size in 2025. Their installed base remains large because REST supports many public, partner, and internal interfaces. Tooling compatibility and the OpenAPI ecosystem also reinforce continued use. A 2026 peer-reviewed study found that enterprises often combine REST for public interfaces, gRPC for internal services, and GraphQL for aggregation. Discovery platforms, therefore, need to recognize multiple API styles to provide a complete inventory.
Event-driven and asynchronous APIs are projected to grow at a 20.74% CAGR through 2031. Real-time financial data, logistics tracking, streaming media, and AI-agent messaging contribute to their wider use. A 2024 peer-reviewed study reported that 76.4% of organizations were implementing GraphQL, event-driven architectures, or API mesh solutions. AsyncAPI, Kafka, WebSocket, and event-streaming protocols require collection logic that differs from conventional HTTP endpoint discovery. Providers that can catalog event streams and synchronous APIs together can become more difficult to replace within enterprise accounts.

By Industry Vertical: IT and Telecom Lead While BFSI Accelerates
IT and telecommunication accounted for 22.10% of the API discovery and inventory market size in 2025. Telecom operators expose 5G network APIs for developers, while technology firms rely on internal microservice catalogs. The sector adopted DevOps and API-first methods earlier than many other industries. BFSI is projected to expand at a 20.14% CAGR through 2031. Open banking rules and API monetization strategies make inventory quality a compliance and revenue requirement for financial institutions.
BFSI adoption is supported by open banking requirements and API monetization strategies that make inventory quality a compliance and revenue requirement for financial institutions. Sensedia reported 25% global growth in 2025, citing expansion in open finance and AI adoption among financial services clients.[2]Sensedia Tecnologia, “Sensedia Demonstrates Impressive Traction Through First Half of 2025,” Sensedia, sensedia.com. Banco Inter and Ebanx were among the accounts cited by the company. Healthcare and life sciences also require documented APIs for patient data exchange under HL7 FHIR interoperability requirements. Government, retail, transportation, energy, media, education, and research organizations add demand as digital programs increase their API footprints.
Geography Analysis
North America held 38.19% of the API discovery and inventory market share in 2025. The region has a dense concentration of cloud infrastructure, experienced DevOps talent, and enterprise buyers that place API governance within security and technology functions. The United States supports this position through its cloud-native software companies, API vendors, and major financial institutions. Canada adds demand through its federal Directive on Service and Digital.
Europe has a distinct demand profile because compliance is often the key procurement factor. The European Banking Authority maintains technical standards for open banking API estates. Germany, the United Kingdom, France, Italy, and the BENELUX countries account for much of the region’s enterprise demand. Other European markets are adding demand as digitization programs increase API use. The EU AI Act’s general application date of August 2, 2026, adds recordkeeping needs for high-risk AI systems.
Asia-Pacific is projected to expand at a 20.37% CAGR through 2031. National data accountability and data localization requirements support API-level governance across major regional economies. India’s digital public infrastructure, South Korea’s fintech activity, and Australia’s privacy reform broaden the regional opportunity. Microsoft announced a USD 2.9 billion investment in Japan in 2024 to expand cloud and AI infrastructure.[3]Microsoft Corporation, “Microsoft Announces USD 2.9 Billion Investment in Japan,” Microsoft, news.microsoft.com. The Middle East, Africa, and South America remain earlier-stage areas, with demand concentrated in financial services and government. Brazil is a notable South American market because PIX and Open Finance have supported API investment at leading banks.

Competitive Landscape
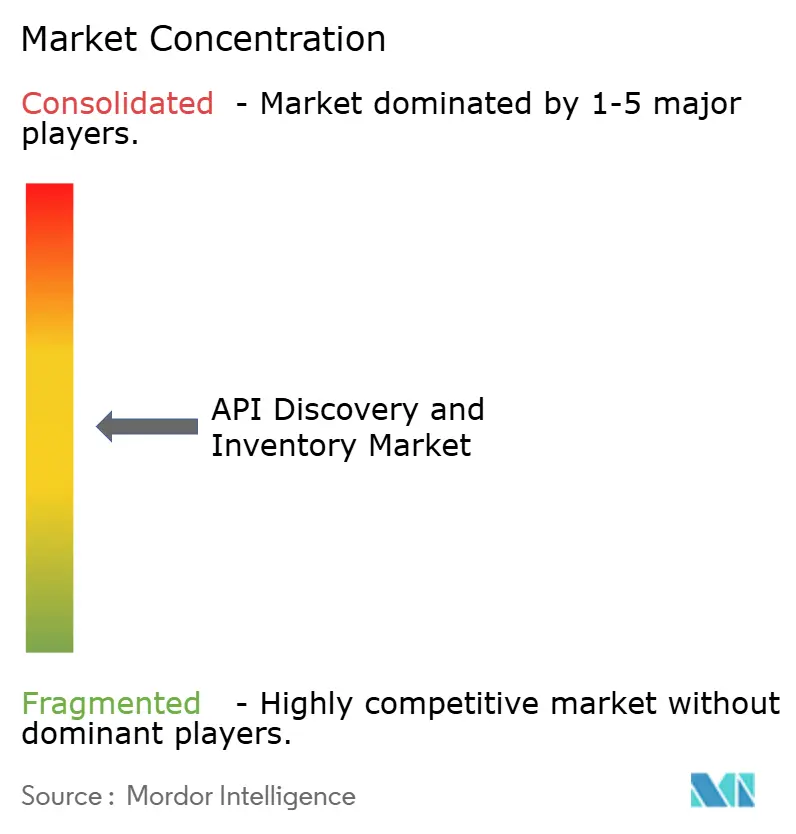
The API discovery and inventory market is moderately fragmented. Hyperscalers have large installed bases through infrastructure bundling, while specialist vendors compete through cross-environment coverage, behavioral analysis, and AI-agent governance. Competition is shifting toward accuracy for ephemeral, encrypted, and agent-generated traffic. Akamai announced its intent to acquire Noname Security in May 2024 for USD 450 million.[4]Akamai Technologies, “Akamai Announces Intent to Acquire API Security Company Noname Security,” Akamai Technologies, ir.akamai.com. The transaction combined API discovery and shadow API detection with Akamai’s security platform.
Traceable merged with Harness in March 2025 and became part of Harness API Security. Postman completed its acquisition of Fern in January 2026. The acquisition added documentation and SDK-generation capabilities that support machine-readable API catalogs. Kong launched Context Mesh in February 2026 to discover enterprise APIs and make them available as agent-consumable tools. These moves show different routes to differentiation, including platform integration, developer workflow coverage, and AI-agent tooling.
Inventory accuracy remains difficult in ephemeral and encrypted environments because standard traffic collection can introduce latency or compliance issues. AI-agent identity governance is another gap, particularly where buyers need to identify an agent, its authorization context, and the API endpoint it used. Cross-gateway federation also remains important for organizations using more than 5 gateway products. WSO2 and Kong have introduced products that address multi-gateway and agent-related management needs.
API Discovery and Inventory Industry Leaders
Microsoft Corporation
Salesforce, Inc.
IBM Corporation
Oracle Corporation
SAP SE
- *Disclaimer: Major Players sorted in no particular order

Recent Industry Developments
- August 2026: Salt Security debuted an AWS WAF managed ruleset designed to secure traditional APIs and AI agent interactions, including Model Context Protocol endpoints. It was available through AWS Marketplace and could be attached to existing web ACL configurations without proxies or traffic redirection.
- August 2026: Microsoft released a dedicated AI Gateway tier for Azure API Management in public preview. The tier organized its control plane around AI models, MCP servers, and tools, and supported routing across Foundry-hosted models, AWS Bedrock, and Google Vertex AI.
- May 2026: Sensedia released its AI Gateway to general availability. The platform was positioned as a real-time governance layer between autonomous agents and enterprise systems, applying policy at the point of action.
- May 2026: Boomi announced its intent to acquire Lunar.dev to extend governed agent connectivity across enterprise systems. The acquisition was expected to add an MCP gateway to Boomi Connect and support connectivity through more than 1,000 managed, MCP-enabled tools.


Global API Discovery and Inventory Market Report Scope
The API Discovery and Inventory Market comprises software platforms and associated services designed to automatically identify, catalog, classify, monitor, and maintain a comprehensive inventory of APIs across enterprise environments. These solutions provide continuous visibility into known, unknown, shadow, zombie, internal, external, partner, and third-party APIs deployed across on-premises, cloud, hybrid, and multi-cloud infrastructures. The market includes technologies that discover APIs through network traffic analysis, code repositories, gateways, application integrations, runtime environments, and cloud-native architectures, enabling organizations to establish an authoritative inventory of API assets and their associated metadata. API discovery and inventory solutions help enterprises improve API governance, security posture, compliance, lifecycle management, risk assessment, and operational visibility by maintaining accurate records of API endpoints, versions, owners, dependencies, authentication methods, and exposure levels.
The API Discovery and Inventory Market Report is Segmented by Component (Software and Services), Deployment (Cloud, On-Premises, and Hybrid), Organization Size (Large Enterprises and Small and Medium-Sized Enterprises), API Type (REST APIs, GraphQL APIs, SOAP APIs, gRPC and Other RPC APIs, and Event-Driven and Asynchronous APIs), Industry Vertical (Government and Public Administration, Industrial Manufacturing, Retail and E-Commerce, Transportation and Logistics, Energy and Utilities, Oil and Gas, IT and Telecommunication, Media and Entertainment, Education and Research Institutions, Healthcare and Life Sciences, Banking, Financial Services, and Insurance [BFSI], and Other Industry Verticals), and Geography (North America, South America, Europe, Asia-Pacific, and Middle East and Africa). The Market Forecasts are Provided in Terms of Value (USD).
| Software |
| Services |
| Cloud |
| On-Premises |
| Hybrid |
| Large Enterprises |
| Small and Medium-Sized Enterprises |
| REST APIs |
| GraphQL APIs |
| SOAP APIs |
| gRPC and Other RPC APIs |
| Event-Driven and Asynchronous APIs |
| Government and Public Administration |
| Industrial Manufacturing |
| Retail and E-Commerce |
| Transportation and Logistics |
| Energy and Utilities |
| Oil and Gas |
| IT and Telecommunication |
| Media and Entertainment |
| Education and Research Institutions |
| Healthcare and Life Sciences |
| Banking, Financial Services, and Insurance (BFSI) |
| Other Industry Verticals |
| North America | United States | |
| Canada | ||
| Mexico | ||
| South America | Brazil | |
| Argentina | ||
| Rest of South America | ||
| Europe | Germany | |
| United Kingdom | ||
| France | ||
| Italy | ||
| BENELUX | ||
| Rest of Europe | ||
| Asia-Pacific | China | |
| Japan | ||
| India | ||
| South Korea | ||
| Australia | ||
| Rest of Asia-Pacific | ||
| Middle East and Africa | Middle East | United Arab Emirates |
| Saudi Arabia | ||
| Rest of Middle East | ||
| Africa | South Africa | |
| Nigeria | ||
| Egypt | ||
| Rest of Africa | ||
| By Component | Software | ||
| Services | |||
| By Deployment | Cloud | ||
| On-Premises | |||
| Hybrid | |||
| By Organization Size | Large Enterprises | ||
| Small and Medium-Sized Enterprises | |||
| By API Type | REST APIs | ||
| GraphQL APIs | |||
| SOAP APIs | |||
| gRPC and Other RPC APIs | |||
| Event-Driven and Asynchronous APIs | |||
| By Industry Vertical | Government and Public Administration | ||
| Industrial Manufacturing | |||
| Retail and E-Commerce | |||
| Transportation and Logistics | |||
| Energy and Utilities | |||
| Oil and Gas | |||
| IT and Telecommunication | |||
| Media and Entertainment | |||
| Education and Research Institutions | |||
| Healthcare and Life Sciences | |||
| Banking, Financial Services, and Insurance (BFSI) | |||
| Other Industry Verticals | |||
| By Geography | North America | United States | |
| Canada | |||
| Mexico | |||
| South America | Brazil | ||
| Argentina | |||
| Rest of South America | |||
| Europe | Germany | ||
| United Kingdom | |||
| France | |||
| Italy | |||
| BENELUX | |||
| Rest of Europe | |||
| Asia-Pacific | China | ||
| Japan | |||
| India | |||
| South Korea | |||
| Australia | |||
| Rest of Asia-Pacific | |||
| Middle East and Africa | Middle East | United Arab Emirates | |
| Saudi Arabia | |||
| Rest of Middle East | |||
| Africa | South Africa | ||
| Nigeria | |||
| Egypt | |||
| Rest of Africa | |||


Key Questions Answered in the Report
What is the size of the API discovery and inventory market?
The API discovery and inventory market size is expected to be USD 1.9 billion in 2026 and reach USD 4.37 billion by 2031, at a 19.13% CAGR.
Why do enterprises need API discovery tools?
These tools help organizations identify documented, shadow, and inactive endpoints so they can apply security, access, and lifecycle controls.
Which deployment model leads API discovery adoption?
Cloud held 68.55% share in 2025, while hybrid deployment is projected to grow at a 21.06% CAGR through 2031.
Which organizations are adopting API inventory platforms fastest?
SMEs are projected to grow at a 21.29% CAGR through 2031 as SaaS and open-source options reduce adoption barriers.
Which API type is growing fastest?
Event-driven and asynchronous APIs are projected to grow at a 20.74% CAGR through 2031 because more organizations are using real-time and agent-based systems.
Which region is expanding fastest for API inventory platforms?
Asia-Pacific is projected to grow at a 20.37% CAGR through 2031, supported by data accountability requirements and digital infrastructure expansion.
Page last updated on:





