
Market Overview
| Study Period | 2020 - 2031 |
|---|---|
| Forecast Data Period | 2026 - 2031 |
| Historical Data Period | 2020 - 2024 |
| Market Size (2026) | USD 60.78 Billion |
| Market Size (2031) | USD 80 Billion |
| Growth Rate (2026 - 2031) | 5.65 % |
| Market Concentration | Medium |
Major Players *Disclaimer: Major Players sorted in no particular order Image © Mordor Intelligence. Reuse requires attribution under CC BY 4.0. | |

Thailand Real Estate Market Analysis by Mordor Intelligence
The Thailand real estate market size is estimated at USD 60.78 billion in 2026 and is expected to reach USD 80.00 billion by 2031, growing at a 5.65% CAGR during 2026 to 2031. The 2026 inflection reflects pressure from weak mid-income purchasing power, high household debt, and tighter underwriting, while public infrastructure projects, targeted government stimulus, and foreign capital in luxury and logistics help sustain activity in select corridors. Developers listed in Bangkok are shifting toward logistics and industrial assets within the Eastern Economic Corridor, where demand links to e-commerce and data center investments. Government measures such as fee cuts on property transfers and loan-to-value relaxations are intended to clear transactions at the margin, even as banks maintain prudent credit standards due to balance sheet risks. Monetary easing since August 2025 and mass transit additions around the MRT Orange Line are expected to improve sentiment and stabilize transfer volumes into mid-2026 as project timelines progress.[1]
Key Report Takeaways
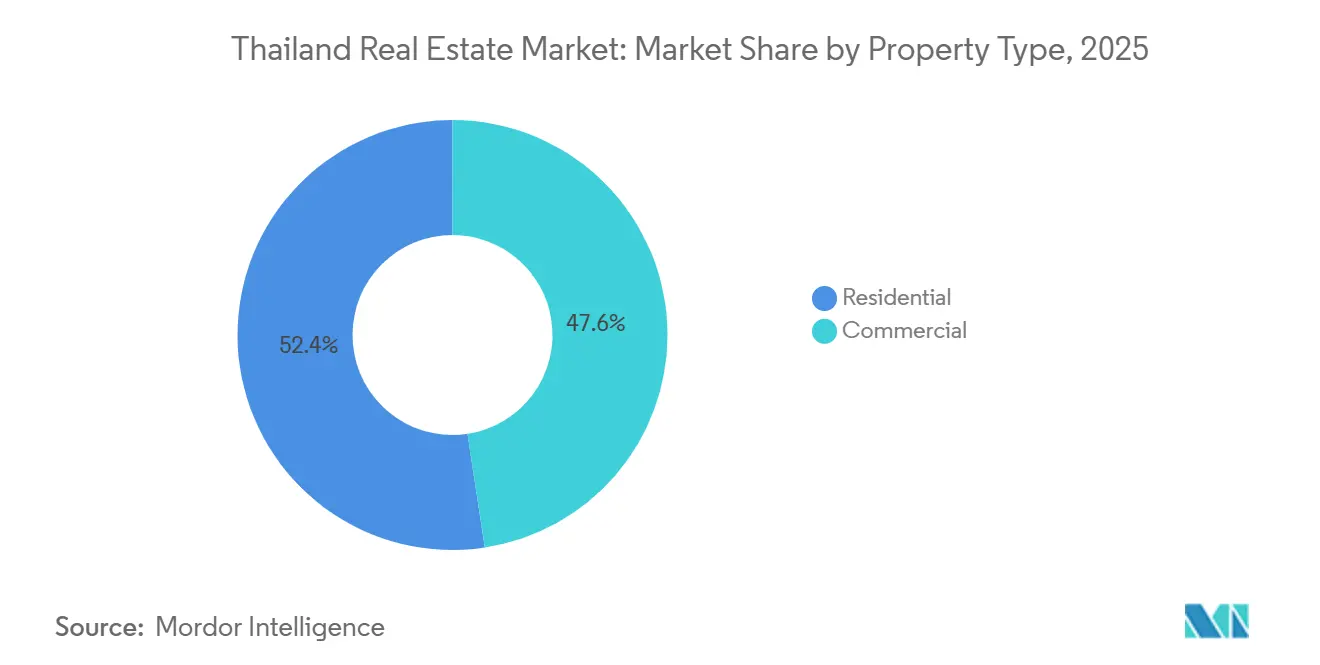
- By property type, residential accounted for 52.4% revenue share in 2025, while commercial is projected to expand at a 6.22% CAGR through 2031.
- By business model, sales held a 70.2% share in 2025, while rentals are forecast to grow at a 6.41% CAGR through 2031.
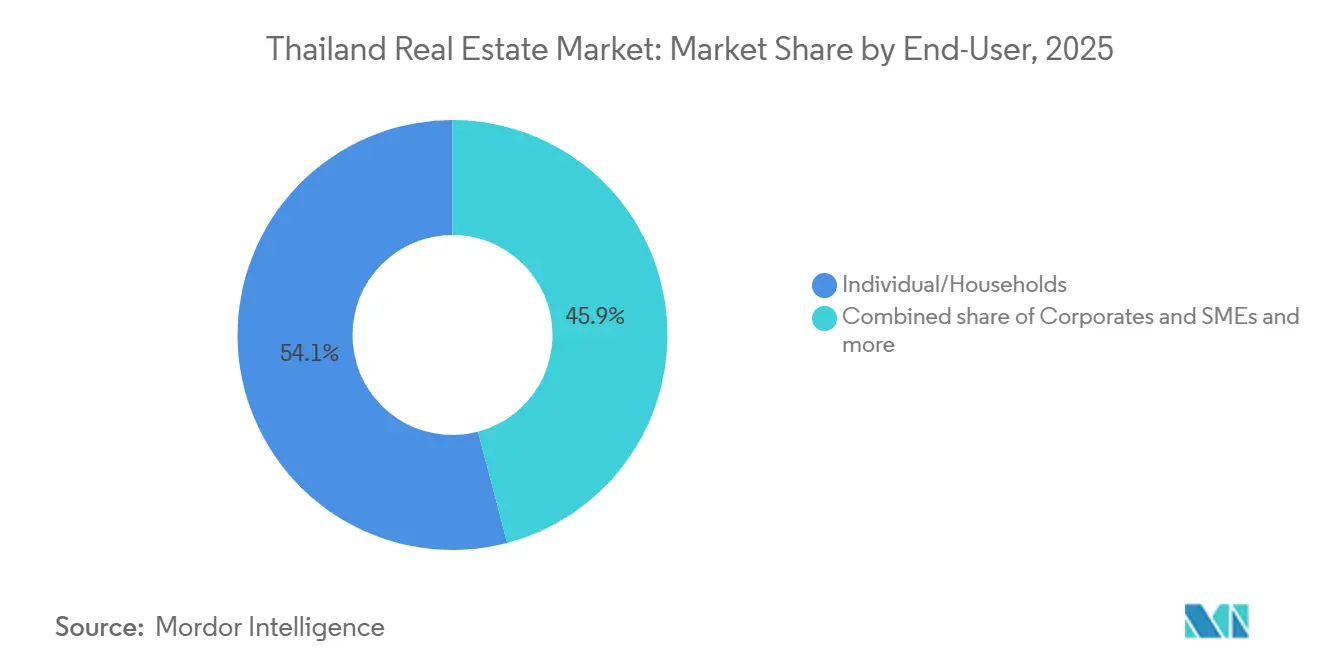
- By end-user, individuals and households captured a 54.1% share in 2025, while corporates and SMEs are projected to record a 6.30% CAGR through 2031.
- By geography, Bangkok led with a 53.1% share in 2025, while Phuket is projected to grow at a 4.10% CAGR during 2026 to 2031.
Note: Market size and forecast figures in this report are generated using Mordor Intelligence’s proprietary estimation framework, updated with the latest available data and insights as of January 2026.
Thailand Real Estate Market Trends and Insights
Drivers Impact Analysis*
| Drivers | (~) % Impact on CAGR Forecast | Geographic Relevance | Impact Timeline |
|---|---|---|---|
| Transit expansion and infrastructure upgrades | +2.0% | Bangkok, Eastern Economic Corridor, regional cities | Long term (≥ 4 years) |
| E-commerce driven logistics demand | +1.7% | Eastern Economic Corridor core, Bangkok Metropolitan Region (Samut Prakan) | Medium term (2-4 years) |
| Government incentives and fee cuts | +1.3% | Nationwide, Bangkok-centric | Medium term (2-4 years) |
| Rising foreign buyer interest | +1.2% | Bangkok, Phuket, Pattaya, Chiang Mai | Medium term (2–4 years) |
| Large mixed-use schemes | +1.0% | Bangkok, CBD, Phuket | Medium term (2–4 years) |
| Limited premium supply and higher build costs | +1.0% | Bangkok, CBD, Phuket | Long term (≥ 4 years) |
| Source: Mordor Intelligence | |||
Transit expansion and infrastructure upgrades
Transit additions are shaping how demand forms across Bangkok’s core and periphery in 2026. New mass-transit lines improve accessibility and are expected to lift values and absorption near stations as construction progresses in the 2026 to 2027 window. The Bangkok to Nakhon Ratchasima high-speed rail, slated to open in 2028, also supports land assembly and planning activity in secondary cities that benefit from future connectivity. Early data on the Pink Line’s launch showed a burst of transfers followed by softer absorption in mid-priced suburban condominiums, which signals that station proximity alone does not guarantee sustained take-up without strong job anchors nearby. Developers are increasing focus on transit-proximate, lower-rise projects priced below THB 10 million (USD 285,714), targeting owner-occupiers who value safety, access, and resilience. This selective transit-oriented strategy favors corridors that pair mobility gains with employment density and livability improvements, rather than transit alignment alone.[2]
Government incentives and fee cuts
Fiscal and macroprudential steps are supporting transactions, but cannot fully offset household debt constraints. Authorities reduced transfer and mortgage registration fees to 0.01% for homes priced up to THB 7 million (USD 200,000), which is expected to lift near-term transaction counts but does not resolve credit screening hurdles for mid-income buyers. The loan-to-value relaxation to 100% for second homes priced below THB 10 million (USD 285,714) was designed to stimulate upper mid-market demand, yet bank underwriting remains cautious in segments exposed to high rejection rates. Developers postponed some planned projects in 2025 as presales fell short of targets, while luxury units maintained stronger absorption, underscoring liquidity concentration at the top end. Subsidized housing programs expand access and create price reference points, but private developers still face margin pressure in overlapping catchments. New responsible lending rules effective January 2025, including preemptive debt restructuring guidelines, acknowledge that fee cuts alone will not revive mass-market demand without household balance sheet repair.[3]
Rising foreign buyer interest
Foreign buying has shifted toward lifestyle-led ownership in tourism and business nodes, replacing pre-pandemic speculative activity. Phuket registered a year-over-year rise in foreign condominium transfers in 2025 despite variability in tourist arrivals, which points to longer-stay usage and family-oriented purchases. Bangkok submarkets such as Sukhumvit and Sathorn continue to draw cross-border demand, with branded residences appealing to buyers who value professional property management and asset quality. Regulators tightened anti-money-laundering disclosures for higher value transactions in late 2025, which improves transparency and should support investor confidence in premium segments. The decision in September 2025 to shelve an extended leasehold tenure proposal and to maintain the current regime of freehold for condominiums continues to influence buyer preference toward freehold assets. This pattern supports long-duration demand in select urban and resort markets and concentrates activity within internationally familiar ownership frameworks.
Logistics Demand Absorbing EEC Industrial Land Faster Than Residential Recovers
Warehouse and logistics assets are outpacing residential recovery in 2026. Occupancy remains high even as new supply enters, helped by e-commerce growth and network expansion in fulfillment and last mile logistics. The Eastern Economic Corridor concentrates the majority of future warehouse pipeline and is benefitting from data center investment, which lifts industrial land values and REIT demand. Developers historically oriented to residential are redirecting capital toward built-to-suit warehouses as access to institutional capital and REIT structures supports stable yields. Leading industrial REITs have maintained strong occupancy and competitive distribution yields, reinforcing a financing edge relative to housing-focused structures. Power transmission capacity is an execution risk in parts of the EEC, and authorities are prioritizing approvals and upgrades to sustain the data center and manufacturing pipeline.
Restraints Impact Analysis*
| Restraints | (~) % Impact on CAGR Forecast | Geographic Relevance | Impact Timeline |
|---|---|---|---|
| Weak mid-income housing demand amid high debt | -1.5% | Nationwide, suburban Bangkok | Short term (≤ 2 years) |
| Urban condo oversupply | -1.0% | Bangkok Metropolitan Region | Medium term (2-4 years) |
| Broader economic uncertainty and inflation | -0.7% | Nationwide | Short term (≤ 2 years) |
| Planning delays and zoning issues | -0.4% | Bangkok and secondary cities | Medium term (2-4 years) |
| Source: Mordor Intelligence | |||
Weak mid-income housing demand amid high debt
Household debt levels and prudent underwriting are suppressing approval rates for homes priced below THB 3 million (USD 85,714). Rising non-performing and special mention loans have led banks to formalize affordability testing and residual income thresholds under responsible lending rules introduced in January 2025. High rejection rates for lower-priced homes raise inventory carry and discount pressure for developers focused on mid-income segments. Developers have experimented with rent-to-own and seller financing to convert the pipeline, which shifts credit risk back to corporate balance sheets. New housing launches were curtailed in 2025 as firms recalibrated exposure to the most credit-constrained demand pools. Structural affordability will remain a constraint until income growth and household deleveraging improve debt service metrics in this price band.
Urban condo oversupply
Urban condo inventory remains elevated in some suburban corridors, which slows absorption and flattens pricing during 2026. Developers who front-loaded launches during earlier transit announcements found demand concentrated in core CBD locations rather than fringe stations with weaker job proximity. Investors have become more selective on project quality, management, and long-run rental prospects in these corridors. Developers responded by reducing new launch exposure and prioritizing formats with more predictable take-up, including low-rise housing and build-to-rent near employment nodes. The oversupply overhang will take time to resolve through a combination of moderated launches, unit reconfiguration, and incremental owner-occupier absorption aligned with new transit and job growth.
*Our forecasts treat driver/restraint impacts as directional, not additive. The impact forecasts reflect baseline growth, mix effects, and variable interactions.
Segment Analysis
By Property Type: Commercial Assets Outpacing Residential as Data Centers Reshape Industrial Estates
Residential properties were the largest by revenue with a 52.4% share in 2025, indicating the balance of consumer demand within the Thailand real estate market. Commercial assets are advancing as the fastest-growing segment at a 6.22% CAGR during 2026 to 2031 as data center approvals and logistics expansion in the EEC attract new capital allocations. The Board of Investment cleared a wave of digital infrastructure and related investments in 2024 to 2025, including multi-billion-dollar commitments that anchor industrial estate leasing and power procurement strategies. This cycle raises the importance of power availability and zoning near hyperscale sites and has prompted listed developers to build warehousing capacity consistent with institutional-grade tenancy. Apartments and condominiums still hold the largest share within residential, while detached houses are benefiting from buyer preference for more space and safety in outer Bangkok zones.
Hospitality shows steady recovery on the back of tourism, with operators emphasizing asset enhancements and mixed-use integration to improve earnings durability. Office fundamentals are mixed in 2026 as Grade A vacancy remains elevated during a flight to quality, with ESG-certified towers gaining relative strength while secondary assets deploy concessions and upgrades. Retail assets in prime locations continue to attract tenants, though e-commerce competition keeps pressure on formats that do not provide experiential value. Logistics warehouse occupancy and rents are supported by e-commerce and cold chain requirements, with REIT demand providing additional liquidity and development pipeline certainty. Against this backdrop, commercial momentum is expected to remain the outlier for the Thailand real estate market through 2031 based on anchor tenant demand and financing models suited to long leases.

By Business Model: Rental Operations Gaining as Generation Rent Emerges
Sales accounted for 70.2% in 2025, reflecting entrenched ownership patterns in value terms across the Thailand real estate market. Rentals are growing faster at a 6.41% CAGR through 2031 due to younger cohorts that prefer flexibility, stricter mortgage screening, and steady demand from expatriates and remote workers. Surveys in 2025 indicated a clear tilt by Gen Z and Gen Y toward leasing, which supports the buy-to-rent pipeline and the professionalization of property management. In prime Bangkok locations, rental inflation outpaced purchase price gains in parts of 2025, which helped stabilize yields for well-located units. These patterns are consolidating a durable renter base near mass transit, job hubs, and international schools, and they reinforce multi-format strategies that blend serviced apartments with branded residence management.
Institutional structures reinforce this shift. Industrial REITs such as FPT Industrial REIT maintained 90.6% occupancy in FY2025 and delivered competitive distributions, which underpins new warehouse development by listed sponsors. SET rule changes that reduced barriers to REIT formation have expanded monetization paths for mid-tier developers, aligning with a greater share of recurring income in the corporate mix. Developers are testing rent-to-own to convert unqualified buyers over multi-year horizons, which could broaden eventual ownership for households outside bank credit boxes. This evolution points to a more balanced Thailand real estate industry structure by 2031, in which sales-led models coexist with scalable rental platforms that can be securitized.
By End-user: Corporates Driving Fastest Growth Through EEC Manufacturing Relocations
Individuals and households represented 54.1% of end-user demand in 2025 and continue to anchor residential activity in the Thailand real estate market. Corporates and SMEs are the fastest-growing cohort at a 6.30% CAGR, driven by relocations under China Plus One strategies and a rising tally of BOI applications in electronics, EVs, and semiconductors. FDI commitments in manufacturing and digital infrastructure are spurring demand for worker dormitories, serviced apartments, and built-to-suit facilities that cluster near EEC estates. Office leasing also reflects corporate consolidation into higher-quality assets with stronger sustainability credentials and building systems. This corporate-led demand adds a stable layer to the Thailand real estate market through long leases and capex plans linked to production timelines.
Within individuals and households, high-net-worth buyers sustained activity in the luxury segments, while mid-income cohorts faced bank screening hurdles that delayed transfers and capped presales momentum in 2025. Large developers allocated new project pipelines toward higher price points and more resilient locations where take-up has proven more consistent. Public sector programs, including subsidized housing, help at the margin and guide private supply into designated corridors, particularly near future transit. This mix keeps corporates as the main incremental growth engine across EEC-linked assets while households continue to determine absolute volume in core residential formats.
Geography Analysis
Bangkok led in 2025 with 53.1% of the national value, underscoring its central role in the Thailand real estate market size and is expected to remain the anchor while growth diffuses to select corridors. Absorption patterns show a split between premium CBD inventories and mid-tier suburban condominiums, with luxury units supported by brand, service, and global buyer familiarity. Grade A office vacancy stayed high into late 2025, although top-tier ESG-certified buildings in core nodes continue to outperform with better occupancy and pricing power. Upcoming mass transit extensions, including the Orange Line and the Dark Red Line extension, are expected to lift nearby land values and support a measured pickup in launches and transfers through 2026 to 2027. The city planning revision expected in 2027 is likely to unlock density in targeted zones and encourage mixed-use development around stations.
Phuket is the fastest-growing major city with a projected 4.10% CAGR during 2026 to 2031 on the back of sustained foreign interest and an upgraded infrastructure base. Foreign condominium transfers increased in 2025, with purchases oriented to longer stays and professionally managed projects. Villa markets in key subdistricts remain supported by limited titled land, enhanced connectivity, and resident-led spending that supports premium services. Hotel and resort pipelines continue to expand, which requires careful pacing to avoid near-term occupancy pressure during seasonal and origin-market swings. Phuket’s positioning complements Bangkok by offering a resort-led alternative that attracts extended-stay buyers and families who value service and lifestyle over purely investment-led returns.
The EEC provinces anchor industrial and logistics growth, with patterns that spill into residential and rental housing near estates and data centers. Pattaya and Chonburi benefit from proximity to Bangkok and a planned high-speed rail that will shorten travel times, while demand in Hua Hin and other coastal towns reflects lifestyle and weekend-home preferences. Chiang Mai continues to serve a mix of retirees and remote professionals with more modest price growth compared with coastal or Bangkok locations. Regulatory rules that cap foreign freehold ownership in condominiums and the shelving of longer leasehold proposals continue to shape geographic flows of foreign capital toward freehold units in approved zones. These regional dynamics together define how the Thailand real estate industry balances its core capital region with targeted growth poles along the eastern seaboard and tourism-led islands.
Regulatory Landscape
Thailand's real estate regulatory framework is anchored by the Ministry of Interior's Department of Lands for registration and titling, while project-level development obligations are shaped by housing and planning statutes. From March 2026, implementation of the Land Allocation Act (No. 3) B.E. 2568 (2025) began to tighten buyer protections in housing estates, including stronger requirements around utilities and common-area maintenance guarantees and clearer treatment of common-area fee setting. This increases compliance and documentation demands for developers.
Foreign participation continues to be permitted mainly through condominium freehold within existing limits and through investment-promotion channels for land use in business contexts. In January 2026, the Board of Investment (BOI) issued Announcement No. 3/2569 introducing additional corporate income tax incentives tied to large capital investment thresholds, reinforcing the policy tilt toward industrial and digital-infrastructure-linked real estate. BOI-promoted, foreign-controlled companies also have a defined route to own land for executive residences and corporate offices under Section 27 of the Investment Promotion Act, while residential land ownership remains generally restricted outside these promoted structures.
Value Chain Analysis
Thailand's real estate value chain runs from land sourcing and due diligence (title verification, zoning checks, and transaction structuring) through development (design, permitting, and construction procurement), sales and leasing (brokerage, marketing, and mortgage origination), and post-handover operations (juristic-person management, facilities maintenance, and asset or property management). The Department of Lands is a pivotal node because it validates and records transfers, mortgages, and long leases, so registry processing and compliance documentation act as a practical throughput constraint for both primary and secondary transactions.
Upstream, developers coordinate contractors and building-material suppliers while increasingly aligning specifications with emerging sustainability frameworks and lender requirements. The May 2025 Thailand Taxonomy Board guidance for the construction and real estate sector provides a reference point for low-carbon and resource-efficiency practices that can feed into design choices, materials selection, and project reporting for institutional capital. On the risk and compliance side, May 2026 brought an Urgent Circular (No. MT 0515.2/V 10722) from the Department of Lands directing intensified enforcement against foreign nominee land holding, increasing scrutiny on ownership structures and documentation across acquisition, financing, and eventual sale processes.
Competitive Landscape
The Thailand real estate market is moderately concentrated. The five largest residential developers together account for a little more than half of active project value, while industrial logistics and hospitality are led by specialized operators and listed REIT sponsors. Competitive intensity in mid-income housing has compressed margins to single digits for several listed developers as sales costs and financing burdens rose relative to revenue. In response, balance sheets are tilting toward logistics, light industrial, and recurring-income platforms that align with institutional capital and REIT structures. Luxury-branded residences that command pricing premiums serve as another hedge for developers with established marketing and property management capabilities. This set of strategies helps mitigate volatility in mass-market sales while preserving exposure to growth nodes and resilient tenancy.
Regulatory recalibration continues to influence competitive positions in 2026. Responsible lending rules raise the cost and time to resolve non-performing exposures, which weighs more on smaller developers without internal workout capabilities. New sustainability disclosure expectations for listed companies heighten reporting costs and governance requirements, further encouraging scale and process investment. The REIT framework remains a core enabler for logistics and hospitality sponsors to recycle capital and grow portfolios under professional management. Corporate strategies now converge on a mix of recurring income assets, targeted luxury development, and selective overseas diversification to balance domestic market cyclicality. These combined moves are shaping a Thailand real estate market that is more institutionally oriented and diversified by 2031.
Thailand Real Estate Industry Leaders
-
AP (Thailand) Public Company Limited
-
Sansiri PCL
-
Supalai PCL
-
Land and Houses PCL
-
SC Asset Corporation PCL
- *Disclaimer: Major Players sorted in no particular order

Market Opportunities and Future Outlook
Transaction-unblocking measures and infrastructure-linked corridors create near-term whitespace for developers and investors, particularly where product format can be matched to constrained affordability. In June 2026, the Thai Cabinet approved an extension of reduced transfer and mortgage registration fees (0.01%) for homes priced under THB 7 million through 30 June 2027. This supports volume-driven segments where closing costs influence buyer decisions and extends the window for developers to clear completed inventory while tailoring new launches to price points and unit types that fit tighter bank underwriting, including lower-rise formats near employment nodes and stations.
Commercial and logistics opportunities remain tied to named industrial and connectivity programs rather than broad-based housing recovery. The BOI's 2024 to 2025 approvals for digital infrastructure, including hyperscale data center investments, continue to underpin demand for industrial estates, warehousing, and power-ready land in EEC-linked provinces, reinforcing the pivot by listed developers and REIT sponsors toward built-to-suit logistics and recurring-income assets. On the enabling side, transport megaproject acceleration announced in April 2026 (including the Land Bridge and Thai-Chinese high-speed rail sections) supports land assembly, mixed-use station-area development, and warehouse siting along future freight and passenger corridors. The scheduled 2027 Bangkok Comprehensive City Plan revision also provides a defined catalyst for transit-oriented densification and redevelopment in targeted zones.
Recent Industry Developments
- July 2026: Supalai Public Company Limited signed a THB 2.242 billion sustainability-linked loan with Krungthai Bank to finance specific residential projects, including Supalai Loft Tha Phra Interchange and Supalai Palm Springs Bangna-Srivaree. The structure ties funding to sustainability performance, broadening the use of ESG-linked capital for mainstream housing pipelines and influencing how peer developers frame financing and disclosures.
- November 2025: Thailand's Board of Investment (BOI) approved four data center investments and moved to fast-track licensing for projects that had stalled. The move reinforces the focus on industrial and logistics real estate and underscores the importance of land readiness and grid capacity for occupancy.
- January 2024: The Thai government maintained momentum on the Eastern Economic Corridor positioning through continued investment-promotion activity that prioritized capital-intensive industrial projects and related supply-chain facilities. The policy emphasis supported developers and REIT sponsors expanding warehouse, light industrial, and built-to-suit formats aligned with export manufacturing and e-commerce distribution networks.
Research Methodology Framework and Report Scope
Market Definition and Coverage
For this methodology, the Thailand real estate market is treated as the annual value of completed property transactions and long-term rental deals across residential, commercial, industrial, and land, captured through formal registrations and established brokerage channels.
Scope exclusions: Short-stay lodging turnover and pure construction services revenue are excluded, and projects still under construction are tracked only as leading indicators.
Segmentation Overview
- By Property Type
- Residential
- Apartments & Condominiums
- Villas & Landed Houses
- Commercial
- Office
- Retail
- Logistics
- Others
- Residential
- By End-user
- Individuals / Households
- Corporates & SMEs
- Others
- By Major Cities
- Bangkok
- Phuket
- Pattaya
- Chiang Mai
- Rest of Thailand
Data Sources, Market Sizing, and Validation
Desk Research
Desk research was used to set the factual base for the model, so the numbers are tied back to official market activity and not only to opinions. We typically start with public datasets such as the Bank of Thailand, the National Statistical Office of Thailand, and the Ministry of Interior and Department of Lands releases that reflect registrations and housing indicators.
To keep assumptions realistic, we also refer to sources such as the Board of Investment, Thai government gazettes and policy notes, and open research from universities and peer-reviewed journals that discuss pricing, credit access, and household formation. Company filings, investor presentations, real estate association publications, and reputed business press were then used to time-check major launches, absorption narratives, and city-level momentum. In a few places, paid subscriptions were used only to speed up company financial screening and track news and project announcements, but the sizing logic stays explainable from public signals. The sources listed here are illustrative and not exhaustive, and many other references were used for data collection, cross-checks, and clarification.
Primary Interviews and Surveys
Primary work was carried out through expert interviews and structured surveys with developers, brokers, property managers, lenders, and large buyers, so gaps in public statistics could be closed with practical operating detail. For a country market like Thailand, views were balanced across Bangkok and key provincial demand centers, and then the assumptions were rechecked with people who see both sales and rental flows.
Feedback from these discussions was used to confirm which transaction types should be counted, how pricing tends to move by asset class, and what share of activity is likely captured in formal channels, which then informed the final adjustment ranges.
Distribution of primary research fieldwork respondents
| Company type | Respondent position |
|---|---|
| Top tier: 28% | CXOs: 19% |
| Mid tier: 50% | Functional/Unit leaders: 29% |
| Smaller Players: 22% | Managers: 52% |
Market-Sizing & Forecasting
The core sizing uses a top-down build where transaction value is reconstructed from visible demand and supply signals, followed by filters for what is actually completed and recorded in a given year. Inputs that are commonly applied include registered transfers, new housing completions, mortgage and credit growth, price and rent indices, and city-level supply pipelines for offices and other commercial assets, which together help separate a strong year from a pipeline-heavy year.
The totals are then stress-tested using selective bottom-up approximations, such as sampled price per square meter ranges applied to transacted or leased area, and roll-ups from a monitored set of active developers and brokerage channels. When bottom-up visibility is thinner for certain land or industrial pockets, we use conservative participation factors guided by interview feedback, and the gap is kept explicit in the workbook so it can be revisited.
Forecasting is built using scenario analysis supported by simple trend models, with the forward path anchored on variables that respondents typically agree on, such as interest rate direction, household formation, tourism-driven rental pull in key cities, and the timing of large infrastructure-led development nodes. Assumptions are kept stable year to year unless a clear policy or financing shift is observed, so the model remains repeatable and easy to explain on a client call.
Data Validation & Update Cycle
Validation is done in steps so the market total is not accepted just because the math works. We compare the implied market value against independent signals like credit expansion, price and rent movement, and observed launch and absorption patterns, and then investigate any outliers before the numbers are signed off.
If a segment moves too sharply, the underlying drivers are rechecked, the input series are revisited, and primary respondents may be recontacted to confirm whether it is a real shift or a timing effect. Each report is refreshed annually, and interim updates are triggered when material events occur, such as policy changes affecting ownership, interest rates, or major development delays. Before delivery, a final analyst pass is completed so clients receive the most current view available at that time.
Mordor Intelligence's Thailand Analysis of Real Estate Market Size Versus Other Published Estimates
Published market values for Thailand real estate do not always match because different studies count different transaction types, mix sales with rentals in different ways, and sometimes use different timing for currency conversion and the base year.
Registered transfer values and long-term rental deal flows are the evidence checks that keep Mordor Intelligence tied to completed, formally recorded activity, and that scope choice can move totals when other estimates blend in pipeline value or short-stay revenue.
Benchmark comparison
| Source | Market Size | Gaps in Research Methodology |
|---|---|---|
| Mordor Intelligence | USD 60.78 B (2026) | |
| Industry Publisher A | USD 57.87 B (2025) | Uses a different base year and does not clearly separate completed activity from pipeline-driven value, which can shift the counted total when project starts and handovers do not align. |
| Industry Publisher B | USD 30.21 B (2025) | The value definition appears narrower and the slower growth path suggests more conservative price and demand inputs, which can undercount higher-value commercial, industrial, and land transfers. |
Across the three estimates, the spread is mainly explained by what gets counted as market value, how rentals are treated, and how pricing assumptions are carried forward. By keeping the counting rule linked to observable transaction signals and then cross-checking with a few independent indicators, the final number stays traceable to practical inputs and can be updated consistently year to year.
Key Questions Answered in the Report
What is the Thailand real estate market size and growth outlook through 2031?
The Thailand real estate market size is USD 60.78 billion in 2026 and is projected to reach USD 80.00 billion by 2031 at a 5.65% CAGR, supported by infrastructure, selective foreign demand, and a pivot to logistics and industrial assets.
Which property type and business model are growing fastest in Thailand’s real estate?
Commercial assets are advancing at the fastest 6.22% CAGR, while rentals are the fastest-growing business model at a 6.41% CAGR as leasing gains traction near transit and job hubs.
How is policy shaping buyer activity in the Thailand real estate market?
Fee cuts on transfers and mortgages and LTV relaxations are lifting transactions at the margin, while responsible lending rules require affordability checks and preemptive restructuring, which keeps credit tight for mid-income buyers in 2026.
Where is geographic growth strongest across Thailand?
Bangkok leads by value with 53.1% in 2025, while Phuket is the fastest-growing major city in 2026 to 2031 given sustained foreign demand and infrastructure upgrades.
What is driving logistics and industrial real estate in Thailand?
E-commerce growth, hyperscale data center approvals, and EEC-focused investment are lifting warehouse occupancy and rents, supported by REIT funding and long leases with multinational tenants.
How are developers adjusting strategies in 2026?
Leading developers are tilting toward recurring income from logistics and mixed-use assets, expanding branded residences at the top end, and using REITs and ESG-linked financing to optimize cost of capital and portfolio resilience.