Ambient Intelligence Market Size and Share
Market Overview
| Study Period | 2019 - 2030 |
|---|---|
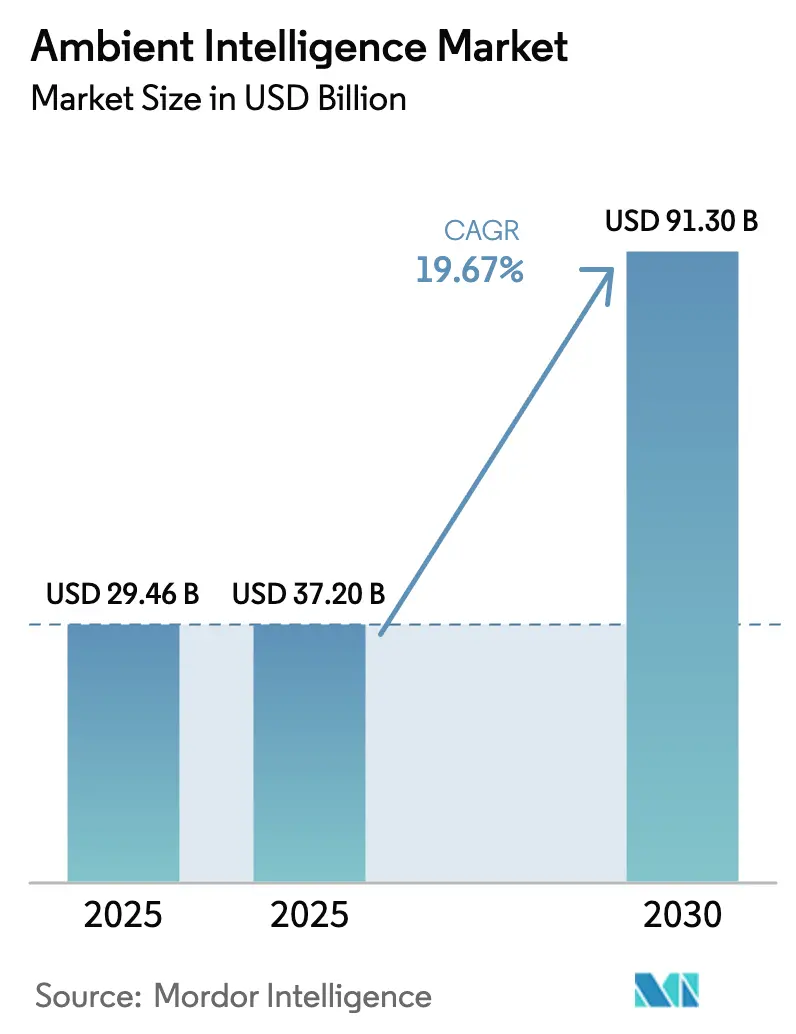
| Market Size (2025) | USD 37.20 Billion |
| Market Size (2030) | USD 91.30 Billion |
| Growth Rate (2025 - 2030) | 19.67% CAGR |
| Fastest Growing Market | Asia-Pacific |
| Largest Market | North America |
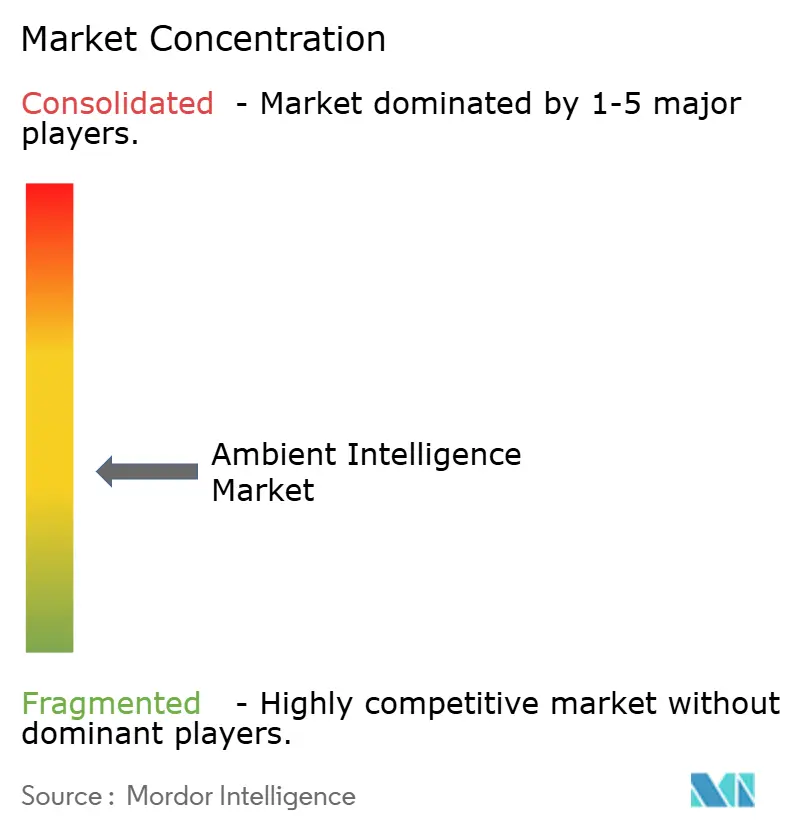
| Market Concentration | Medium |
Major Players *Disclaimer: Major Players sorted in no particular order Image © Mordor Intelligence. Reuse requires attribution under CC BY 4.0. | |
Ambient Intelligence Market Analysis by Mordor Intelligence
The ambient intelligence market size is expected to increase from USD 37.20 billion in 2026 to reach USD 91.30 billion by 2031, growing at a CAGR of 19.67% over 2026-2031. Edge inference chips that consume less than 10 watts, sovereign-AI rules in major economies, and privacy-by-design mandates are accelerating commercial adoption. Hardware vendors are responding with embedded neural-processing units while service providers package predictive-maintenance contracts that stretch beyond initial installations. Smart-city capital programs in China, India, and the Gulf states are lowering deployment risk for private investors, and reimbursement codes for remote patient monitoring in the United States are widening healthcare demand. Competitive pressure is intensifying as consumer-electronics giants port smart-home ecosystems into commercial buildings, forcing industrial-automation incumbents to bundle value-added analytics with their controllers.
Key Report Takeaways
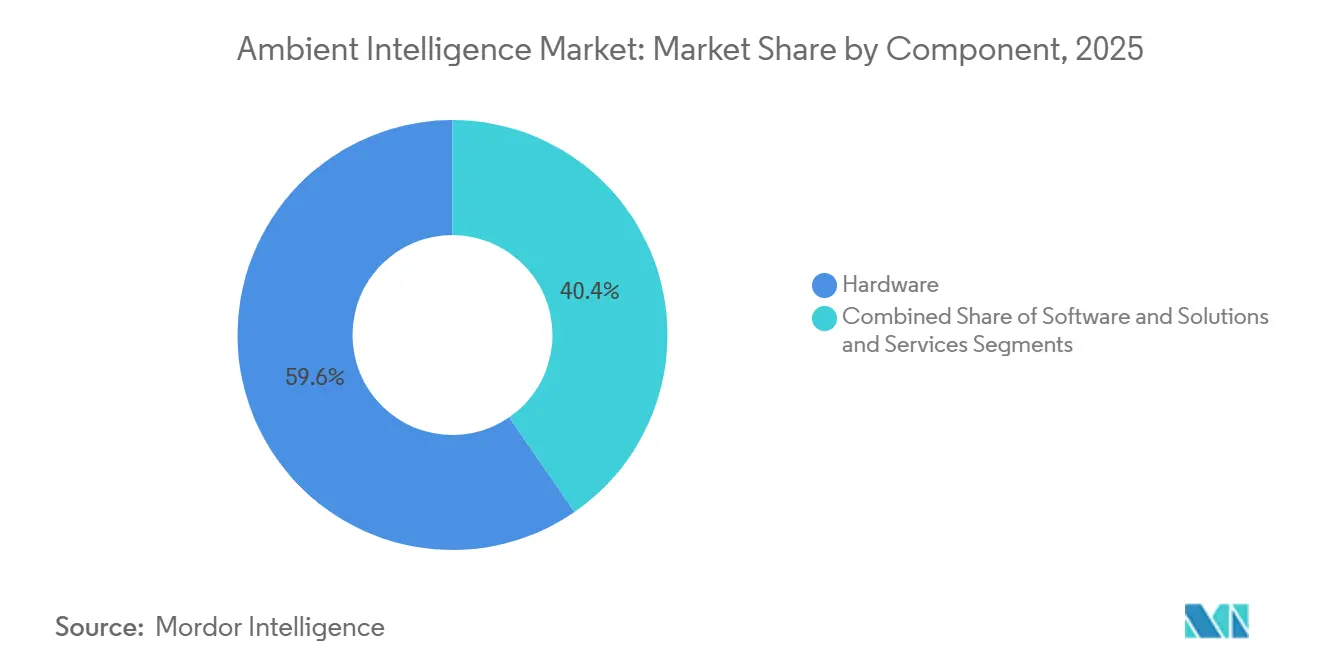
- By component, hardware commanded 59.61% revenue in 2025, while services are advancing at a 20.17% CAGR through 2031.
- By technology, Bluetooth Low Energy led with 24.43% ambient intelligence market share in 2025 and ultra-wideband is projected to expand at 21.72% CAGR to 2031.
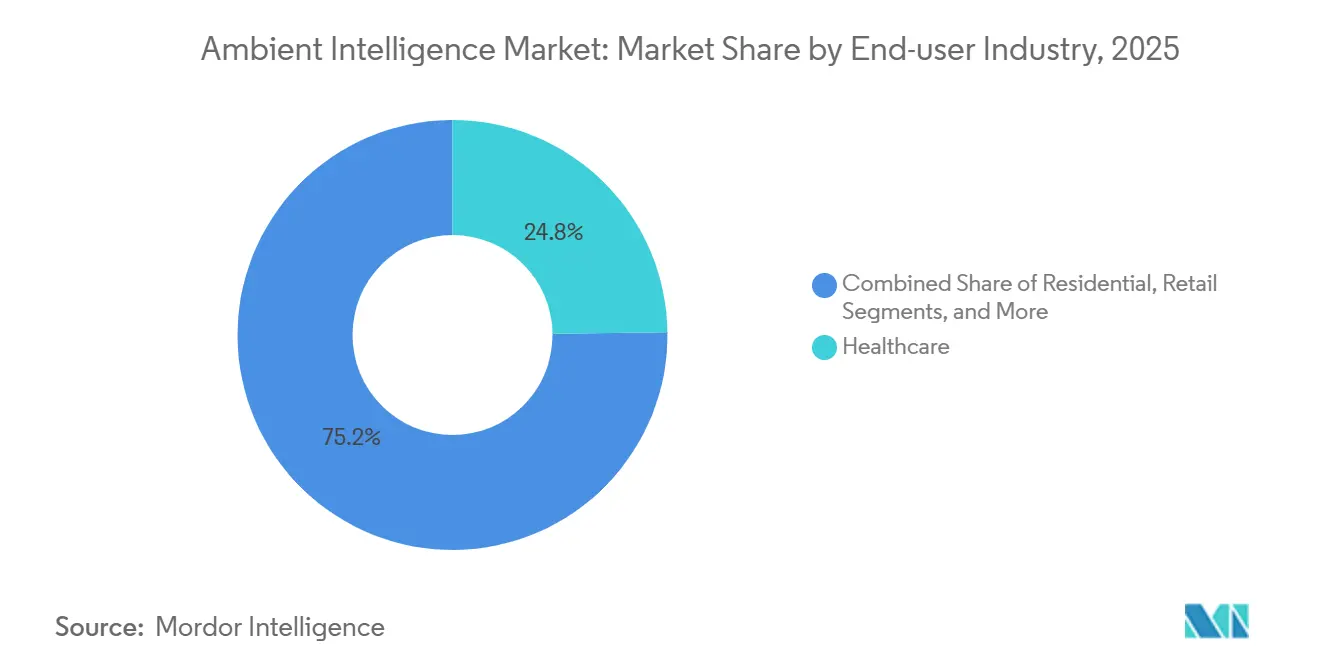
- By end-user industry, healthcare represented 24.79% of the ambient intelligence market size in 2025, whereas automotive is forecast to record the fastest 21.63% CAGR through 2031.
- By application, smart building management captured 27.34% revenue in 2025 and environmental monitoring is poised to grow at 22.01% CAGR toward 2031.
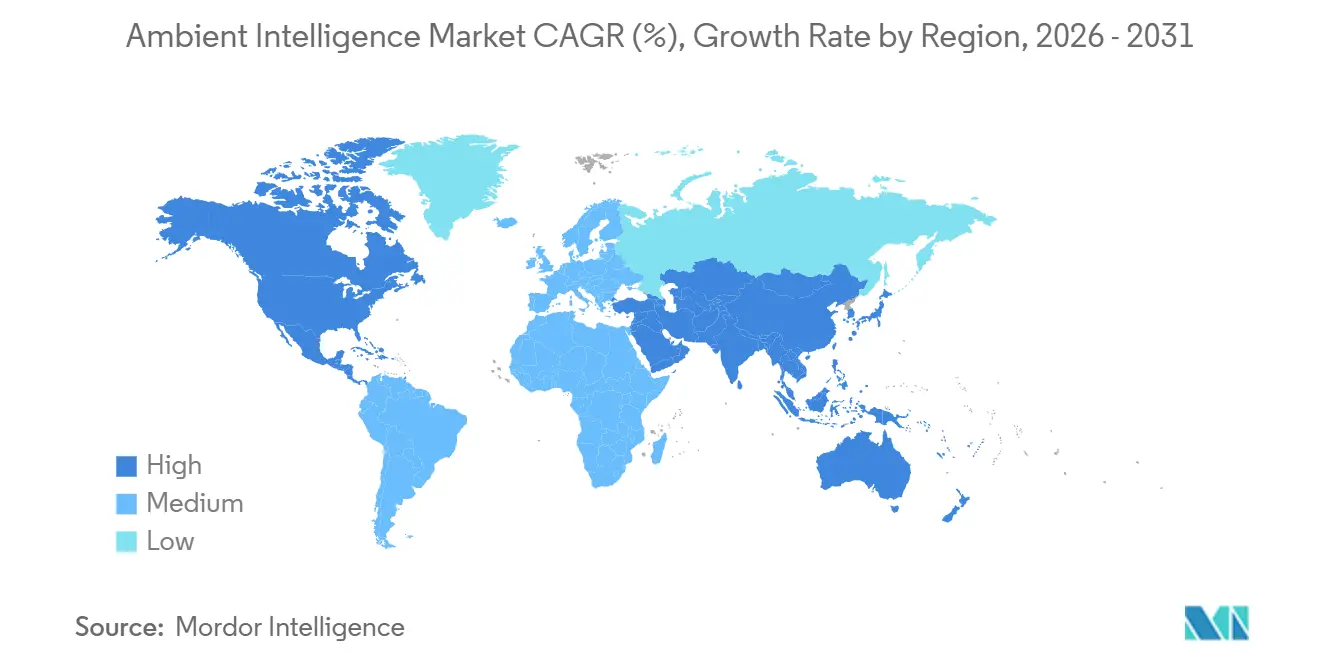
- By geography, North America held 34.84% revenue share of the ambient intelligence market in 2025, while Asia-Pacific is projected to post a 20.44% CAGR from 2026-2031.
Note: Market size and forecast figures in this report are generated using Mordor Intelligence’s proprietary estimation framework, updated with the latest available data and insights as of January 2026.
Global Ambient Intelligence Market Trends and Insights
Drivers Impact Analysis*
| Driver | (~) % Impact on CAGR Forecast | Geographic Relevance | Impact Timeline |
|---|---|---|---|
| Proliferation of AI and IoT Devices | +4.2% | Global, concentrated in North America, Europe, Asia-Pacific | Medium term (2-4 years) |
| Government Smart-City Initiatives | +3.8% | Asia-Pacific core, spillover to Middle East and South America | Medium term (2-4 years) |
| Demand for Energy-Efficient Smart Buildings | +3.1% | North America and Europe, expanding to Asia-Pacific | Long term (≥4 years) |
| Adoption of Ambient-Assisted Living in Healthcare | +2.9% | Europe and North America, early gains in Japan and South Korea | Medium term (2-4 years) |
| Federated Learning Enhancing On-Device Context Awareness | +2.4% | Global, regulatory push in Europe and China | Long term (≥4 years) |
| Integration with Digital Twins for Predictive Facility Management | +2.1% | North America and Europe, pilot projects in Asia-Pacific | Long term (≥4 years) |
| Source: Mordor Intelligence | |||
Proliferation Of AI And IoT Devices
Low-power edge processors are eliminating latency linked to cloud round-trips, which is essential in automotive, industrial, and healthcare settings. Commercial smartphones now integrate ultra-wideband radios that provide centimetric positioning, demonstrating consumer hardware’s readiness for enterprise workloads. Federated-learning rollouts on mobile operating systems have proven that models can improve without exporting raw data, setting precedents for privacy-preserving occupancy sensing in offices. Multi-year battery life achieved through mesh networking and power-efficient inference allows sensor grids to blanket large floorplates with minimal retrofit disruption. Deterministic networking standards are converging with these advances, enabling safety interlocks that must react within milliseconds when environmental thresholds are breached.
Government Smart-City Initiatives
China earmarked CNY 1.2 trillion (USD 168 billion) for more than 900 smart-city pilots that embed traffic, air-quality, and safety analytics, while India’s Smart Cities Mission allocated INR 48,000 crore (USD 5.76 billion) across 100 urban centers.[1]South China Morning Post, “China Smart City Spending Tops USD168 Billion,” scmp.com Saudi Arabia’s USD 500 billion NEOM project, plus grants in Malaysia and smaller Southeast Asian economies, underscores public-sector commitment to digital urban infrastructure.[2]NEOM, “NEOM Project Overview,” neom.com These programs establish common data platforms, demonstrate measurable energy savings, and attract complementary private investments. Vendors that satisfy local content and data-sovereignty clauses gain preferential access, accelerating regional sales pipelines. The resulting reference sites validate interoperability frameworks that smaller municipalities later adopt, expanding the ambient intelligence market.
Demand For Energy-Efficient Smart Buildings
Occupancy-responsive HVAC, adaptive lighting, and predictive maintenance cut commercial-building energy use by up to 40%, yielding rapid paybacks in regions with high electricity tariffs.[3]International Energy Agency, “Smart Buildings Report,” iea.org Digital twins let facility teams test operational changes in silico before implementation, avoiding costly trial-and-error adjustments. Ambient sensor arrays monitor vibration, temperature, and acoustics, flagging mechanical anomalies weeks in advance and reducing revenue-draining downtime. Policymakers view these efficiencies as climate-mitigation tools; the International Energy Agency identified smart-building technologies as a material contributor to decarbonization pathways. Standards such as ISO 50001 increasingly require automated monitoring, cementing demand for sensor-rich environments that deliver verified performance data.
Adoption Of Ambient-Assisted Living In Healthcare
Aging populations are catalyzing demand for unobtrusive fall detection, medication adherence tracking, and caregiver alerts delivered without wearables. Clinical studies showed emergency-room visits dropped 18% after ambient-assisted living deployments, compelling insurers and social services to subsidize installations. National eldercare programs in Singapore and China now mandate or encourage ambient sensors in public housing and long-term-care facilities. Emotional-state analytics, derived from voice and facial micro-expressions, offer continuous insights between clinic visits, improving mental-health interventions. Vendors that combine medical-grade accuracy with privacy-preserving edge analytics are differentiating amid rising health-data scrutiny.
Restraints Impact Analysis*
| Restraint | (~) % Impact on CAGR Forecast | Geographic Relevance | Impact Timeline |
|---|---|---|---|
| Data Security and Privacy Concerns | -2.6% | Global, acute in Europe and North America | Short term (≤2 years) |
| Lack of Interoperability Standards | -1.9% | Global, highest fragmentation in Asia-Pacific and South America | Medium term (2-4 years) |
| High Contextual Bias Risks in AI Decision-Making | -1.4% | North America and Europe, scrutiny intensifying | Medium term (2-4 years) |
| Limited On-Device Power Budget in Legacy Buildings | -1.2% | Europe and North America retrofit markets | Long term (≥4 years) |
| Source: Mordor Intelligence | |||
Data Security And Privacy Concerns
European regulators levied EUR 4.5 billion (USD 5.1 billion) in GDPR fines between 2018 and 2025, with ambient systems facing rising penalties for vague consent flows and excessive retention. The 2024 EU AI Act classifies public-space biometric identification as high risk, forcing lengthy conformity assessments that slow revenue conversion. U.S. healthcare providers confront HIPAA liability when sensors inadvertently capture protected health information. Although federated learning keeps raw data on-device, regulators have yet to clarify whether aggregated model updates count as personal data, creating legal ambiguity. Rising consumer awareness means buyers demand granular opt-in dashboards, raising development costs and elongating sales cycles.
Lack Of Interoperability Standards
Proprietary protocols oblige integrators to juggle custom adapters that inflate project budgets by up to 25%. While IEEE 802.15.4z codified ultra-wideband interoperability, uneven adoption leaves some devices marooned on legacy stacks. Absence of unified APIs forces developers to maintain device-specific code, slowing rollouts and reducing available talent. Traditional building-automation buses such as BACnet struggle with dynamic wireless topologies, hindering automated discovery. Industry alliances are working toward harmonization, yet consensus across competing vendors historically requires several years, delaying seamless plug-and-play ecosystems.
*Our forecasts treat driver/restraint impacts as directional, not additive. The impact forecasts reflect baseline growth, mix effects, and variable interactions.
Segment Analysis
By Component: Services Capture Growth Momentum
Hardware retained 59.61% of 2025 revenue, driven by capital outlays on sensors, gateways, and edge servers that anchor every ambient deployment. The ambient intelligence market size for services is projected to expand at a 20.17% CAGR as end users pivot toward subscription analytics, remote diagnostics, and continuous cybersecurity patching that safeguard mission-critical operations. Cost declines in microelectromechanical sensors and Bluetooth radios, along with volume production of inference accelerators, are compressing hardware margins and nudging manufacturers toward integrated offerings that wrap software and support around their devices.
Services revenue also benefits from the complexity inherent in tuning algorithms to local building physics and occupant behavior. Providers bundle domain expertise, regulatory compliance management, and outcome-based energy guarantees, creating stickier relationships than one-time equipment sales. Mergers between traditional OEMs and analytics startups foreshadow a landscape where differentiation hinges less on silicon and more on actionable insights delivered as a managed service.


By Technology: Ultra-Wideband Extends Precision Frontier
Bluetooth Low Energy accounted for 24.43% technology revenue in 2025, reflecting its ubiquity in smartphones and beacon networks that enable multi-year battery life. Ultra-wideband, however, is on track to post a 21.72% CAGR through 2031 as automotive safety mandates and warehouse-robot localization demand sub-30 centimeter accuracy. The ambient intelligence market size linked to ultra-wideband benefits from IEEE 802.15.4z compliance, which fosters multivendor interoperability in emerging asset-tracking ecosystems.
Legacy RFID maintains relevance in supply-chain applications that tolerate meter-level precision, while sensor-fusion stacks integrate motion, temperature, and gas detectors to enrich contextual awareness. Edge software agents dynamically balance bandwidth and power budgets among devices, optimizing network resilience as node counts surge into the thousands. Nanotechnology-enabled sensors embedded in concrete or structural steel open new inspection workflows, while affective-computing modules surface real-time sentiment analytics in retail and healthcare environments.
By End-User Industry: Automotive Accelerates On Safety Rules
Healthcare generated 24.79% of 2025 spending as hospitals, clinics, and eldercare facilities installed fall-detection grids and environmental monitors that reduce adverse events and staffing strain. Automotive is predicted to log the fastest 21.63% CAGR to 2031 because Euro NCAP now requires driver-monitoring cameras and pressure-sensor mats that detect distraction and drowsiness. The ambient intelligence market share associated with automotive will therefore rise as insurers reward advanced driver-assistance packages and consumers expect cabin personalization anchored on biometrics.
Industrial plants deploy ambient networks to measure asset utilization, predict failures, and balance energy loads, achieving sub-18-month payback windows. Office landlords armed with occupancy analytics reassign underused space, moderate ventilation rates, and improve employee comfort, directly linking sensor data to lease retention. Retailers overlay heat maps with real-time promotions, while educational institutions track attendance and air quality to safeguard student well-being. Hospitality chains apply ultra-wideband beacons to streamline wayfinding and deliver personalized room settings upon guest arrival.
By Application: Environmental Monitoring Gains Traction
Smart building management commanded 27.34% revenue in 2025, integrating HVAC, lighting, and access control into unified dashboards that automate energy savings and safety compliance. Environmental monitoring, forecast to outpace at 22.01% CAGR, is propelled by municipal air-quality mandates, industrial emissions caps, and heightened public awareness of particulate pollution’s health impacts. The ambient intelligence market size tied to environmental monitoring grows as cities deploy low-cost sensors across lampposts and transit corridors, feeding open-data portals that inform policy and citizen behavior.
Ambient-assisted living remains a major application, leveraging unobtrusive sensors to extend independent living for seniors and reduce readmissions. Smart retail analytics combine dwell-time metrics with demographic insights to refine merchandising strategies, while industrial IoT overlays predictive maintenance and scrap-rate reduction on legacy production lines. Smart mobility projects integrate parking occupancy, dynamic tolling, and real-time transit crowding to alleviate congestion. Public safety systems incorporate gunshot localization and perimeter intrusion detection, and energy-management schemes expand beyond single buildings to campus microgrids that optimize renewable loads.
Geography Analysis
North America held 34.84% of global revenue in 2025, supported by early smart-building retrofits, federal grants, and healthcare reimbursement codes that underwrite remote patient monitoring. U.S. municipalities leveraged USD 160 million in Smart Cities and Communities funding to pilot ambient applications that showcase carbon and operational savings. Canadian investments in privacy-preserving edge analytics align with national AI-ethics strategies, while Mexico’s manufacturing clusters adopt industrial IoT to lift productivity and shore up near-shoring competitiveness. A robust cadre of system integrators distinguishes the region, shortening deployment timelines and fostering multiyear service contracts.
Asia-Pacific is projected to post a 20.44% CAGR through 2031 as China’s 900-plus smart-city pilots, India’s INR 48,000 crore allocation, and South Korea’s USD 2.1 billion smart-city fund create fertile ground for large-scale sensor rollouts. Japan’s Society 5.0 agenda embeds ambient intelligence across urban planning and disaster response, demonstrating integrated human-centric design. Australia and New Zealand concentrate on net-zero building retrofits, using occupancy analytics to meet aggressive carbon targets. Technical-standard fragmentation and data-localization statutes complicate cross-border harmonization, yet government capital outlays and rapid urbanization sustain momentum.
Europe’s growth is anchored by stringent privacy and energy directives that favor on-device processing. Germany, France, the United Kingdom, Italy, and Spain capture the bulk of regional expenditure as corporate real-estate owners upgrade to comply with increasingly rigorous building-energy codes. The Middle East’s greenfield megaprojects, led by Saudi Arabia’s USD 500 billion NEOM and the United Arab Emirates’ Smart City 2030 blueprint, integrate ambient platforms from inception, setting benchmarks for seamless occupant experiences. Africa and South America are emerging opportunity zones where mobile-first populations leapfrog fixed infrastructure, deploying battery-powered sensor networks that deliver foundational security and environmental functions despite constrained municipal budgets.

Competitive Landscape
The ambient intelligence market remains moderately fragmented; the top five companies accounted for roughly 28% combined revenue in 2025. Industrial-automation stalwarts such as Schneider Electric, Siemens, and Honeywell are defending territory against consumer-electronics entrants like Amazon, Google, and Apple that leverage existing smart-home ecosystems to penetrate commercial buildings. Strategic responses vary: some incumbents pursue vertical integration, marrying hardware with proprietary software and managed services, while challengers focus on horizontal niches such as ultra-wideband positioning or affective-computing algorithms.
Technology roadmaps increasingly revolve around compressing larger neural networks into sub-10-watt edge chipsets, which allow continuous inference without active cooling or wired power feeds. Patent filings in federated learning and differential privacy grew 34% year-on-year in 2025, reflecting the premium placed on privacy-preserving analytics. Partnerships also shape the landscape; Siemens and Microsoft expanded their alliance in 2026 to embed natural-language generative AI into digital-twin dashboards, shortening troubleshooting cycles for facility managers. Meanwhile, emerging players secure footholds by targeting retrofit markets with energy-harvesting sensors that solve wiring constraints in legacy structures.
Compliance is a purchase-order gatekeeper, with buyers requiring adherence to ISO 27001 for information security and IEEE 802.15.4z for ultra-wideband interoperability. Vendors unable to certify quickly face elongated sales cycles or outright disqualification. Geographic data-sovereignty clauses further complicate portfolios, nudging multinationals to deploy region-specific clouds or on-premise gateways that keep personally identifiable information within national borders.
Ambient Intelligence Industry Leaders
Schneider Electric SE
Siemens AG
Honeywell International Inc.
ABB Ltd.
Amazon.com Inc.
- *Disclaimer: Major Players sorted in no particular order

Recent Industry Developments
- February 2026: Schneider Electric unveiled the EcoStruxure Ambient Intelligence Suite, integrating digital twins and federated learning to cut building-energy use by up to 30% in European and Chinese pilots.
- January 2026: Siemens and Microsoft launched a generative-AI module for Siemens Xcelerator, enabling natural-language queries that trimmed anomaly-diagnosis time by 25% in early trials.
- December 2025: Honeywell committed USD 150 million to a new ambient-intelligence sensor plant in Bangalore, India, with production slated for 2Q 2027.
- November 2025: Apple added the U2 ultra-wideband chip to iPhone 16, enabling centimetric indoor positioning that underpins enterprise asset tracking.


Research Methodology Framework and Report Scope
Market Definitions and Key Coverage
Our study defines the ambient intelligence market as all hardware, embedded software, and AI-driven platforms that together let a built environment sense people, interpret context, and then adjust lighting, temperature, information flows, or safety functions automatically across homes, workplaces, vehicles, and public spaces (mordorintelligence.com).
Standalone wearables that never interact with surrounding infrastructure and single-purpose industrial PLCs lacking context-aware logic remain outside scope.
Segmentation Overview
- By Component
- Hardware
- Software and Solutions
- Services
- By Technology
- Bluetooth Low Energy
- RFID
- Sensors
- Software Agents
- Affective Computing
- Nanotechnology
- Biometrics
- Ultra-Wideband
- Other Technologies
- By End-user Industry
- Residential
- Retail
- Healthcare
- Industrial
- Office Building
- Automotive
- Automotive
- Education
- Other End-user Industries
- By Application
- Smart Building Management
- Ambient-Assisted Living
- Smart Home Automation
- Smart Retail Analytics
- Smart Manufacturing and Industrial IoT
- Smart Mobility and Transportation
- Public Safety and Security
- Energy Management
- Environmental Monitoring
- Other Applications
- By Geography
- North America
- United States
- Canada
- Mexico
- South America
- Brazil
- Argentina
- Rest of South America
- Europe
- Germany
- United Kingdom
- France
- Italy
- Spain
- Rest of Europe
- Asia-Pacific
- China
- India
- Japan
- South Korea
- Australia and New Zealand
- Rest of Asia-Pacific
- Middle East
- Saudi Arabia
- United Arab Emirates
- Turkey
- Rest of Middle East
- Africa
- South Africa
- Nigeria
- Egypt
- Rest of Africa
- North America
Detailed Research Methodology and Data Validation
Desk Research
First, we mapped demand fundamentals with open datasets from the US Census Bureau, Eurostat smart-home panels, OECD IoT indicators, the International Energy Agency appliance stock files, and WHO aging-population tables. Company 10-Ks, trade-association briefs, and patent trends gathered through Dow Jones Factiva and Questel revealed pricing shifts and innovation pipelines.
A second pass pulled customs records, regional energy codes, and sensor shipment tallies; this mix, while varied, is illustrative only. Many further publications helped us challenge and refine every data point.
Primary Research
Analysts then held structured calls with sensor makers, smart-building integrators, healthcare CIOs, automotive HMI engineers, and regulators across North America, Europe, and Asia-Pacific. Their insights validated adoption rates, realistic average selling prices, and regulatory inflection points that secondary sources seldom quantify.
Market-Sizing & Forecasting
We begin with a top-down construct that scales connected-device penetration, smart-building floor area, automotive production runs, and hospital bed counts to estimate potential demand. This is followed by selective bottom-up checks from supplier revenues and distributor inventory snapshots. Key variables like sensor ASP drift, edge-AI chipset output, residential renovation rates, and regional GDP outlook feed a multivariate regression that extends the model to 2030. Where supplier splits are opaque, scenario ranges built with interview feedback bridge gaps before totals are frozen.
Data Validation & Update Cycle
Outputs undergo variance checks against historic sales curves, foreign-trade flows, and peer numbers; anomalies trigger re-contact with sources before senior analyst sign-off. Models refresh each year, with interim updates after material events such as sharp component-price moves or policy shifts.
Why Our Ambient Intelligence Baseline Commands Reliability
Published estimates diverge because firms select different functional boundaries, price decks, and update cadences.
Some place ambient intelligence narrowly around smart homes; others roll in enterprise SaaS fees. Totals therefore vary from USD 29 billion to USD 36 billion for 2024-2025.
Benchmark comparison
| Market Size | Anonymized source | Primary gap driver |
|---|---|---|
| USD 37.20 B (2025) | Mordor Intelligence | - |
| USD 36.29 B (2025) | Global Consultancy A | Bundles managed-service fees and hybrid-cloud charges |
| USD 29.21 B (2024) | Regional Consultancy B | Omits automotive cabin systems; uses fixed 2020 FX |
| USD 18.44 B (2022) | Trade Journal C | Older base year; assumes limited sensor price erosion |
Together, these comparisons show that Mordor's disciplined scope setting, quarterly variable refresh, and transparent step-wise model provide decision-makers a balanced, reproducible baseline they can trust.


Key Questions Answered in the Report
How fast is spending on ambient intelligence projected to grow through 2031?
The ambient intelligence market is forecast to expand from USD 37.20 billion in 2026 to USD 91.30 billion by 2031, delivering a 19.67% CAGR over the five-year horizon.
Which segment is set to outpace overall market growth?
Services, including analytics subscriptions and integration support, are poised to grow at a 20.17% CAGR as building owners favor recurring outcome-based contracts.
Why is ultra-wideband drawing heightened interest from enterprises?
Automotive safety mandates and warehouse-robot navigation demand centimetric indoor positioning, propelling ultra-wideband revenue at a projected 21.72% CAGR.
What drives Asia-Pacific’s leadership in future deployments?
Large-scale government smart-city investments in China and India, combined with national funds in Japan and South Korea, underpin Asia-Pacific’s forecast 20.44% CAGR through 2031.
How do privacy regulations affect ambient intelligence rollouts?
Regulations such as GDPR and the EU AI Act impose stringent consent and audit requirements, adding as much as 18 months to deployment timelines and elevating interest in on-device processing.
What level of vendor fragmentation characterizes the field?
The top five providers hold about 28% revenue, giving the ambient intelligence market a concentration score of 4, so buyers may still source solutions from a wide array of specialized suppliers.
Page last updated on:


