Allyl Chloride Market Size and Share
Market Overview
| Study Period | 2021 - 2031 |
|---|---|
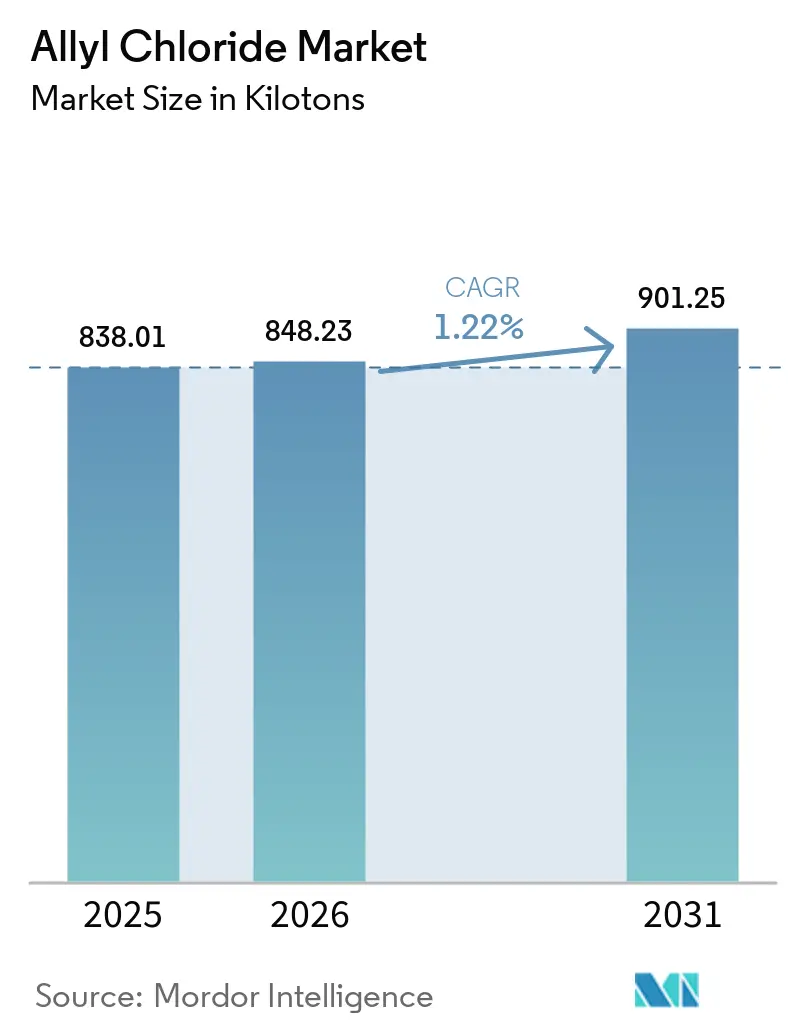
| Market Volume (2026) | 848.23 kilotons |
| Market Volume (2031) | 901.25 kilotons |
| Growth Rate (2026 - 2031) | 1.22% CAGR |
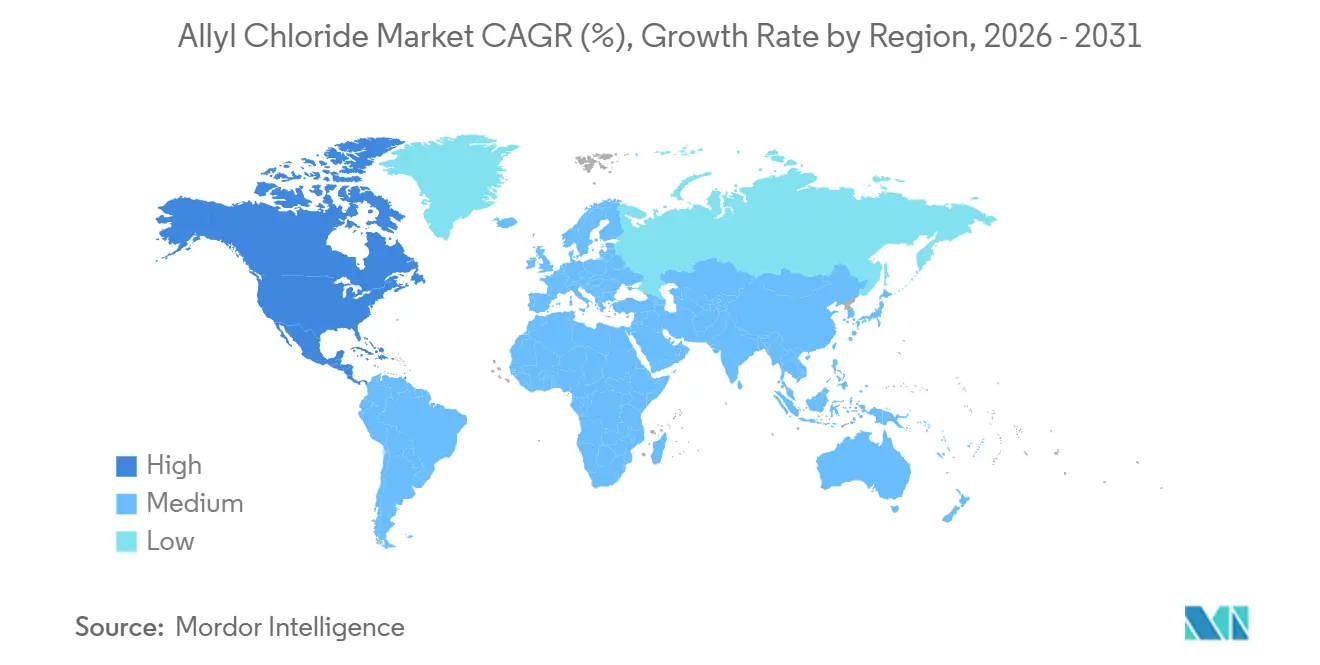
| Fastest Growing Market | North America |
| Largest Market | Asia Pacific |
| Market Concentration | Medium |
Major Players *Disclaimer: Major Players sorted in no particular order Image © Mordor Intelligence. Reuse requires attribution under CC BY 4.0. | |
Allyl Chloride Market Analysis by Mordor Intelligence
The Allyl Chloride Market size was valued at 838.01 kilotons in 2025 and is estimated to grow from 848.23 kilotons in 2026 to reach 901.25 kilotons by 2031, at a CAGR of 1.22% during the forecast period (2026-2031). The allyl chloride market remains centered on epichlorohydrin production, though advancements in processes and regional feedstock benefits are gradually reducing this reliance. Growth is supported by increasing epoxy resin applications in wind turbine blades and electric vehicle composites, renewed infrastructure investments in North America, and stricter wastewater regulations in Europe and the United States. Additionally, bio-epichlorohydrin capacity now accounts for over one-sixth of global supply, compelling producers to weigh the economics of propylene against glycerol-based alternatives. The adoption of digital-twin automation is reducing unplanned downtime and improving yields, partially mitigating the impact of fluctuating propylene and electricity costs. Meanwhile, stricter occupational exposure limits in both Europe and the United States are driving up compliance costs but also fostering demand for higher-purity products that command premium prices.
Key Report Takeaways
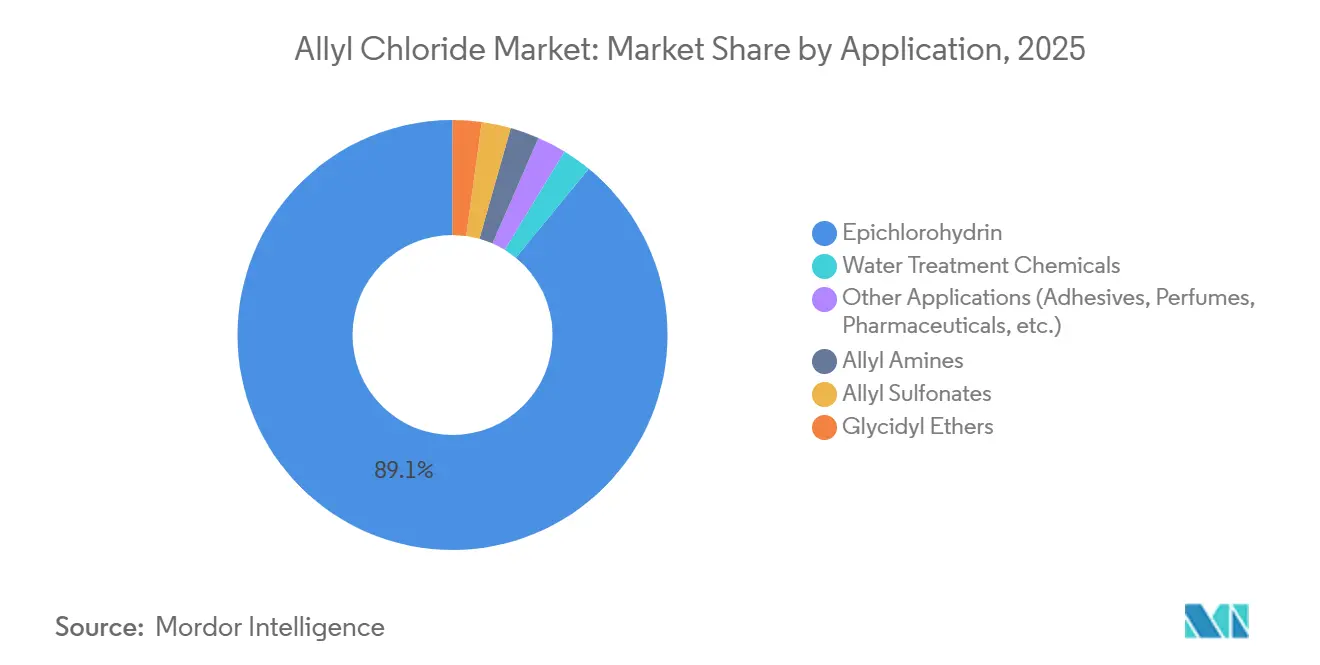
- By application, epichlorohydrin retained 89.08% of the allyl chloride market share in 2025, while water-treatment chemicals recorded the fastest 3.59% CAGR through 2031.
- By geography, Asia-Pacific led with 52.32% of the allyl chloride market share in 2025, while North America is projected to post the highest 1.36% CAGR through 2031.
Note: Market size and forecast figures in this report are generated using Mordor Intelligence’s proprietary estimation framework, updated with the latest available data and insights as of January 2026.
Global Allyl Chloride Market Trends and Insights
Drivers Impact Analysis*
| Driver | (~) % Impact on CAGR Forecast | Geographic Relevance | Impact Timeline |
|---|---|---|---|
| Surging epoxy-resin demand in wind-turbine blades and electric-vehicle composites | +0.3% | Global, with concentration in Asia-Pacific, Europe, and North America | Medium term (2-4 years) |
| Expansion of industrial water-treatment regulations worldwide | +0.2% | Europe and North America core, spillover to Asia-Pacific | Long term (≥4 years) |
| Pharma and agrochemical pipeline requiring high-purity allyl intermediates | +0.15% | Global, with R&D hubs in North America, Europe, and India | Medium term (2-4 years) |
| Digital-twin automation boosting plant uptime and capacity utilization | +0.1% | Global, early adopters in Asia-Pacific and North America | Short term (≤2 years) |
| On-purpose chlorination revamps enabling small-scale, low-CAPEX plants | +0.05% | Regional markets in South America, Middle-East, and emerging Asia-Pacific | Long term (≥4 years) |
| Source: Mordor Intelligence | |||


Surging Epoxy-Resin Demand in Wind-Turbine Blades and Electric-Vehicle Composites
Global wind installations utilized more than 120,000 metric tons of epoxy resin in 2024, with each gigawatt of added capacity requiring approximately 1,700 metric tons of resin, directly driving epichlorohydrin demand. Composite components in battery-electric vehicles increased by 15% year-on-year in 2024, shifting the allyl chloride market toward higher-value resin grades. China added 70 GW of wind power in 2024, Europe contributed 18 GW, and the United States added 12 GW, forming a growth engine across three continents. Epoxy formulators are increasingly focusing on traceable supply chains, leading allyl-chloride producers to tighten batch certification processes. Battery-electric vehicle production is expected to reach 25 million units by 2026[1]International Energy Agency, “Global EV Outlook 2025,” iea.org, maintaining demand for high-purity epichlorohydrin even as bio-based production methods gain traction.
Expansion of Industrial Water-Treatment Regulations Worldwide
The European Union’s revised Urban Wastewater Treatment Directive, finalized in 2024, requires quaternary treatment for large agglomerations by 2045 and mandates pharmaceutical and cosmetic companies to cover 80% of micropollutant removal costs, unlocking EUR 3.6 billion for new treatment facilities. Monitoring of per- and polyfluoroalkyl substances became mandatory in 2026, boosting demand for quaternary-ammonium compounds derived from allyl chloride. In the United States, proposed maximum contaminant levels for these substances include compliance deadlines in 2029, prompting utilities to adopt ion-exchange resins that rely on allyl precursors. Japan tightened discharge limits on 1,4-dioxane in 2024, while India extended zero-liquid-discharge rules for textile hubs, increasing specialty-coagulant volumes. These regulatory developments keep the allyl chloride market aligned with infrastructure investments rather than cyclical commodity fluctuations.
Pharma and Agrochemical Pipeline Requiring High-Purity Allyl Intermediates
Allylamine intermediates' growth is driven by antifungal actives, such as terbinafine, which require residual chloride levels below 50 ppm. Herbicide production also depends on high-purity allyl chloride for pre-emergent formulations as glyphosate resistance continues to spread. Europe’s ICH Q3D guideline on elemental impurities has necessitated new ion-chromatography lines, increasing investment but supporting price premiums. India exported USD 25 billion worth of pharmaceuticals in 2024 and expanded captive allyl-chloride production in 2025, emphasizing vertical integration trends. Patent filings for allyl-substituted drug candidates rose by 12% in 2024, indicating steady long-term demand.
Digital-Twin Automation Boosting Plant Uptime and Capacity Utilization
Tata Chemicals reported annual savings of USD 600,000 and a 25% reduction in downtime after implementing digital twins, showcasing how real-time analytics enhance yields and reduce costs. Allyl-chloride reactors, which are exothermic and highly sensitive to fouling, now benefit from predictive maintenance that identifies heat-transfer decay days in advance, keeping on-stream factors above 95%. Honeywell Forge, implemented at Olin’s Louisiana network, reduced off-spec batches by 22%, resulting in USD 1.8 million in raw-material savings. Emerson’s DeltaV system at INEOS’s Runcorn complex synchronized upstream chlorination with epichlorohydrin purification, increasing effective capacity by 8% without requiring additional hardware. Typical payback periods are under two years, driving adoption among mid-tier producers in Asia and Latin America.
Restraints Impact Analysis*
| Restraint | (~) % Impact on CAGR Forecast | Geographic Relevance | Impact Timeline |
|---|---|---|---|
| Stringent occupational-exposure and emission limits (US/EU/JP) | -0.2% | North America, Europe, and Japan | Short term (≤2 years) |
| Volatile propylene and electricity prices squeezing margins | -0.15% | Global, with acute pressure in Europe and Asia-Pacific | Short term (≤2 years) |
| Bio-ECH scale-up eroding allyl-chloride demand share | -0.25% | Global, led by Europe and North America | Medium term (2-4 years) |
| Source: Mordor Intelligence | |||
Stringent Occupational-Exposure and Emission Limits (US/EU/JP)
The US Occupational Safety and Health Administration enforces an 8-hour limit of 1 ppm, requiring closed-loop transfer systems that can add approximately USD 10 million to the costs of a mid-size unit[2]Occupational Safety and Health Administration, “CFR 1910.1000 Air Contaminants,” osha.gov. Europe’s REACH framework enforces the same 1 ppm worker limit and a stricter 0.1 ppm limit for public exposure, necessitating vapor-recovery units that increase greenfield project costs by about 20%. Japan’s Ministry of Economy, Trade and Industry applies similar exposure limits and mandates annual health checks, which can add up to USD 700,000 annually to operating expenses. Revised EU Industrial Emissions rules in 2024 now cap reactor VOC emissions at 5 mg/m³, prompting investments in thermal oxidizers. Non-compliance has already resulted in temporary shutdowns of approximately 12 kilotons per year in Jiangsu and Gujarat, highlighting enforcement risks.
Volatile Propylene and Electricity Prices Squeezing Margins
Propylene prices rose from USD 750 per ton in early 2024 to USD 950 per ton by December and are forecast to reach around USD 1,050 per ton by 2026, increasing allyl-chloride feedstock costs by USD 170per ton for non-integrated producers. European electricity prices averaged EUR 150 per MWh in 2024, 40% higher than pre-pandemic levels, with a slight decline expected in 2025. In contrast, U.S. Gulf Coast producers benefited from lower energy costs, with Henry Hub natural gas averaging USD 2.50 per MMBtu. Currency fluctuations added further uncertainty, as a 6% euro depreciation increased Asian import costs. These factors collectively reduced gross margins for standalone plants from 22% to approximately 16%.
*Our forecasts treat driver/restraint impacts as directional, not additive. The impact forecasts reflect baseline growth, mix effects, and variable interactions.
Segment Analysis
By Application: Epichlorohydrin Dominance Masks Specialty Growth
Epichlorohydrin captured 89.08% of the 2025 volume. Wind energy, electric vehicles, and electronics consumed the bulk of these volumes even as bio-alternatives began to gain traction. Yet the fastest expansion lay elsewhere: water-treatment chemicals advanced at a 3.59% CAGR through 2031 as utilities complied with stricter micropollutant rules. Pharma-focused allyl amines benefited from the demand for generic antifungal products. Glycidyl ethers and allyl sulfonates with higher pricing remained attractive for plants that could switch between commodity and specialty batches.
Producers reconfigured scheduling so that specialty campaigns followed large epichlorohydrin runs, maximizing uptime without major capital additions. Digital-twin systems allowed a 36-hour changeover to pharmaceutical-grade allyl chloride that met sub-50 ppm chloride limits. This flexibility raised the allyl chloride market share of high-purity output during periods of propylene price spikes, cushioning margins. As bio-epichlorohydrin gained a footprint, the balanced portfolio approach became more critical for asset sustainability.


Geography Analysis
Asia-Pacific anchored 52.32% of global volume in 2025, with the region’s allyl chloride market size buffered by large wind and electronics sectors, yet substitution pressure rose as imported bio-ECH made inroads. India expanded Gujarat output by 12 kilotons per year in 2025 to back water-borne coatings, and Japan’s pharmaceutical-grade exports remained dominant thanks to tight quality systems. South Korea leveraged its propylene surplus to feed Southeast Asian customers.
North America posted the quickest 1.36% CAGR through 2031, reflecting ample shale-based propylene and integrated chlorine capacity on the U.S. Gulf Coast. Rapid wind-farm additions in the Midwest and offshore Atlantic kept epichlorohydrin flows healthy, while Dow’s new Alberta bio unit gave buyers the option to lower embodied carbon. Mexico gained from near-shoring dynamics that redirected plastics manufacturing from East Asia into North America.
In Europe, strict emission limits raised operating costs, favoring integrated majors with scale. Germany stayed the largest consumer, but a shift toward certified bio-materials trimmed conventional demand by roughly 3% annually. Eastern Europe, led by Poland and Czechia on infrastructure upgrades that raised resin needs, partially offset Western European contraction.

Competitive Landscape
The Allyl chloride market showed moderate concentration: OSAKA SODA, INEOS, Olin, Sumitomo Chemical, and Solvay together held roughly 68% of global capacity in 2025. Integrated models dominated profitability because captive chlorine and propylene streams shielded participants from raw-material swings. Dow’s Gulf Coast system, for instance, balanced vinyls, epoxy, and caustic chains to sustain margins through feed volatility. INEOS exploited its European chlor-alkali grid to secure low-cost chlorine and sell caustic soda into aluminum and pulp uses.
High-purity niches created room for smaller, agile contenders. Kashima Chemical and Osaka Soda maintained Good Manufacturing Practice certifications that enabled 60% price premiums on pharmaceutical grade, while Vizag Chemical in India locked in regional offtake through customer proximity. Chinese players like Befar Group deployed modular on-purpose chlorination that toggled feedstocks in under two days. Digital-twin rollouts by Olin and Sumitomo proved that analytics could narrow cost gaps even for plants below world-scale.
Continuous patenting underscored competitive intensity: Dow filed a hybrid bio-ECH–allyl chloride process in 2024 to preserve utilization across feed regimes, and several Asian firms patented low-temperature catalysts aimed at energy savings. Compliance with ISO 9001 and 14001 became standard, but differentiation now rested on traceable carbon metrics and flexible operating envelopes.
Allyl Chloride Industry Leaders
OSAKA SODA
INEOS
Olin Corporation
Sumitomo Chemical Co., Ltd.
Solvay
- *Disclaimer: Major Players sorted in no particular order

Recent Industry Developments
- January 2026: Xinxian Huaxiang suspended its allyl chloride quotations. This indicated potential ongoing supply disruptions or market volatility for the chemical.
- December 2025: WEGO CHEMICAL GROUP started supply of high-quality Allyl Chloride (CAS 107-05-1), also referred to as 3-Chloropropene. It is used as a key intermediate in the production of epichlorohydrin, resins, and various functional materials.


Global Allyl Chloride Market Report Scope
Allyl chloride is an organochlorine compound. It is mainly converted to epichlorohydrin, used in the production of plastics.
The allyl chloride market is segmented by application and geography. By application, the market is segmented into epichlorohydrin, allyl amines, allyl sulfonates, glycidyl ethers, water treatment chemicals, and other applications (adhesives, perfumes, pharmaceuticals, etc.). The report also covers the market size and forecasts for allyl chloride in 15 countries across major regions. For each segment, the market sizing and forecasts have been done on the basis of volume (tons).
| Epichlorohydrin |
| Allyl Amines |
| Allyl Sulfonates |
| Glycidyl Ethers |
| Water Treatment Chemicals |
| Other Applications (Adhesives, Perfumes, Pharmaceuticals, etc.) |
| Asia-Pacific | China |
| India | |
| Japan | |
| South Korea | |
| Rest of Asia-Pacific | |
| North America | United States |
| Canada | |
| Mexico | |
| Europe | Germany |
| United Kingdom | |
| France | |
| Italy | |
| Rest of Europe | |
| South America | Brazil |
| Argentina | |
| Rest of South America | |
| Middle-East and Africa | Saudi Arabia |
| South Africa | |
| Rest of Middle-East and Africa |
| By Application | Epichlorohydrin | |
| Allyl Amines | ||
| Allyl Sulfonates | ||
| Glycidyl Ethers | ||
| Water Treatment Chemicals | ||
| Other Applications (Adhesives, Perfumes, Pharmaceuticals, etc.) | ||
| By Geography | Asia-Pacific | China |
| India | ||
| Japan | ||
| South Korea | ||
| Rest of Asia-Pacific | ||
| North America | United States | |
| Canada | ||
| Mexico | ||
| Europe | Germany | |
| United Kingdom | ||
| France | ||
| Italy | ||
| Rest of Europe | ||
| South America | Brazil | |
| Argentina | ||
| Rest of South America | ||
| Middle-East and Africa | Saudi Arabia | |
| South Africa | ||
| Rest of Middle-East and Africa | ||


Key Questions Answered in the Report
What is the volume of the allyl chloride market?
The allyl chloride market stands at 848.23 kilotons in 2026 and is forecast to reach 901.25 kilotons by 2031, reflecting a 1.22% CAGR from 2026.
Which region is expanding fastest for allyl chloride through 2031?
North America leads growth with a projected 1.36% CAGR through 2031, aided by low-cost shale propylene and rising wind-energy installations.
Why are digital twins important for allyl chloride plants?
Predictive analytics cut downtime, improve yields, and offset feedstock volatility, delivering payback in under two years for many facilities.
Which application is growing fastest through 2031?
Water-treatment chemicals show the highest growth at 3.59% through 2031, driven by stricter EU and U.S. rules on micropollutants.
Page last updated on:


