
Algae Products Market Size and Share
Market Overview
| Study Period | 2021 - 2031 |
|---|---|
| Market Size (2026) | USD 4.13 Billion |
| Market Size (2031) | USD 5.84 Billion |
| Growth Rate (2026 - 2031) | 7.17 % |
| Fastest Growing Market | Asia Pacific |
| Largest Market | North America |
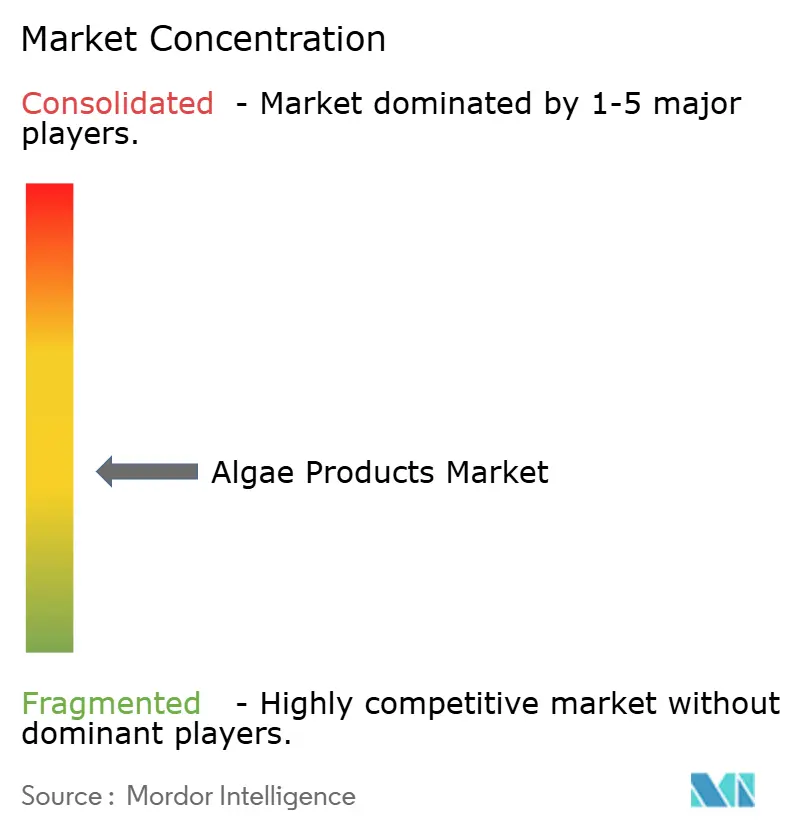
| Market Concentration | Medium |
Major Players *Disclaimer: Major Players sorted in no particular order Image © Mordor Intelligence. Reuse requires attribution under CC BY 4.0. | |
Algae Products Market Analysis by Mordor Intelligence
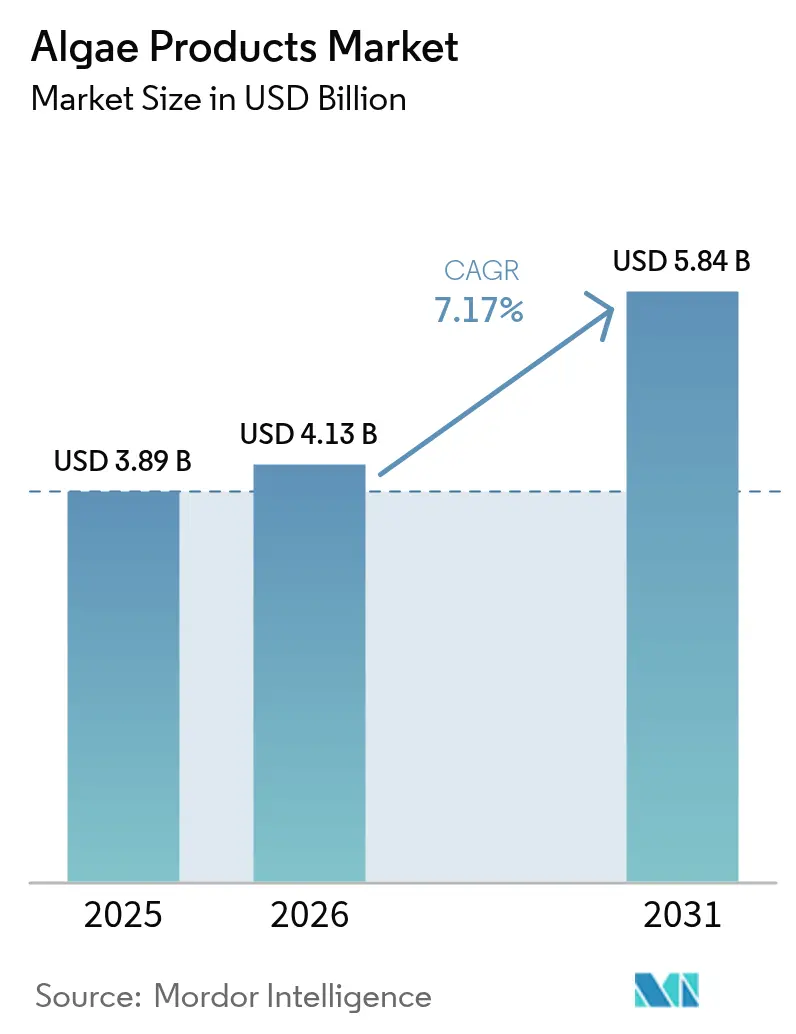
The algae products market size is projected to expand from USD 3.89 billion in 2025 and USD 4.13 billion in 2026 to USD 5.84 billion by 2031, registering a CAGR of 7.17% between 2026 to 2031. Food companies, cosmetics brands, and aquaculture operators are increasingly transitioning from synthetic additives to traceable marine ingredients. Regulators in both North America and Europe are expediting approvals for algae-derived compounds, which are free from heavy-metal and allergen risks. By 2025, closed-loop photobioreactors equipped with LED lighting increased biomass productivity by 30% compared to open ponds, reducing production costs and making algae-based inputs more cost-competitive with petrochemical alternatives. Demand for carrageenan and alginate remains strong in plant-based dairy applications. However, carotenoid sales are growing at a faster rate, driven by the rise of organic aquaculture and clean-label beverage launches, which are encouraging formulators to adopt natural pigments such as astaxanthin and beta-carotene. While North America accounts for one-third of the global algae products market revenue, the Asia-Pacific region is experiencing the fastest growth. This is supported by China’s multi-year funding initiatives for photobioreactor farms and India’s increasing spirulina exports.
Key Report Takeaways
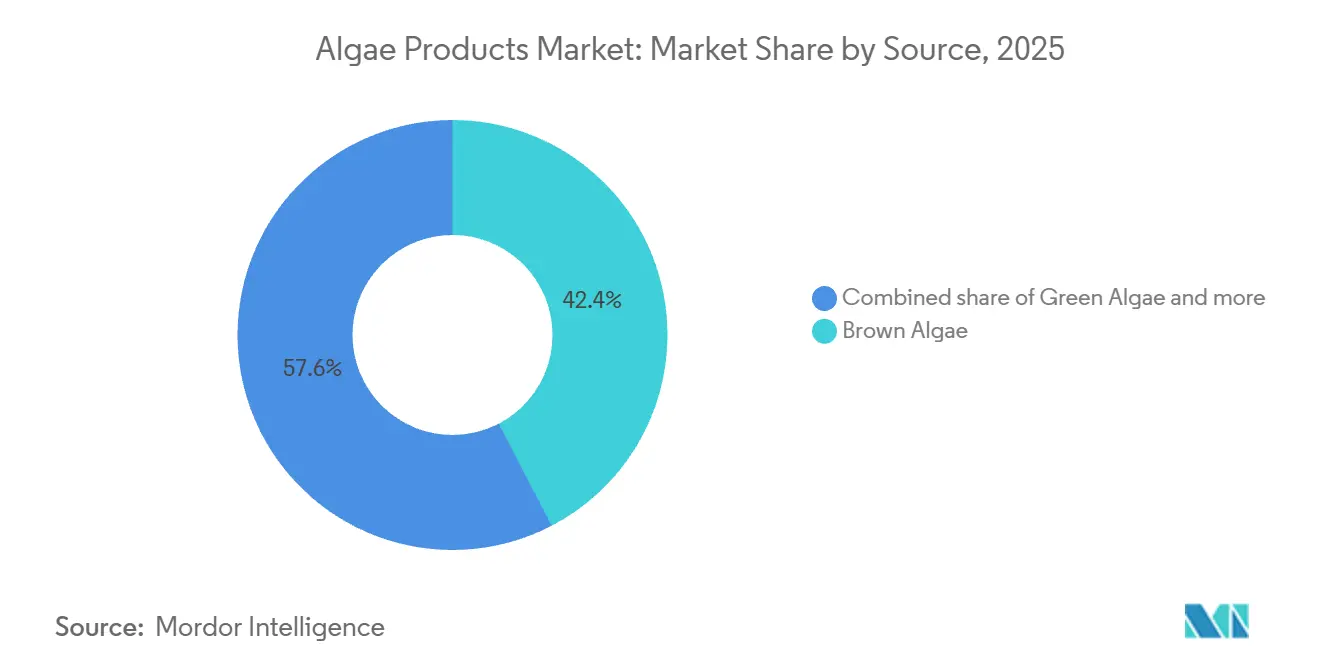
- By source, brown algae captured 42.36% of the algae products market share in 2025, while green algae is projected to chart a 9.19% CAGR through 2031, the fastest among all sources.
- By product type, hydrocolloids retained 45.41% of the algae products market size in 2025; carotenoids lead future growth with a 10.67% CAGR to 2031.
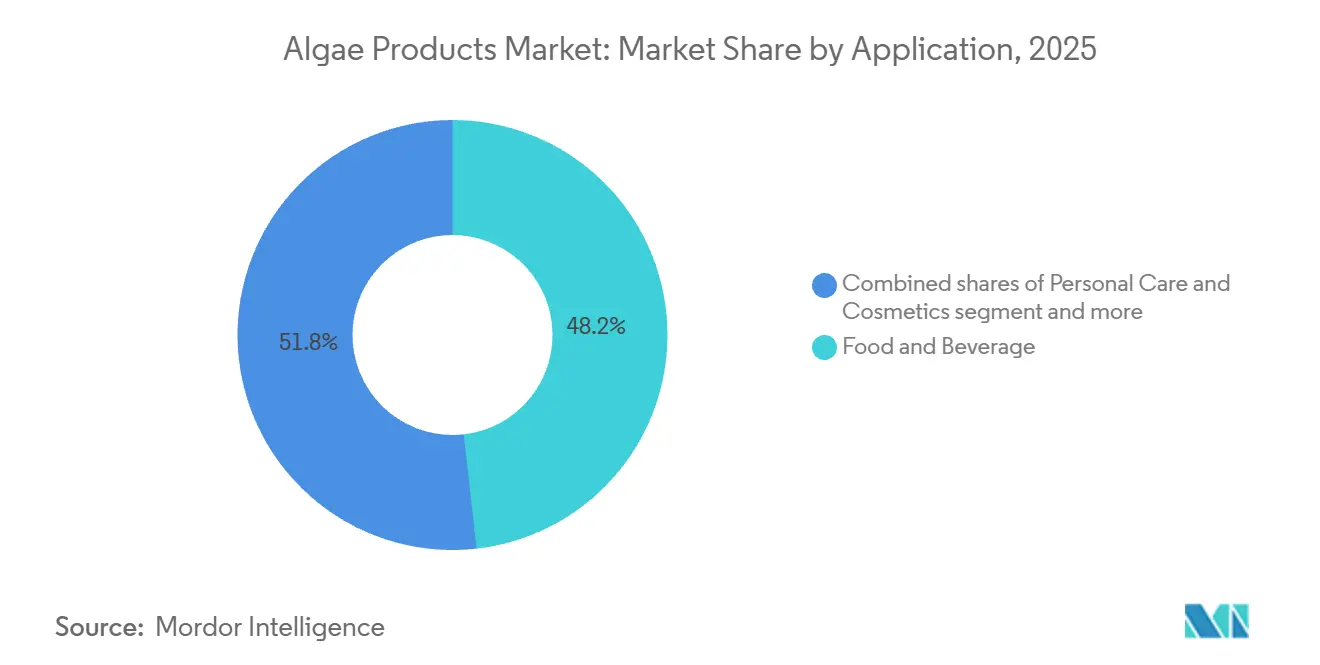
- By application, the food and beverage segment accounted for a 48.21% revenue share in 2025 and is projected to grow at a CAGR of 8.14% during 2026-2031.
- By geography, North America held 34.02% revenue share in 2025; Asia-Pacific is on track for the highest regional CAGR at 8.84% to 2031.
Note: Market size and forecast figures in this report are generated using Mordor Intelligence’s proprietary estimation framework, updated with the latest available data and insights as of 2026.
Market Trends and Insights
Drivers Impact Analysis of Algae Products Market*
| Driver | (~) % Impact on CAGR Forecast | Geographic Relevance | Impact Timeline |
|---|---|---|---|
| Shift toward plant-based and vegan diets seeking alternative proteins | +1.8% | Global, with concentration in North America and Europe | Medium term (2-4 years) |
| Increasing applications in cosmetics for anti-aging, hydration, and skin nourishment | +1.2% | Europe, North America, Asia-Pacific urban centers | Medium term (2-4 years) |
| Environmental sustainability of algae cultivation, using minimal land and water | +1.5% | Global, regulatory push in EU and California | Long term (≥ 4 years) |
| Expansion in animal feed for aquaculture nutrition enhancement | +1.4% | Asia-Pacific core, spill-over to South America | Short term (≤ 2 years) |
| Technological advancements in cultivation like photobioreactors and genetic engineering | +1.0% | North America, Europe, China | Medium term (2-4 years) |
| Demand for clean-label products replacing synthetic additives | +1.3% | Global, led by North America and Western Europe | Short term (≤ 2 years) |
| Source: Mordor Intelligence | |||


Shift toward plant-based and vegan diets seeking alternative proteins
Algae protein concentrates are increasingly replacing soy and pea isolates in sports nutrition and meal-replacement formulations due to their complete amino acid profiles, lower allergenic potential, and minimal land use requirements. Spirulina and chlorella powders achieved a protein content of 35% by dry weight in commercial batches in 2025, comparable to whey isolate benchmarks. These powders also carry vegan and non-genetically modified organism (non-GMO) certifications, which command a 20% price premium in European retail markets. According to DSM-Firmenich's 2025 investor presentation, sales of algae-protein ingredients to beverage brands reformulating ready-to-drink shakes for flexitarian consumers grew by 40% year-over-year. This shift in protein sources extends beyond supplements to bakery and snack products, where algae's neutral flavor profile supports fortification without the off-notes commonly associated with legume proteins. Regulatory developments have further supported adoption, as the United States Food and Drug Administration (FDA) granted Generally Recognized as Safe (GRAS) status to additional chlorella strains in 2025, simplifying formulation approvals for United States food manufacturers.
Increasing applications in cosmetics for anti-aging, hydration, and skin nourishment
In the algae products market, cosmetics formulators are incorporating algae-derived polysaccharides and peptides into serums and creams to leverage their humectant properties and antioxidant activity. This positions algae as a marine-biotechnology alternative to ingredients like hyaluronic acid and retinol. Brown algae extracts, particularly those rich in fucoidans, have shown significant improvement in skin hydration metrics, according to a clinical trial published in the Journal of Cosmetic Dermatology. These findings support claims that drive premium anti-aging product lines. In 2025, L'Oréal and Estée Lauder expanded sourcing agreements with European algae suppliers to secure fucoidan and laminarin extracts for global skincare launches, catering to consumers seeking ocean-derived actives with sustainability narratives. Additionally, red algae-derived carrageenan is being used as a natural thickener in the algae products market. In facial masks and body lotions, replacing synthetic polymers that are under scrutiny due to European Union microplastic regulations. This shift in the cosmetics industry diversifies revenue streams for algae producers, traditionally focused on food applications, and enables margin expansion through higher-value extract sales.
Environmental sustainability of algae cultivation, using minimal land and water
Algae cultivation uses significantly less freshwater per kilogram of protein compared to soy and does not require arable land, making it a sustainable and climate-resilient ingredient source that aligns with corporate net-zero goals and government sustainability mandates. A life-cycle assessment published in 2025 by the International Journal of Life Cycle Assessment revealed that closed photobioreactor algae farms emit fewer greenhouse gases per ton of biomass than open-pond systems, due to energy-efficient LED lighting and waste-heat recovery from nearby industrial facilities. Cargill's 2025 sustainability report outlined plans to source a portion of its protein ingredients from algae by 2030, citing water scarcity in key agricultural regions and regulatory pressures from the European Union's Farm to Fork strategy. Additionally, California's 2025 legislation mandating a reduction in agricultural water use by 2035 has increased interest among food manufacturers in algae-based emulsifiers and proteins that avoid irrigation challenges. This sustainability trend in the algae products market aligns with institutional investors applying Environmental, Social, and Governance (ESG) criteria, directing capital toward algae ventures and boosting valuations in the market.
Expansion in animal feed for aquaculture nutrition enhancement
In the algae products market, aquaculture operators are increasingly using astaxanthin-rich algae meal in salmon and shrimp diets to improve flesh pigmentation and boost immune response. This shift reduces dependence on wild-caught fishmeal and synthetic carotenoids, which are restricted under organic certification regulations. Norwegian salmon farmers significantly increased their adoption of algae-based feed in 2025, following stricter sustainability criteria for fishmeal sourcing introduced by the Aquaculture Stewardship Council [1]Source: Aquaculture Stewardship Council, “2025 Feed Sustainability Standards Update,” asc-aqua.org. This change has driven a structural transition toward algae ingredients with lower environmental impacts. Cyanotech Corporation's annual report highlighted revenue growth from aquaculture feed customers, primarily due to BioAstin astaxanthin sales to Asian shrimp hatcheries seeking natural pigmentation solutions without the use of antibiotics. Additionally, algae-derived omega-3 oils are replacing fish oil in aquafeed formulations, addressing supply challenges caused by declining wild-fish stocks. These oils also support closed-loop aquaculture systems that recycle nutrients. While this feed application generates higher-volume but lower-margin sales compared to human nutrition, it provides revenue stability and ensures capacity utilization for algae producers, particularly during periods of seasonal demand fluctuations in food markets.
Restraints Impact Analysis of Algae Products Market*
| Restraint | (~) % Impact on CAGR Forecast | Geographic Relevance | Impact Timeline |
|---|---|---|---|
| Quality control issues from variable water quality and contaminants | -0.8% | Global, acute in open-pond systems in Asia and South America | Short term (≤ 2 years) |
| Supply chain disruptions from logistics and weather variability | -0.6% | South America, Southeast Asia, coastal regions | Short term (≤ 2 years) |
| Shortage of skilled labor for specialized algae farming | -0.5% | Emerging markets in Asia-Pacific and Middle East | Medium term (2-4 years) |
| Weather dependency impacting outdoor cultivation yields | -0.4% | South America, Southeast Asia, outdoor raceway operations | Short term (≤ 2 years) |
| Source: Mordor Intelligence | |||
Quality control issues from variable water quality and contaminants
In the algae products market, microbial contamination and heavy-metal accumulation in algae biomass continue to pose significant challenges for open-pond cultivation systems that utilize water from rivers and coastal sources affected by agricultural runoff and industrial discharge. A study published in 2025 in the journal Environmental Science and Technology reported cadmium levels exceeding European Union (EU) limits in a significant portion of spirulina samples from Chinese open-pond farms. This finding led to import bans and prompted European buyers to shift procurement to closed-system suppliers using municipal water inputs. Additionally, the United States Food and Drug Administration's 2025 warning letter to a California spirulina producer highlighted microcystin contamination above the agency's action level. This incident underscored the industry's vulnerability to cyanobacterial co-contamination when water-quality monitoring is inadequate. Such quality issues undermine buyer confidence and necessitate batch-by-batch testing protocols, which increase production costs, thereby compressing margins for mid-tier producers unable to invest in advanced filtration and real-time pathogen detection systems. In 2025, regulatory bodies such as the European Food Safety Authority (EFSA) and the United States Pharmacopeia tightened contaminant thresholds for algae-based ingredients, raising compliance requirements and driving consolidation toward vertically integrated suppliers equipped with in-house laboratories.
Supply chain disruptions from logistics and weather variability
The limited shelf life of algae biomass and its sensitivity to temperature changes during transport create significant logistical challenges, disrupting ingredient availability for food and feed manufacturers that depend on just-in-time production schedules. In 2025, tropical storms in Southeast Asia delayed spirulina shipments from Indonesian farms to Japanese supplement brands, forcing buyers to procure emergency supplies from United States suppliers at higher price premiums. Additionally, freeze-drying and spray-drying infrastructure is primarily located in North America and Europe, requiring producers in South America and Africa to transport wet biomass to distant processing facilities. This results in high freight costs, reducing export competitiveness. Weather dependency further complicates these issues in the algae products market. Outdoor raceway systems in Chile and Brazil experience significant yield variability between wet and dry seasons. This variability makes it difficult to establish long-term supply contracts, which are essential for food manufacturers planning product launches. As a result, supply unpredictability encourages buyers to adopt dual-sourcing strategies and maintain safety stock, weakening supplier pricing power and limiting the industry's ability to fully capitalize on demand growth.
*Our forecasts treat driver/restraint impacts as directional, not additive. The impact forecasts reflect baseline growth, mix effects, and variable interactions.
Algae Products Market Segment Analysis
By Source:
Brown Algae Dominance Anchored in Hydrocolloid LegacyKelp and other brown algae species contribute alginates and fucoidans, which are utilized as emulsifiers, thickeners, and bioactive compounds in food, pharmaceutical, and cosmetics applications. These applications are expected to sustain their 42.36% revenue shareof the algae products market in 2025. Alginate's unique gelling properties, activated in the presence of calcium ions, make it essential for plant-based cheese and restructured seafood products, where it mimics the melt and stretch characteristics of dairy casein. Red algae accounted for a significant portion of revenue in 2025, driven by the demand for carrageenan in dairy alternatives and pharmaceutical capsules. However, growth in this segment is expected to moderate as some formulators shift to alginate due to consumer concerns regarding carrageenan's inflammatory profile.
Green algae, including spirulina and chlorella, are projected to grow at an annual rate of 9.19% through 2031, driven by the adoption of protein concentrates in sports nutrition and docosahexaenoic acid (DHA) oil sales to infant formula manufacturers seeking fish-free omega-3 sources. Blue-green algae, primarily spirulina and Aphanizomenon flos-aquae, occupy a smaller niche market focused on phycocyanin colorants and immune-support supplements. However, quality-control challenges limit their broader adoption in mainstream food applications. Technological advancements in brown algae cultivation, such as offshore kelp farms anchored to floating platforms, are increasing harvest volumes without competing for coastal land or freshwater resources. Norway's 2025 pilot project demonstrated annual yields of 25 tons per hectare from offshore kelp farms, which is double the productivity of nearshore operations, while also sequestering nitrogen runoff from nearby salmon aquaculture.


By Product Type:
Carotenoids Outpace Hydrocolloids on Aquaculture MomentumIn the algae products market, carotenoids are projected to grow at an annual rate of 10.67% through 2031, marking the fastest growth among product categories. This growth is driven by aquaculture operators and beverage brands prioritizing natural pigmentation and antioxidant fortification over synthetic alternatives, which are increasingly subject to regulatory phase-outs. Hydrocolloids are expected to account for 45.41% of revenue in 2025, supported by carrageenan's established use in dairy-free yogurt and ice cream. However, growth in this segment is slowing as formulators explore alternatives like pectin and gellan gum to address carrageenan's divisive consumer perception.
Algal protein is expected to hold a significant share of revenue in the near future, with spirulina and chlorella powders increasingly being incorporated into meal-replacement shakes and protein bars. However, challenges such as addressing taste masking and improving digestibility continue to limit their adoption in mainstream snack categories. Lipids, including Docosahexaenoic Acid (DHA) and Eicosapentaenoic Acid (EPA) oils, are anticipated to play a notable role in revenue generation. This trend is largely driven by infant formula manufacturers replacing fish oil to reduce heavy-metal risks and align with vegan dietary preferences.
By Application:
Food and Beverage Sustains Leadership Through Clean-Label ImperativeIn the algae products market, plant-based dairy alternatives, natural colorants, and vegan omega-3 fortification are projected to contribute 48.21% of revenue in the food and beverage segment by 2025, with an annual growth rate of 8.14% through 2031. This growth is primarily driven by manufacturers reformulating products to align with clean-label requirements and allergen-free positioning. The personal care and cosmetics segment is expected to experience rapid growth in 2025, driven by the incorporation of algae-derived humectants and antioxidants into anti-aging serums and body lotions. However, this segment remains smaller in absolute revenue compared to the food and beverage segment, contributing only a minor share of total sales.
Dietary supplements, such as spirulina tablets, chlorella capsules, and astaxanthin softgels, are expected to contribute significantly to revenue in the coming years. These products appeal to health-conscious consumers who prioritize immune support and antioxidant benefits. However, growth in this segment is likely to slow as mainstream food fortification addresses incremental demand. Pharmaceuticals continue to represent a niche but high-margin application, with algae-derived excipients and omega-3 fatty acids being utilized in drug delivery systems and cardiovascular therapies.
Geography Analysis
North America Algae Products Market
North America is expected to account for 34.02% of revenue in the algae products market in 2025, driven by its established carrageenan and alginate supply chains that support plant-based dairy and pharmaceutical manufacturers. However, growth in the region is anticipated to moderate annually through 2031 due to market saturation in dairy alternatives and evolving regulatory acceptance of algae ingredients. Demand is likely to shift toward emerging applications such as natural colorants and vegan omega-3 oils. The United States Food and Drug Administration's (FDA) 2025 expansion of Generally Recognized as Safe (GRAS) status to additional chlorella and spirulina strains has simplified formulation approvals, enabling United States food manufacturers to include algae protein in snack bars and ready-to-drink beverages without lengthy regulatory reviews [2]Source: United States Food and Drug Administration, “GRAS Notice Inventory,” fda.gov. Furthermore, California's 2025 food-dye labeling law, which requires front-of-pack warnings for synthetic colorants, has encouraged beverage brands to adopt phycocyanin to avoid stigmatizing labels while maintaining vibrant blue hues in sports drinks and flavored waters.
APAC Algae Products Market
The Asia-Pacific region is projected to grow at a compound annual growth rate (CAGR) of 8.84% through 2031, making it the fastest-growing regional market. This growth is fueled by China's investments in photobioreactor technology, India's spirulina export expansion, and Japan's increasing use of algae-derived docosahexaenoic acid (DHA) in infant formula and elderly nutrition products. China's 2025 Five-Year Plan has allocated CNY 3.6 billion to algae biotechnology research, focusing on reducing costs in photobioreactor systems and optimizing lipid-producing strains to establish the country as a global supplier of omega-3 oils. In India, spirulina farms in Tamil Nadu and Gujarat increased production to 15,000 tons annually in 2025, exporting bulk powder to European supplement brands and supplying domestic Ayurvedic medicine manufacturers. This growth is supported by government subsidies aimed at promoting algae cultivation as a climate-resilient protein source.
Europe Algae Products Market
In Europe, growth is supported by strict clean-label regulations and consumer demand for traceable, sustainable ingredients. However, annual growth is expected to moderate through 2031 as mature markets in Germany, France, and the United Kingdom approach saturation in plant-based dairy and supplement categories. The European Food Safety Authority's (EFSA) 2025 novel-food approvals for algae-derived omega-3 oils and phycocyanin colorants have removed regulatory barriers that previously limited adoption. This has allowed for broader use of these ingredients in formulations across beverage, bakery, and confectionery applications [3]Source: European Food Safety Authority, “Novel Foods,” efsa.europa.eu.
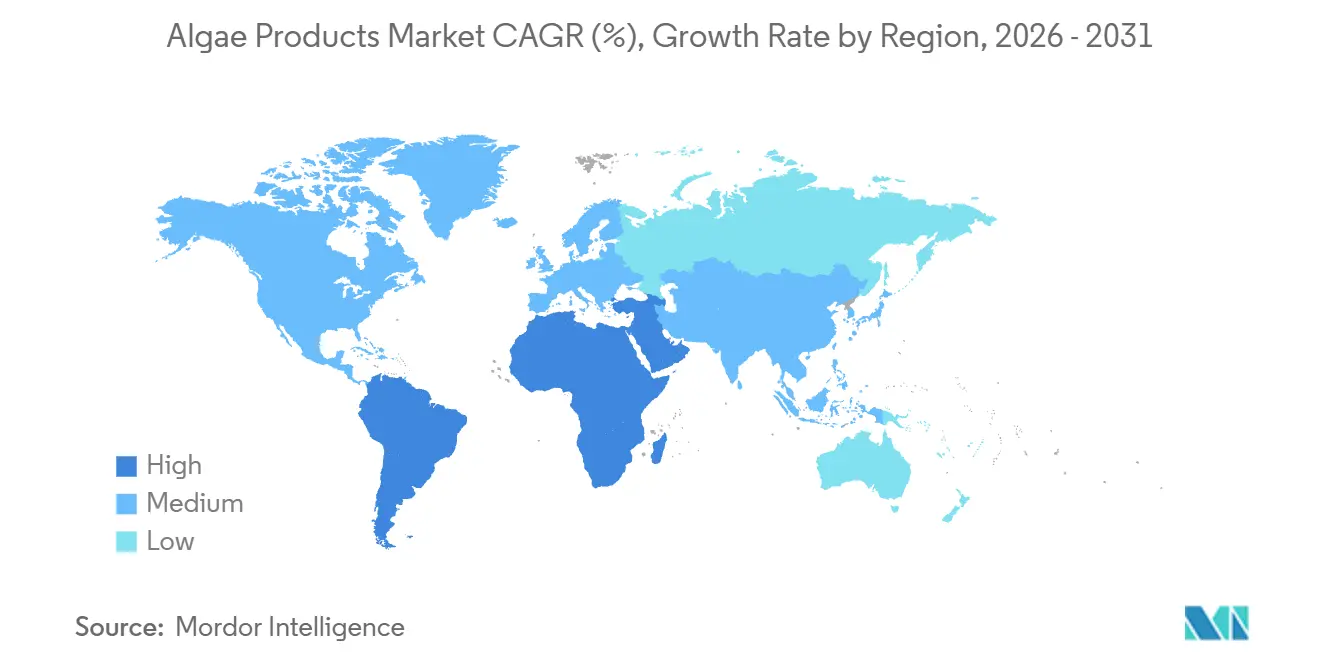
Note: Segment shares of all Individual segments will be available upon report purchase

Regulatory Landscape
Regulation for algae-derived ingredients is tightening around safety, identity, and contaminant controls as adoption expands across food, supplements, and feed. In the European Union, the Novel Food framework (Regulation (EU) 2015/2283) remains a primary gatekeeper for new species, strains, and extracts, supported by EFSA scientific opinions and updates to the Union list and the Novel Food Status Catalogue. In 2024, the European Commission authorized beta-glucan from Euglena gracilis as a novel food via an implementing regulation, and it also updated specifications for astaxanthin-rich oleoresin from Haematococcus pluvialis, reinforcing a trend toward tighter compositional specifications for high-value algae actives.
In the United States, food and color-additive pathways remain central to commercialization for algae-derived pigments and bioactives. In June 2025, the US FDA amended color additive regulations to authorize galdieria extract blue for use in multiple food categories, expanding the regulatory toolkit for clean-label beverage and confectionery formulators seeking natural blue hues. Across regions, regulators are placing emphasis on strain-level taxonomic clarity, robust characterization (including heavy metals and biotoxins), and fit-for-purpose toxicology and allergenicity packages. This raises compliance burdens for open-pond supply chains and benefits producers with controlled cultivation systems and in-house QA/QC.
Value Chain Analysis
The algae products value chain runs from strain selection and seed culture through cultivation (open ponds, offshore farming, or closed photobioreactors and heterotrophic fermentation), then harvesting, dewatering, drying, and conversion into standardized ingredients such as hydrocolloids (carrageenan, alginate), proteins, carotenoids (astaxanthin, beta-carotene), pigments (phycocyanin), and lipids (DHA/EPA). Value addition concentrates in extraction, purification, and functional stabilization, followed by formulation into end markets spanning food and beverage, personal care and cosmetics, dietary supplements, pharmaceuticals, and animal feed. Processing and formulation hubs often sit closer to advanced ingredient-manufacturing ecosystems, while cultivation hubs cluster around favorable climate, energy, and permitting conditions, which in turn drives intercontinental logistics for biomass and semi-refined intermediates.
Key bottlenecks center on energy-intensive dewatering and drying and the capital intensity of controlled systems, alongside variable quality and regulatory timelines for new strains. The chain is therefore shifting toward partnerships that lock in offtake and scale-up capabilities: in February 2025, Brevel signed a 10-year purchase and development agreement with CBC Group to supply microalgae protein and oils for functional beverages and dairy alternatives, linking a cultivator directly with a large beverage platform. In August 2025, Corbion partnered with Kuehnle AgroSystems to develop and commercialize natural astaxanthin from non-GMO heterotrophic algae using fermentation technology and industrial production capabilities, reflecting a move toward fermentation-led scalability for premium carotenoids.
Competitive Landscape
The algae products market is moderately fragmented, comprising multinational ingredient suppliers, specialized algae cultivators, and regional processors competing on factors such as price, purity, and sustainability. Companies like Archer Daniels Midland, Cargill, and BASF utilize vertically integrated supply chains and global distribution networks to secure volume contracts with food manufacturers. However, they face margin pressures due to commodity carrageenan and alginate pricing, leading to strategic shifts toward higher-value products such as carotenoids and algal proteins through acquisitions and joint ventures. For example, DSM-Firmenich plans to launch a genetically optimized Haematococcus strain in 2025. This demonstrates how established players leverage research and development to maintain premium positioning against low-cost Asian competitors.
Opportunities for growth are concentrated in pharmaceutical excipients, where algae-derived polymers can replace synthetic cellulose derivatives in controlled-release tablets, and in pet food, where omega-3 oils support joint health and coat quality without the oxidative instability associated with fish oil. Emerging players are adopting closed photobioreactor systems and artificial intelligence (AI)-driven nutrient optimization, achieving contamination-free batch rates of up to 95%. This quality consistency allows them to enter high-purity markets such as pharmaceuticals and infant formula.
Additionally, patent filings for modular photobioreactor designs with integrated carbon dioxide (CO2) capture highlight increasing competition in cultivation efficiency. These innovations enable producers to generate carbon-offset revenue streams, helping to subsidize production costs and improve returns on invested capital.
Algae Products Industry Leaders
Archer Daniels Midland Company
Cargill, Incorporated
BASF SE
DSM-Firmenich AG
Corbion NV
- *Disclaimer: Major Players sorted in no particular order
Algae Products Market Companies Covered in this Report
- Archer Daniels Midland Company
- Cargill, Incorporated
- BASF SE
- DSM-Firmenich AG
- Corbion NV
- AlgoSource Group
- Cyanotech Corporation
- Pond Technologies Inc.
- Phycom BV
- Zhejiang Binmei Biotechnology Co., Ltd.
- Algenol Biotech LLC
- DIC Group
- BlueBioTech GmbH
- Cellana Inc.
- Fuji Chemical Industries Co., Ltd.
- AlgaEnergy S.A.
- Algatechnologies Ltd.
- Tate & Lyle PLC
- Murugappa Group
- Tianjin Norland Biotech Co., Ltd.

Market Opportunities and Future Outlook
Commercial whitespace is opening around algae-derived omega-3 oils, natural colorants, and high-purity carotenoids where clean-label reformulation and supply security intersect with expanding industrial capacity. In Europe, MiAlgae commenced construction of a large-scale algal omega-3 production facility in Grangemouth, Scotland (announced December 2025), indicating investment in localized omega-3 supply chains that can serve aquafeed and nutrition applications while reducing reliance on marine fish oil inputs. In North America, DIC Group (Earthrise Nutritionals) expanded capacity for spirulina-based natural blue colorant (LINABLUE) production at its California facilities (February 2026), aligning with beverage and confectionery demand for stable natural blues as brands move away from synthetic colorants.
Opportunities also center on building resilient, multi-node cultivation and processing footprints to reduce logistics exposure and address contaminant risk, particularly for spirulina and chlorella used in mainstream foods and supplements. In Asia-Pacific, start of operations for a spirulina cultivation facility in Bao Loc, Vietnam with 600 tonnes annual capacity (March 2026) adds new regional supply that can support both domestic demand and export channels. Across applications, formulation-focused innovation remains a practical adoption lever, including taste and odor management for algal proteins and improving stability and bioavailability for bioactives, which supports premium positioning in beverages, infant and adult nutrition, and personal care actives.
Recent Industry Developments in Algae Products Market
- May 2026: Archer Daniels Midland (ADM) launched eight new regionally sourced soy and pea protein ingredient solutions across North America and Europe. While not algae-specific, the rollout increases competitive intensity for algae proteins in the alternative-protein ingredient set. It also raises the importance of differentiation on allergen positioning, traceability, and functional performance in beverages and nutrition formats.
- September 2025: BASF completed the sale of its Food and Health Performance Ingredients business to Louis Dreyfus Company, including the Illertissen, Germany production site and three application labs. The divestment reshapes the competitive map for specialty nutrition ingredients. It can also influence how omega-3 and related health-ingredient portfolios are prioritized and commercialized by the new owner and adjacent suppliers.
- December 2024: BASF signed a binding agreement to divest its Food and Health Performance Ingredients business to Louis Dreyfus Company. The transaction plan signaled portfolio repositioning toward BASF core platforms such as vitamins and carotenoids. It also set up the transfer of manufacturing and application capabilities that serve food and nutrition customers evaluating algae-derived alternatives.


Algae Products Market Report Scope and Research Methodology
Market Definition and Coverage
This market covers commercial algae-derived products that are sold as ingredients or finished inputs and used across food, supplements, personal care, pharmaceuticals, and animal nutrition. The sizing is captured in value terms for the revenues linked to these algae products.
Scope exclusions: Pure biofuel-grade algae biomass grown and sold only for energy use is excluded when it is not processed into higher-value algae products.
Segments Covered in This Report
- By Source
- Brown Algae
- Red Algae
- Green Algae
- Blue-green Algae
- By Product Type
- Hydrocolloids
- Carrageenan
- Alginate
- Others
- Algal Protein
- Carotenoids
- Lipids
- Other Product Types
- Hydrocolloids
- By Application
- Food and Beverage
- Personal Care and Cosmetics
- Dietary Supplements
- Pharmaceuticals
- Animal Feed
- Other Applications
- By Geography
- North America
- United States
- Canada
- Mexico
- Rest of North America
- Europe
- Germany
- United Kingdom
- Italy
- France
- Spain
- Netherlands
- Poland
- Belgium
- Sweden
- Rest of Europe
- Asia-Pacific
- China
- India
- Japan
- Australia
- Indonesia
- Rest of Asia-Pacific
- South America
- Brazil
- Argentina
- Colombia
- Chile
- Peru
- Rest of South America
- Middle East and Africa
- South Africa
- Saudi Arabia
- United Arab Emirates
- Turkey
- Rest of Middle East and Africa
- North America
Data Sources, Market Sizing, and Validation
Desk Research
Desk research starts by mapping the supply chain for algae cultivation, extraction, and downstream product use, so we can keep the market scope consistent across years. We used public sources such as FAO datasets, UN Comtrade trade statistics, US FDA ingredient and safety information, European Commission food and feed rules, and scientific journals that discuss algae composition and processing yields.
We also reviewed company annual reports, investor decks, and credible industry press to understand capacity additions, product focus, and demand signals from end users. When available, paid subscriptions for company financials and intelligence, patent databases, and shipment-level import-export data were used to cross-check reported revenues, innovation trends, and trade flows tied to algae-based inputs. The sources noted above are illustrative and not exhaustive, since other public references were also used for collection, validation, and clarification.
Primary Interviews and Surveys
Primary work used expert interviews and short surveys with algae ingredient producers, processors, distributors, and large downstream buyers in food, supplements, feed, and personal care. For a global market, inputs were checked across APAC, EMEA, and the Americas so that pricing, product mix, and adoption assumptions were not driven by a single region.
Distribution of primary research fieldwork respondents
| Company type | Respondent position | Region |
|---|---|---|
| Top tier: 33% | CXOs: 12% | APAC: 43% |
| Mid tier: 50% | Functional/Unit leaders: 28% | EMEA: 37% |
| Smaller Players: 17% | Managers: 60% | Americas: 20% |
Market-Sizing & Forecasting
The core model uses a top-down and bottom-up approach where food, supplement, personal care, pharma, and feed demand pools are reconstructed using trade flows, production indicators, and adoption rates for algae-based inputs, then converted into value using category-level pricing. To keep totals realistic, we corroborated the outputs with selective bottom-up checks, such as sampled supplier revenue splits, channel markups, and ASP times volume for key algae product groups.
Key inputs that shaped the model included average selling price movements for algae extracts and hydrocolloids, observed import-export volumes for relevant algae products, capacity utilization signals for cultivation and extraction, the mix shift between macroalgae and microalgae derived outputs, and end-use penetration trends in supplements and functional foods. Where the bottom-up checks had gaps, for example limited disclosure for smaller private players, the missing share was handled through measured expansion factors tied back to trade and production signals, then verified through follow-up discussions. Forecasting was supported through scenario analysis, with growth rates adjusted using expert views on regulatory approvals, new capacity ramp-ups, and substitution behavior versus adjacent ingredients.
Data Validation & Update Cycle
Outputs are validated through multiple checks, including variance reviews across regions, price and volume consistency tests, and comparison against independent signals such as trade trends and reported capacity changes. When unexpected jumps appear, assumptions are revisited and respondents are re-contacted to confirm whether the shift came from pricing, product mix, or a real demand step-up.
Before sign-off, the model and key assumptions go through a multi-step analyst review so arithmetic, units, and scope alignment stay clean. The report is refreshed annually, with interim updates for material events affecting supply, regulation, or demand, followed by a final pre-delivery pass so clients receive the latest updated view.
Mordor Intelligence's Algae Products Market Size Compared Against Other Published Estimates
Published market values for algae products do not always match because each publisher can define the product set differently, choose a different base year, and apply different pricing logic across algae types and applications. Currency timing, regional coverage, and the refresh cadence can also move the final total.
Some public estimates run broader by counting algae-linked revenues that behave more like bulk biomass markets, including energy-only biomass in certain cases. For Mordor Intelligence, pure biofuel-grade algae biomass is excluded unless it is processed into commercially traded algae products used as ingredients, which keeps the value tied to observable pricing and end-use demand signals.
Benchmark comparison
| Source | Market Size | Gaps in Research Methodology |
|---|---|---|
| Mordor Intelligence | USD 4.13 B (2026) | |
| Industry Publisher A | USD 6.19 B (2026) | Uses a broader definition of commercially processed algae products and may apply different assumptions on what counts as end-market revenue across forms and sources, which can lift the 2026 value versus an ingredient-focused scope. |
| Market Tracker B | USD 5.10 B (2024) | Uses a different base year and may blend algae product families into wider application buckets, which changes the price times volume conversion and the inflation carry-forward into the starting point. |
Across the three figures, the biggest drivers of the spread are scope choices and base-year selection, followed by how prices are stepped forward for each product family. Our method stays traceable because the total can be re-built from clear product inclusion rules, basic volume signals, and simple pricing checks that are revisited during updates.


Key Questions Answered in the Report
How large will the Algae products market become by 2031?
It is projected to reach USD 5.84 billion, advancing at a 7.17% CAGR between 2026 and 2031.
Which algae source is expanding fastest?
Green algae, propelled by spirulina and chlorella, is forecast for a 9.19% CAGR through 2031.
Why are carotenoids gaining traction in aquaculture?
Organic salmon standards ban synthetic pigments, so feed mills are shifting to algae-derived astaxanthin with 4% concentration that lowers inclusion rates.
What regions will see the highest growth?
Asia-Pacific is expected to register the fastest CAGR at 8.84% as China and India scale photobioreactors and spirulina exports.
Which application drives the majority of demand?
Food and beverage remains dominant, accounting for 48.21% of revenue in 2025 as brands reformulate for clean labels.
Page last updated on:





