
Agrigenomics Market Size and Share
Market Overview
| Study Period | 2021 - 2031 |
|---|---|
| Market Size (2026) | USD 5.49 Billion |
| Market Size (2031) | USD 8.74 Billion |
| Growth Rate (2026 - 2031) | 9.76 % |
| Fastest Growing Market | Asia Pacific |
| Largest Market | North America |
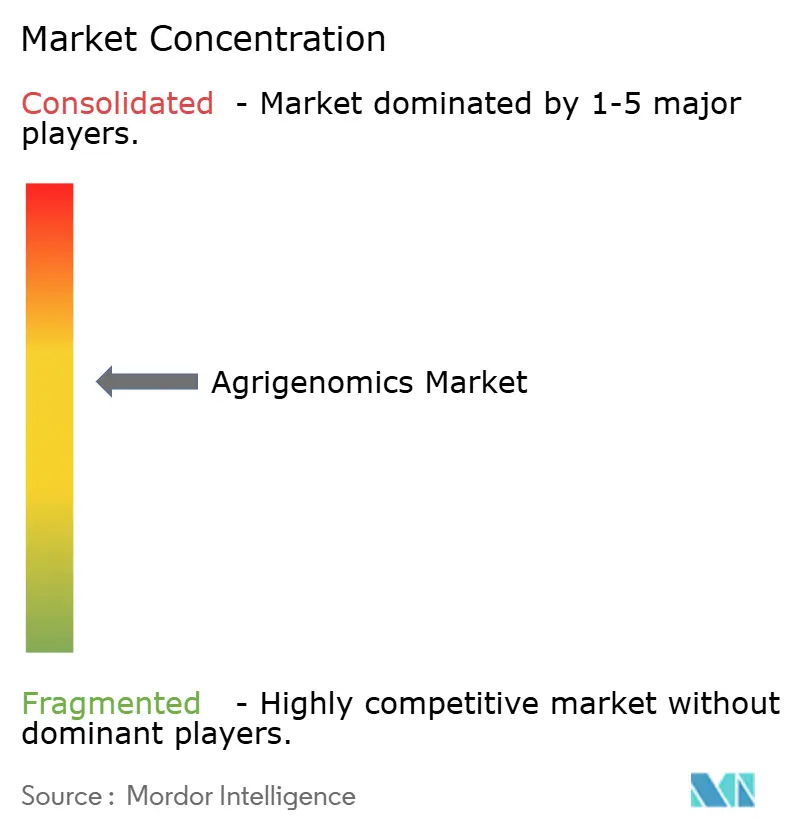
| Market Concentration | Medium |
Major Players *Disclaimer: Major Players sorted in no particular order Image © Mordor Intelligence. Reuse requires attribution under CC BY 4.0. | |
Agrigenomics Market Analysis by Mordor Intelligence
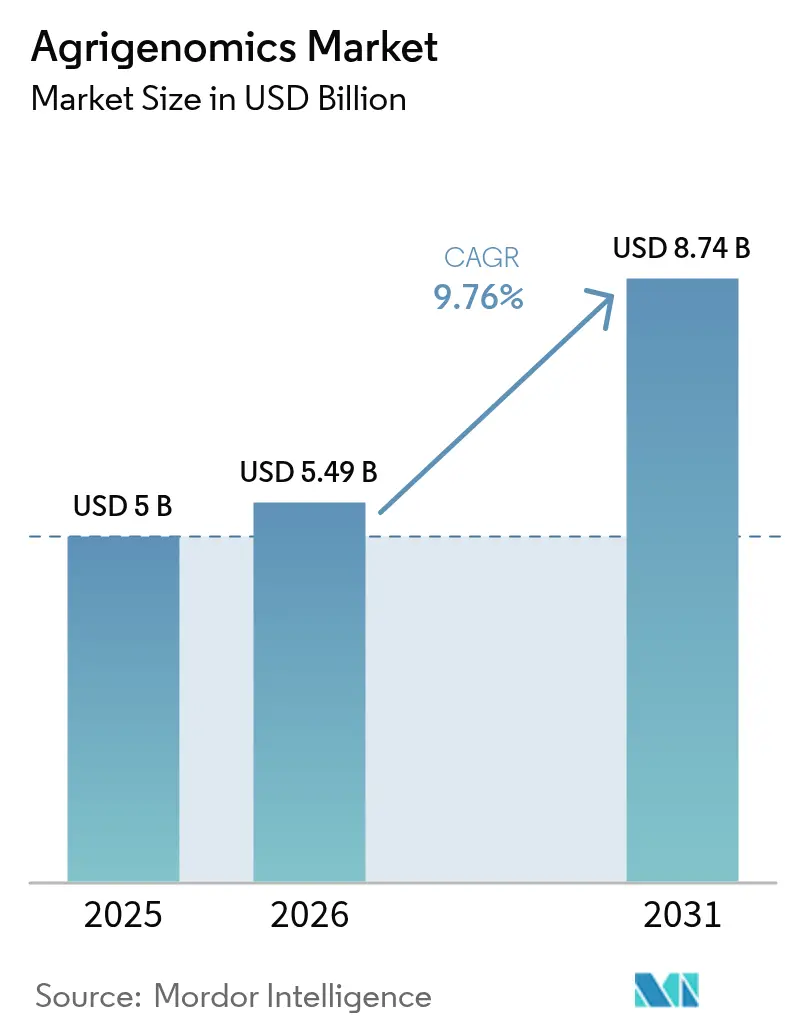
Agrigenomics market size in 2026 is estimated at USD 5.49 billion, growing from 2025 value of USD 5.0 billion with 2031 projections showing USD 8.74 billion, growing at 9.76% CAGR over 2026-2031. Cost compression in next-generation sequencing (NGS) has lowered whole-genome sequencing to under USD 600 per genome, opening population-scale projects once reserved for well-funded laboratories. Governments add momentum, like the USDA’s AG2PI program alone has directed USD 220 million toward crop and livestock genomics, while China’s 2024-2028 plan elevates gene editing for wheat, corn, and soybeans. Real-time PCR maintains broad adoption because of simplicity and cost, but NGS grows faster on the back of large data outputs, multi-omics integration, and AI-driven analytics. North America retains an innovation lead, yet Asia-Pacific now delivers the steepest growth curve as national food-security programs merge with private investment. The competitive intensity remains moderate. Illumina and Thermo Fisher expand coverage through acquisitions such as Thermo Fisher’s USD 3.1 billion purchase of Olink to strengthen multi-omics capabilities.
Key Report Takeaways
- By technology, Real-Time PCR led with 38.02% revenue share in 2025, while Next-Generation Sequencing is projected to post a 12.22% CAGR by 2031.
- By application, crops accounted for a 63.85% share of the agrigenomics market size in 2025; livestock is advancing at an 11.14% CAGR through 2031.
- By service offering, genotyping held a 40.55% revenue share in 2025, and gene-expression analysis is forecast to expand at a 12.28% CAGR to 2031.
- By sequencer type, Illumina HiSeq/NovaSeq platforms commanded 35.22% of agrigenomics market share in 2025, whereas long-read systems from PacBio and Oxford Nanopore are set to grow at 13.15% CAGR.
- By geography, North America captured a 41.68% share in 2025, while Asia-Pacific is projected to rise at an 11.33% CAGR through 2031.
Note: Market size and forecast figures in this report are generated using Mordor Intelligence’s proprietary estimation framework, updated with the latest available data and insights as of 2026.
Market Trends and Insights
Drivers Impact Analysis of Agrigenomics Market*
| Driver | (~) % Impact on CAGR Forecast | Geographic Relevance | Impact Timeline |
|---|---|---|---|
| Falling NGS costs and throughput expansion | +2.1% | Global | Short term (≤ 2 years) |
| Rising demand for climate-resilient seed and livestock lines | +1.8% | Global; drought-prone regions | Medium term (2-4 years) |
| Government genomics programs in agri-innovation hubs | +1.5% | North America, Europe, Asia-Pacific | Medium term (2-4 years) |
| AI-driven predictive breeding platforms | +1.3% | North America, Europe, China | Long term (≥ 4 years) |
| Commercialization of low-pass WGS for livestock | +1.0% | Global livestock regions | Medium term (2-4 years) |
| Carbon-credit valuation of genomics-enabled yield gains | +0.8% | North America, Europe, Australia | Long term (≥ 4 years) |
| Source: Mordor Intelligence | |||
Falling NGS Costs and Throughput Expansion
Rapid cost declines remain the most powerful accelerant for the agrigenomics market. Whole-genome sequencing has dropped from millions of dollars to roughly USD 500–600 per genome, allowing routine use in crop variety characterization and herd management.[1]Nature Editorial Team, “Genome sequencing costs keep tumbling,” nature.com Illumina’s XLEAP-SBS chemistry boosts reads per flow cell, while Oxford Nanopore’s T2T assemblies yield gap-free genomes suited to complex trait mapping. BGI’s DNBSEQ-T7 raises daily throughput into the multi-terabase range and supports more than half of global sequencing projects. Capacity gains democratize access for mid-tier breeding programs that previously relied on outsourced genotyping, accelerating data generation and lowering per-sample turnaround time. As sequencing platforms bundle analytics and cloud pipelines, entry barriers continue to fall for cooperatives, universities, and small research stations.
Rising Demand for Climate-Resilient Seed and Livestock Lines
Escalating climate volatility places a premium value on drought, heat, and disease tolerance traits. USDA approval for HB4 drought-tolerant wheat underscores regulatory momentum toward resilient germplasm. India’s ICAR introduced genome-edited rice that yields 25% more under stress, illustrating adoption in markets highly exposed to weather risk. Corteva invested USD 25 million in Pairwise to exploit CRISPR editing for abiotic stress traits. The agrigenomics market leverages this priority as seed companies align Research and Development pipelines with climate adaptation, bundling genomics with remote phenotyping to shorten selection cycles.
Government Genomics Programs in Agri-Innovation Hubs
Public funding solidifies infrastructure and lowers private risk. The USDA’s AG2PI invests USD 220 million in shared data platforms and phenotyping facilities.[2]USDA Office of Communications, “USDA Announces AG2PI Initiative,” usda.gov India’s 2024 Union Budget deploys digital public infrastructure for 60 million farmers and earmarks INR 750 crore (USD 89.6 million) for the AgriSURE startup fund. China’s 2024-2028 blueprint targets independent CRISPR toolkits for staple crops. The UK’s Precision Breeding Act accelerates commercialization paths for gene-edited cultivars. Coordinated public investment de-risks innovation for private breeders, stimulates startup ecosystems, and expands talent pipelines, collectively boosting agrigenomics market performance.
AI-Driven Predictive Breeding Platforms
Machine learning tightens the feedback loop between genotype and phenotype. Syngenta and InstaDeep train Large Language Models on genomic text to predict trait expression in corn and soybeans. Google spinout Heritable Agriculture applies deep learning to accelerate ideotype discovery across cereals. SEEDX raised USD 20 million to classify genetic purity from seed images, cutting lab assays from weeks to hours. Bayer partnered with Source.ag to merge greenhouse data with genomic selection, pushing faster vegetable product cycles. AI augments breeder intuition with probabilistic rankings that guide cross designs, reducing the cost and time required for field testing while raising success hit rates.
Restraints Impact Analysis of Agrigenomics Market*
| Restraint | (~) % Impact on CAGR Forecast | Geographic Relevance | Impact Timeline |
|---|---|---|---|
| High sequencing and bioinformatics capex | -1.4% | Global; especially emerging markets | Short term (≤ 2 years) |
| Fragmented GMO and gene-edited crop regulations | -1.1% | EU, selected developing economies | Medium term (2-4 years) |
| Bioinformatics skill shortages in emerging regions | -0.9% | Africa, South America, parts of Asia | Long term (≥ 4 years) |
| Data-sovereignty limits on cross-border genomic datasets | -0.7% | Global; notably US-China collaboration | Medium term (2-4 years) |
| Source: Mordor Intelligence | |||
High Sequencing and Bioinformatics Capex
Even with falling variable costs, high upfront investment in sequencers, compute clusters, and talent slows uptake. Illumina’s NovaSeq X requires significant capital outlays alongside recurring reagent commitments. Smaller cooperatives struggle to recruit bioinformaticians, prompting interest in low-pass sequencing strategies that deliver acceptable accuracy at sequencing depths as low as 0.05-fold. Cloud-based “sequencing-as-a-service” mitigates infrastructure costs yet still leaves data-analysis knowledge gaps. Without dedicated grants or public-private consortia, many smallholders postpone genomics investment, constraining agrigenomics market penetration in regions where productivity gains would be highest.
Fragmented GMO and Gene-Edited Crop Regulations
Regulatory heterogeneity drives compliance costs and slows transnational deployment. The European Court of Justice ruled that gene-edited crops must follow GMO directives, maintaining a multi-year approval path. In contrast, Argentina exempts edits with no foreign DNA, and Brazil’s RN16 classifies edits case-by-case. A December 2024 U.S. District Court decision vacated parts of USDA’s revised biotech rule, injecting temporary uncertainty, although prior status reviews stand. For multinational breeders, parallel dossiers lengthen time-to-market and raise legal risks, dissuading smaller innovators and limiting cross-border data exchange.
*Our forecasts treat driver/restraint impacts as directional, not additive. The impact forecasts reflect baseline growth, mix effects, and variable interactions.
Agrigenomics Market Segment Analysis
By Technology:
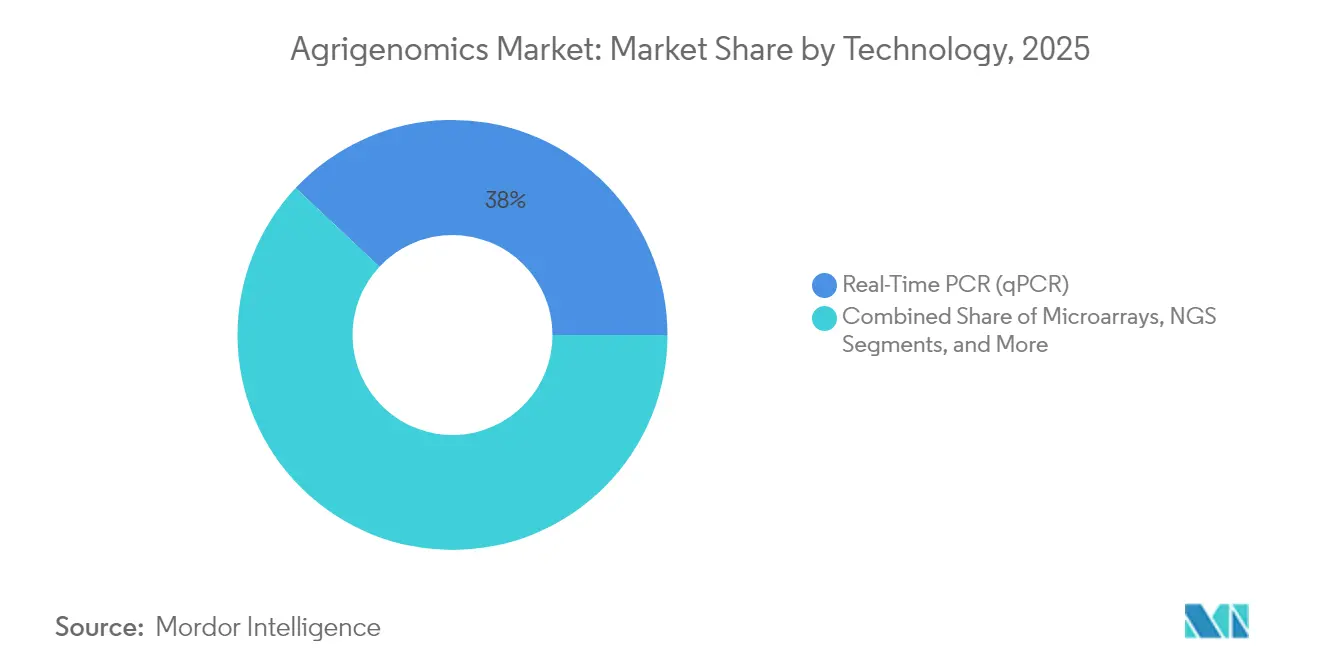
NGS Gains Momentum Despite qPCR DominanceReal-time PCR delivered 38.02% of 2025 revenue and remains the default for targeted assays, yet the segment’s share of the agrigenomics market is trending downward as breeders pursue richer variant catalogs. The agrigenomics market size tied to NGS platforms is projected to grow at a 12.22% CAGR, underpinned by investments in high-throughput sequencers, multiplexed barcoding, and single-tube library prep solutions. Constellation mapped-read workflows announced by Illumina promise structural-variant detection without traditional library construction. Oxford Nanopore’s ultra-long reads resolve telomere-to-telomere cereal genomes, aiding sub-QTL definition for drought resilience. Microarrays and capillary electrophoresis continue in germplasm banks for identity preservation, but their aggregate demand plateaus as full-genome data become cost-competitive.
NGS adoption accelerates because it couples readily with AI pipelines that demand dense variant matrices. Multi-omics add-ons—proteomics via Olink, methylomes via nanopore direct reading—convert raw sequences into functional insights. Instruments marketed as “pay-per-flowcell” reduce cash burn for mid-volume labs, while reagent rental deals lower barriers for emerging programs. As a result, “sequencing first” becomes standard in new crop improvement programs, and service providers report backlog spillovers into 2026, reinforcing the agrigenomics market’s shift from low-plex assays to comprehensive omics profiling.



By Application:
Livestock Genomics Accelerates Despite Crop DominanceCrops supplied 63.85% of revenue in 2025, reflecting decades of genomic selection in maize, soybean, and wheat. Still, livestock revenues are climbing at an 11.14% CAGR as producers capture measurable returns from genomic estimated breeding values. The agrigenomics market size for livestock is set to expand sharply once low-pass sequencing and imputation replace array-based genotyping across dairy, swine, and poultry herds. Approved PRRS-resistant pigs illustrate commercial value and regulatory feasibility in food animals.
Low-coverage WGS achieves perfect traceability sensitivity at just 5% genomic depth, making comprehensive variant discovery feasible for regional breeding centers. Long-read platforms uncover more than 10,000 structural variants in bovine genomes, enabling targeted edits that enhance feed efficiency without deleterious pleiotropy. Meanwhile, crop-focused pipelines integrate expression QTL and epigenomic marks to shorten selection cycles. Overall, livestock genomics is shifting from basic parentage testing to predictive selection for welfare, methane reduction, and disease elimination.
By Service Offering:
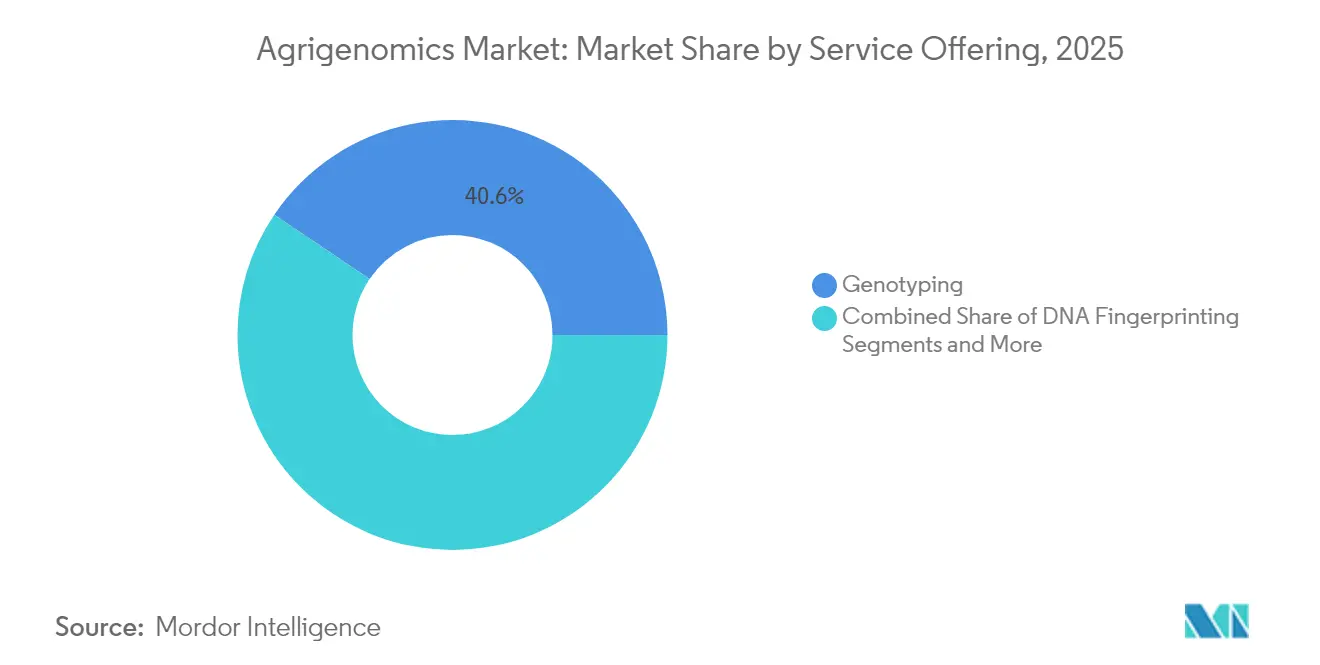
Gene Expression Analysis Drives InnovationGenotyping dominated 40.55% of 2025 revenues, yet gene-expression analysis is forecast at a 12.28% CAGR, becoming the fastest-growing value-add. Single-cell and spatial transcriptomics will unlock cell-type-specific networks underlying stress responses, guiding edits with higher precision. Illumina’s planned 2026 launch of spatial kits for non-model plants underscores industry commitment to multi-omic integration. Gene-expression data pairs with variant calls to build causal graphs that AI engines convert into actionable breeding targets, further expanding service-based demand in the agrigenomics market.
DNA fingerprinting and trait-purity testing remain regulatory staples, especially for seed-law compliance. Yet, clients increasingly purchase bundled packages that combine SNP calls, methylation states, and transcript abundance. Service providers pivot to subscription analytics, selling dashboards with continuous updates rather than single-point reports. As breeders grapple with data volume, vendors that package visualization, storage, and machine-learning inference gain stickiness, ensuring recurring revenue and deeper client engagement within the agrigenomics industry.
By Sequencer Type:
Long-Read Technologies Challenge Illumina LeadershipIllumina HiSeq and NovaSeq platforms still accounted for 35.22% of the agrigenomics market share in 2025, benefiting from broad reagent ecosystems and established workflows. PacBio HiFi and Oxford Nanopore devices are slated for 13.15% CAGR, propelled by demand for telomere-to-telomere assemblies, pan-genomes, and phased haplotypes. Portable MinION units enable field labs to run disease diagnostics at stockades or farm gates, shortening feedback loops for veterinarians.
PacBio’s circular consensus reads yield Q30 accuracy on 20 kb segments, unraveling polyploid complexity in wheat and canola. Illumina’s response involves linked-read simplification and Azure-hosted data processing to keep lock-in high. Investors now price sequencing decisions on total-insight value versus cost-per-base, tilting procurement models toward platforms that reduce downstream assembly and annotation expenditure. As more national projects build reference pangenomes, long-read adoption will spread beyond flagship institutes to seed companies aiming for competitive advantage in structural-variant-rich traits.
Geography Analysis
North America Agrigenomics Market
North America controlled 41.68% of revenue in 2025, reflecting deep genomics infrastructure, large-scale federal funding, and a regulatory environment that largely aligns with technology deployment. The agrigenomics market benefits from integrated ecosystems connecting USDA labs, land-grant universities, and private breeders. The joint EPA-FDA-USDA framework drafted in 2024 clarified oversight boundaries and added transparency for developers, easing time-to-market. Meanwhile, voluntary carbon-credit protocols reward yield gains and methane reductions enabled by genomic interventions, creating secondary revenue channels.
APAC Agrigenomics Market
Asia-Pacific represents the strongest growth engine at an 11.33% CAGR, supported by aggressive national roadmaps in China, India, and Australia. China’s 2024-2028 biotech blueprint positions genome editing as a pillar for food security and aims to localize entire toolchains from CRISPR nucleases to high-throughput phenotyping. India’s AgriSURE fund and digital crop survey rollout across 400 districts will push remote phenotyping and seed-tracking infrastructure to smallholders, feeding richer datasets into breeding programs. BGI’s throughput surpasses 50% of global sequencing capacity, making Shenzhen a global hub for pan-genome consortia in rice, banana, and rapeseed. As regional regulators increasingly differentiate between edits and transgenes, approval pipelines compress, lowering market-entry friction.
Europe, South America and Africa Agrigenomics Market
Europe posts steady incremental gains despite the EU’s stringent GMO regime. National divergence widens the UK’s Precision Breeding Act, simplifies approval procedures, whereas continental Europe continues to treat edits as GMOs, prolonging commercialization. South America sees resilient uptake: Brazil’s Bioinputs Law fosters biotech integration, and Argentina’s early-stage exemption model accelerates product launches. Africa shows latent demand but contends with infrastructure deficits and a chronic bioinformatics talent gap. Multilateral donors and commercial seed firms are piloting cloud-based genomics hubs to bridge the divide, a development likely to pull new participants into the agrigenomics market over the long term.


Regulatory Landscape
Agrigenomics is shaped by a patchwork of biotechnology, food, and environmental oversight that affects how genomic data, edited traits, and testing services move from laboratories into breeding and commercialization. In the European Union, Regulation (EU) 2026/1388 (approved in June 2026) established a dedicated framework for plants produced by certain new genomic techniques, using a classification-based oversight approach that separates NGT plants into distinct categories and compliance paths rather than routing all gene-edited outcomes through legacy GMO rules.
In the United States, USDA APHIS remains central to biotechnology product oversight, but the regulatory environment has been transitional following a federal district court decision in December 2024 that vacated parts of the 2020 SECURE rule. USDA APHIS subsequently issued a conforming final rule (effective June 16, 2025) and continued stakeholder engagement in 2026, including discussions of an interim rule concept to restore regulatory efficiency, leaving developers and service providers managing documentation and review under revised interpretations while tracking updates across EPA-FDA-USDA roles.
Competitive Landscape
The agrigenomics market remains moderately fragmented, with the top five players collectively holding nearly 60% of revenue. Illumina and Thermo Fisher form the core of the hardware stack, using acquisitions to reach new omics territories: Illumina closed its USD 3.1 billion Olink deal to integrate large-scale proteomic screens, while Thermo Fisher’s multi-billion-dollar pipeline targets consumables and automation niches. Long-read challengers PacBio and Oxford Nanopore capture mindshare in structural-variant-heavy applications, negotiating strategic supply agreements with seed majors.
Partnership networks expand rapidly. Eurofins Genomics Agrigenomics has partnered with Agrigenetix to expand its genotyping services across the Asia-Pacific region, leveraging local expertise to improve access to advanced agrigenomics tools. Bayer is linked with Source.ag to integrate greenhouse sensor data into genomics-driven vegetable pipelines, highlighting convergence between controlled-environment agriculture and molecular breeding. Google-backed Heritable Agriculture and venture-funded Inari bring AI and multiplexed editing into competition, often via asset-light “platform licensing” models that threaten incumbents’ consumables revenue.
Smaller service labs differentiate through turnkey analytics. Cloud pipelines coupled with on-demand wet-lab nodes appeal to cooperatives that lack capital for reactors and GPUs. In South America and Southeast Asia, regional startups bundle local regulatory services with genomics, easing entry for multinationals. Over the next five years, success will hinge on delivering integrated, value-chain-spanning solutions rather than siloed assays, a shift anticipated to push further consolidation as hardware vendors acquire software and data-science specialists to secure stickier ecosystems.
Agrigenomics Industry Leaders
Eurofins Scientific SE
Illumina Inc.
Thermo Fisher Scientific Inc.
Agilent Technologies Inc.
QIAGEN N.V.
- *Disclaimer: Major Players sorted in no particular order
Agrigenomics Market Companies Covered in this Report
- Illumina Inc.
- Thermo Fisher Scientific Inc.
- Eurofins Scientific SE
- Agilent Technologies Inc.
- BGI Genomics Co. Ltd.
- QIAGEN N.V.
- Pacific Biosciences of California Inc.
- Tecan Genomics Inc.
- Astorg and Cinven (LGC Limited)
- KeyGene N.V.
- Azenta Life Sciences (Genewiz)
- BASF SE (DNA LandMarks Inc.)

Market Opportunities and Future Outlook
Clearer rules for gene-edited plants and national biotechnology policies are expanding practical use cases for agrigenomics services beyond discovery into deployment, creating room for providers that package compliant testing, traceability, and analytics. The EU advanced the NGT dossier as the Council adopted a position at first reading in April 2026, and Regulation (EU) 2026/1388 followed in June 2026, which is lifting demand for laboratories that can support variety characterization, identity preservation, and category-specific documentation across seed markets that operate pan-regionally.
Public programs and sustainability-linked breeding targets are also pulling agrigenomics toward integrated genotype-to-phenotype pipelines, favoring vendors that combine wet-lab throughput with bioinformatics and decision tools. USDA ARS National Program 301 (2023-2027) explicitly emphasizes integrating genomics, metabolomics, and phenomics for crop improvement, while Australia’s Zero Net Emissions Agriculture CRC is running a low-emissions grasses project with Barenbrug that uses gene editing and pasture breeding to reduce methane intensity. On the methods side, 2026 publications highlighting pangenome-based structural variant imputation in dairy cattle and genomic selection implementation strategies in public soybean breeding point to growing standardization of large-scale analytics workflows, supporting service models built around multi-omics, pangenomes, and repeatable selection pipelines rather than one-off genotyping.
Recent Industry Developments in Agrigenomics Market
- June 2026: Eurofins Agro Testing completed the acquisition of Laboratoř Postoloprty in the Czech Republic. The deal broadens Eurofins presence in Central Europe and adds capabilities aligned with precision agriculture workflows such as GPS-guided soil sampling and drone-enabled field data capture that can feed into genomics and trait services.
- April 2026: Eurofins Agro Testing Spain closed the acquisition of CSR Laboratorio. The transaction expands local laboratory capacity and service coverage in Spain, helping shorten turnaround times for agricultural testing customers who increasingly bundle molecular and lab-based verification into breeding and production decisions.
- September 2024: Illumina and LGC Biosearch Technologies announced a collaboration to pair Amp-Seq workflow elements with Illumina chemistry for agricultural researchers in Asia-Pacific and South America. The partnership strengthens access to standardized genotyping and targeted sequencing workflows in two high-activity regions, supporting scale-up of breeding programs and service lab offerings.


Agrigenomics Market Report Scope and Research Methodology
Market Definition and Coverage
This market covers revenue earned from agrigenomics testing and analysis used in agriculture, mainly genomics and related bioinformatics services that support crop and livestock improvement programs.
Scope exclusions: We exclude stand-alone genomics work that is not tied to agricultural use, and we do not count sequencing instrument sales unless they are bundled inside an agrigenomics service contract.
Segments Covered in This Report
- By Technology
- Real-Time PCR (qPCR)
- Microarrays
- Next-Generation Sequencing (NGS)
- Capillary Electrophoresis
- Other Technologies (CRISPR-based assays, Digital PCR, etc.)
- By Sequencer Type
- Illumina HiSeq and NovaSeq
- PacBio and Oxford Nanopore
- Sanger Sequencers
- SOLiD
- Others (Ion Proton, GeneMind GenoLab M, etc.)
- By Application
- Crops
- Livestock
- By Service Offering
- Genotyping
- DNA Fingerprinting
- Genetic Purity Assessment
- Trait Purity Assessment
- Gene Expression Analysis
- By Geography
- North America
- United States
- Canada
- Mexico
- Rest of North America
- South America
- Brazil
- Argentina
- Chile
- Rest of South America
- Europe
- Germany
- United Kingdom
- France
- Italy
- Spain
- Netherlands
- Rest of Europe
- Asia-Pacific
- China
- Japan
- India
- Australia
- New Zealand
- Rest of Asia-Pacific
- Middle East
- Turkey
- Saudi Arabia
- United Arab Emirates
- Rest of Middle East
- Africa
- South Africa
- Egypt
- Kenya
- Rest of Africa
- North America
Data Sources, Market Sizing, and Validation
Desk Research
Desk research helped us set the boundary for what gets counted as agrigenomics revenue and what sits outside it, and it also provided the anchor trends used for the forecast. Public datasets were used to understand agriculture R and D activity, crop and livestock breeding intensity, and lab testing demand signals that move with planting and breeding cycles.
Sources referenced include materials such as USDA and NASS releases, FAOSTAT production and livestock series, OECD agriculture and biotechnology indicators, patent and publication repositories such as Google Patents and PubMed, and regulatory or guidance material from bodies such as the USDA and EFSA when relevant to trait testing. We also reviewed company annual reports, investor presentations, association pages, and reputable press coverage, and then cross-checked financial and funding signals using paid subscriptions for company financials, news, and patents. The sources listed here are illustrative, and many other public and paid references were used for collection, validation, and clarification.
Primary Interviews and Surveys
Primary work focused on confirming what gets billed in agrigenomics projects, how prices move by test type, and where demand is shifting between crops and livestock. We spoke with a mix of service providers, labs, breeders, and downstream users across APAC, EMEA, and the Americas so that adoption and pricing assumptions could be checked against real buying and tendering behavior.
Distribution of primary research fieldwork respondents
| Company type | Respondent position | Region |
|---|---|---|
| Top tier: 37% | CXOs: 13% | APAC: 45% |
| Mid tier: 48% | Functional/Unit leaders: 39% | EMEA: 32% |
| Smaller Players: 15% | Managers: 48% | Americas: 23% |
Market-Sizing & Forecasting
The core sizing uses a top-down build where agriculture testing spend is reconstructed from the demand pool for breeding and trait development, and then translated into agrigenomics revenues using penetration and mix assumptions. To keep the totals realistic, the output is corroborated with selective bottom-up approximations, such as sampled price-per-sample levels times estimated sample volumes and a limited roll-up of service revenue ranges for major labs and providers.
Key inputs used in the model include the share of breeding programs using DNA-based tests, the mix between sequencing, genotyping, and marker-assisted workflows, typical sample throughput patterns across seasons, average selling price movement by test complexity, and adoption of bioinformatics services per project. Where coverage is thin in smaller geographies, gaps are handled using proxy indicators like crop area and livestock headcount weighted by interview feedback on testing intensity, and then normalized to avoid over-counting adjacent genomics services.
For forecasting, scenario analysis is used, tied to a small set of drivers that can be refreshed each year, such as agriculture R and D budgets, breeding intensity indicators, and technology mix shifts validated through expert calls. The final forecast is adjusted after cross-checking regional growth expectations with on-the-ground views of commercialization timelines and lab capacity.
Data Validation & Update Cycle
Estimates are validated through triangulation across independent signals, and then followed by variance checks at regional and application levels so unusually high growth or pricing does not slip into the final model. When an anomaly is found, the underlying driver is rechecked, and assumptions are revisited through follow-up calls or by revisiting public series until the story matches what the market can realistically absorb.
Before sign-off, the model and outputs go through multiple analyst reviews, including consistency checks between historical trend lines and forecast drivers. The report is refreshed annually, and interim updates are made when material events occur, such as large funding shifts, major regulatory changes, or demand shocks. Right before delivery, a fresh update pass is done so clients receive the most current view available.
Mordor Intelligence's Agrigenomics Market Estimate Compared With Other Published Estimates
Published estimates for agrigenomics often differ because the boundary between services and instruments is not treated the same way, and because pricing and volume assumptions are updated on different schedules. In this market, even a small change in what is counted as service revenue can move the total by a noticeable amount.
Key gaps usually come from whether stand-alone sequencing hardware is included, how crop versus livestock testing mix is split, and whether bioinformatics and consulting fees are counted as part of the market or left out. Currency conversion timing and the choice of a base year also matter, especially when reported sizes are shown for different years and then compared without normalizing.
Benchmark comparison
| Source | Market Size | Gaps in Research Methodology |
|---|---|---|
| Mordor Intelligence | USD 5.49 B (2026) | |
| Global Consultancy A | USD 5.00 B (2025) | Uses a different base year and appears to treat the service scope more broadly, which can blend agrigenomics testing with adjacent genomics activity without a clear service-only boundary. |
| Industry Publisher B | USD 4.82 B (2025) | Definition detail is limited in the public summary, and the smaller number is consistent with more conservative penetration and pricing assumptions, plus potential exclusion of bundled bioinformatics and consulting fees. |
Independent checks like reported service revenues from agricultural testing activities and observed pricing per sample in common genotyping workflows are what keep Mordor Intelligence tied to a service-led demand pool rather than instrument ownership. After normalizing the year and scope differences, the spread becomes easier to explain, since most of it comes from boundary choices and how quickly pricing and adoption assumptions are refreshed.


Key Questions Answered in the Report
What is the current value of the agrigenomics market?
The agrigenomics market is valued at USD 5.49 billion in 2026 and is projected to reach USD 8.74 billion by 2031.
Which technology segment is growing fastest?
Next-Generation Sequencing is expanding at a 12.22% CAGR, outpacing Real-Time PCR as costs decline and data depth rises.
Why is Asia-Pacific the most attractive growth region?
Government roadmaps in China and India, large-scale sequencing capacity, and supportive regulatory shifts fuel an 11.33% CAGR for the region.
How are AI platforms influencing agrigenomics?
AI tools shorten breeding cycles by predicting genotype-to-phenotype links, improving selection accuracy and reducing field-trial costs.
Page last updated on:





