Molecular Breeding Market Size and Share
Market Overview
| Study Period | 2021 - 2031 |
|---|---|
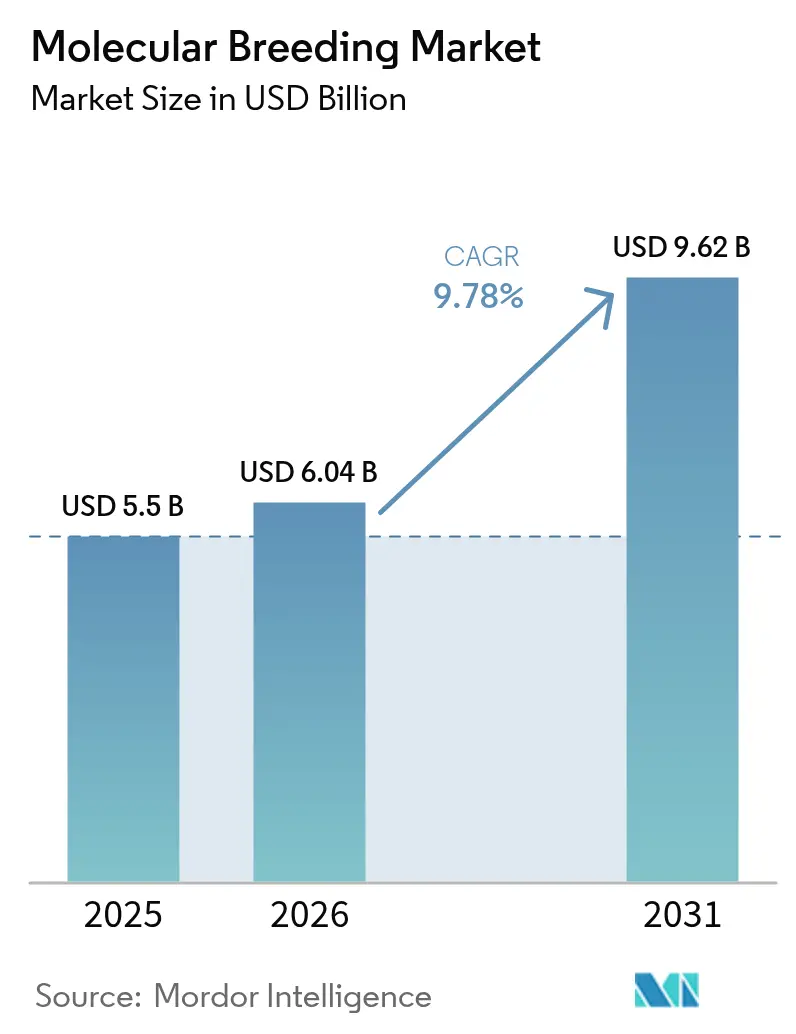
| Market Size (2026) | USD 6.04 Billion |
| Market Size (2031) | USD 9.62 Billion |
| Growth Rate (2026 - 2031) | 9.78% CAGR |
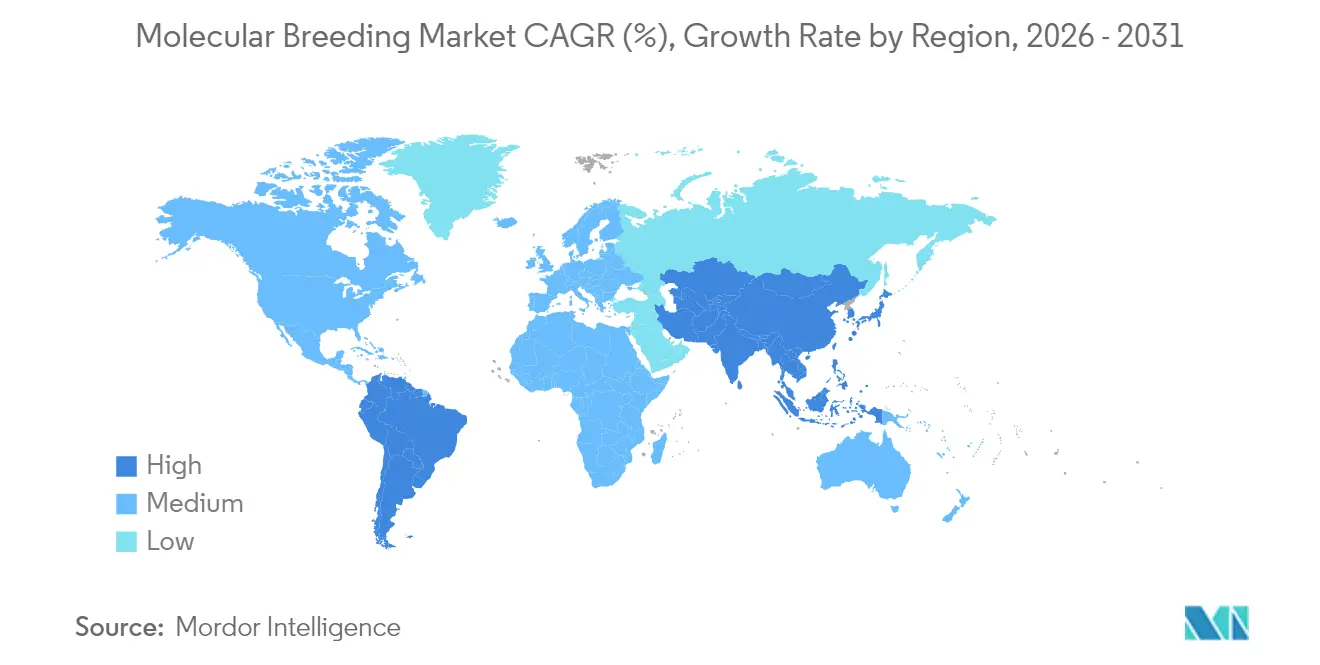
| Fastest Growing Market | Asia Pacific |
| Largest Market | North America |
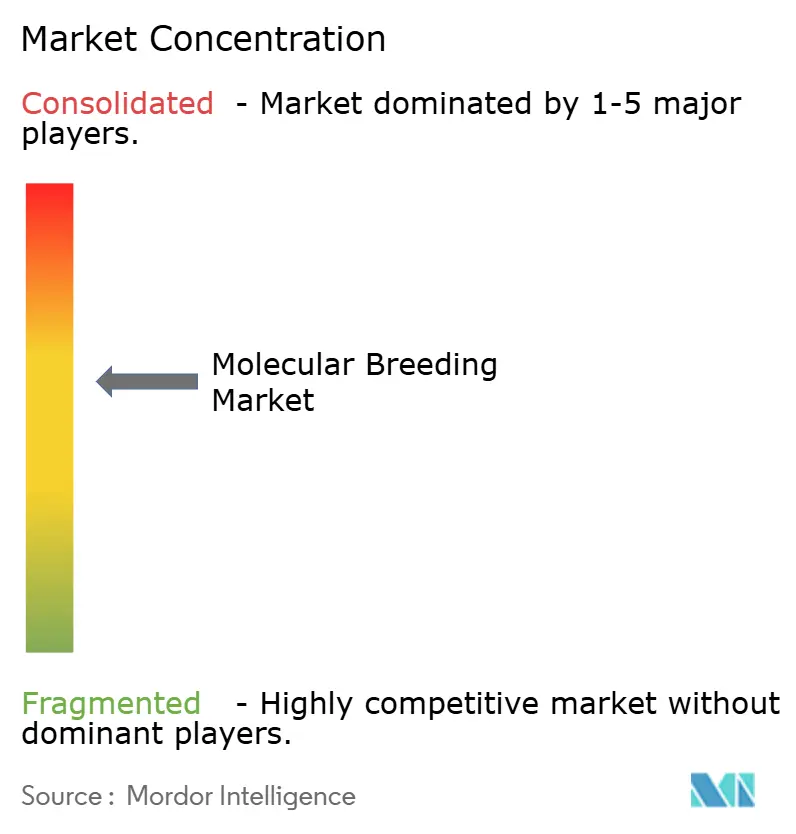
| Market Concentration | Medium |
Major Players *Disclaimer: Major Players sorted in no particular order Image © Mordor Intelligence. Reuse requires attribution under CC BY 4.0. | |
Molecular Breeding Market Analysis by Mordor Intelligence
The molecular breeding market size was valued at USD 5.5 billion in 2025 and estimated to grow from USD 6.04 billion in 2026 to reach USD 9.62 billion by 2031, at a CAGR of 9.78% during the forecast period (2026-2031). The incorporation of artificial intelligence with genomic selection has reduced breeding cycles from years to months, enhancing product development efficiency. Government initiatives, including the U.S. Vision for Adapted Crops and Soils and India's National Action Plan on Food Security, are driving demand for climate-resilient crop varieties. Market expansion is facilitated by high-throughput phenotyping, decreased sequencing costs, and accessible genotyping services. While North America retains its advantage in research infrastructure, the Asia-Pacific region demonstrates substantial growth potential due to regulatory reforms and food security requirements.
Key Report Takeaways
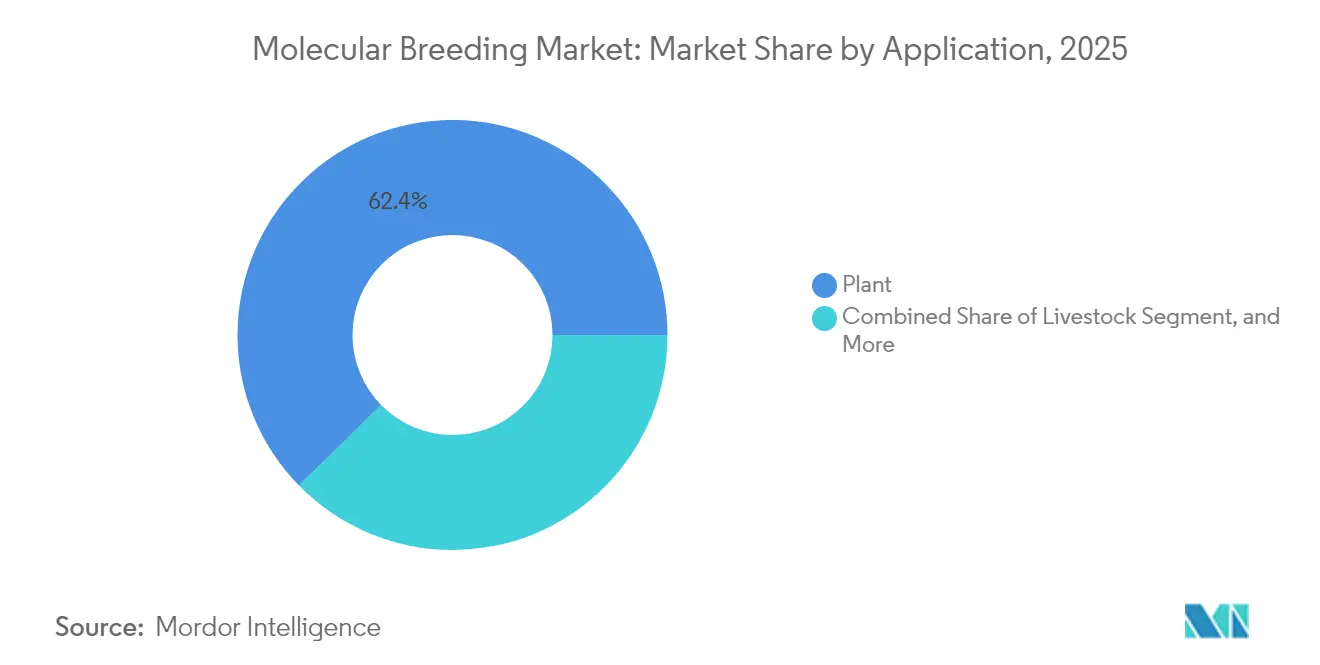
- By application, plant breeding dominated with 62.35% of the molecular breeding market share in 2025; livestock breeding is projected to grow at a 12.64% CAGR through 2031.
- By marker type, SNP technology represented 41.55% of the molecular breeding market size in 2025 and is anticipated to grow at a 12.85% CAGR.
- By breeding process, marker-assisted selection comprised 50.35% of the molecular breeding market size in 2025, while genomic selection is growing at a 15.35% CAGR.
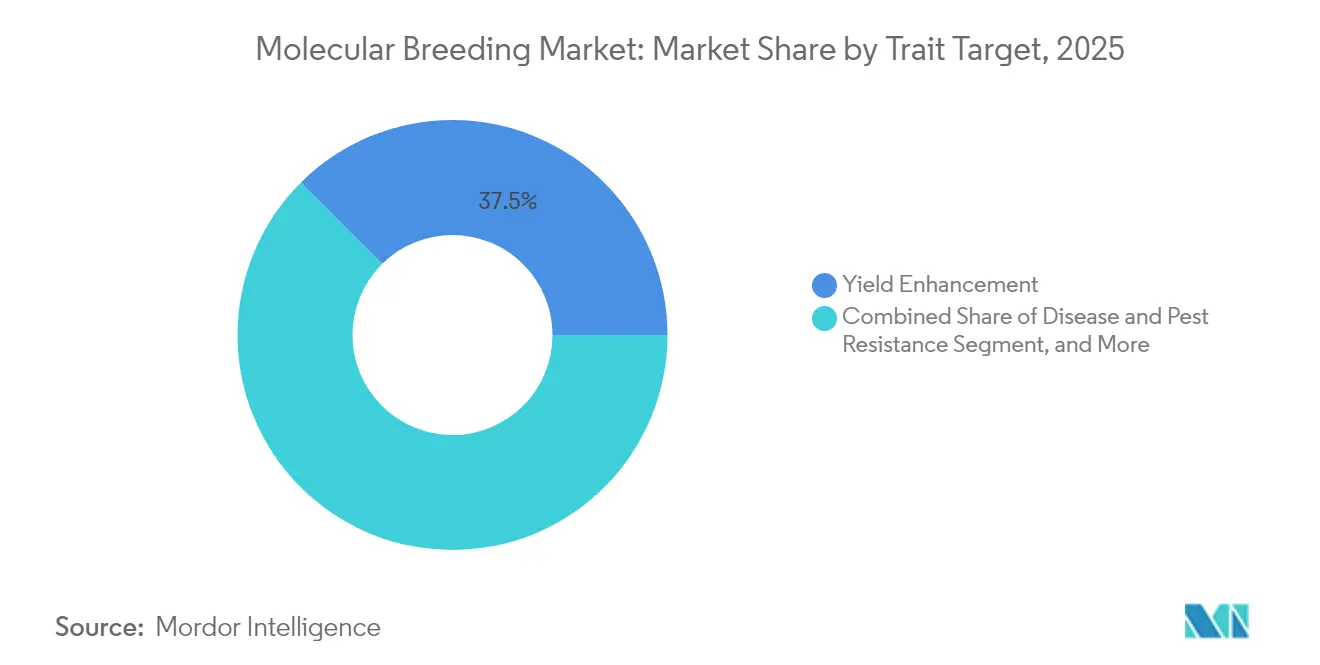
- By trait target, yield enhancement led with 37.45% revenue share in 2025; abiotic stress tolerance is projected to grow at a 11.72% CAGR through 2031.
- By end-user, seed and crop-protection companies held 51.25% revenue share in 2025; independent breeding service providers grew at a 12.58% CAGR through 2031.
- By geography, North America held a 35.55% share of the molecular breeding market in 2025, while Asia-Pacific will grow at a 11.45% CAGR through 2031.
- Major Players, Illumina Inc., Thermo Fisher Scientific, and LGC Limited (Cinven) together held 39.70% of the market share in 2025.
Note: Market size and forecast figures in this report are generated using Mordor Intelligence’s proprietary estimation framework, updated with the latest available data and insights as of 2026.
Global Molecular Breeding Market Trends and Insights
Drivers Impact Analysis*
| Driver | (~) % Impact on CAGR Forecast | Geographic Relevance | Impact Timeline |
|---|---|---|---|
| Expanding biotechnology research and development funding | +2.8% | North America and Europe | Medium term (2-4 years) |
| Growing demand for high-yield, climate-resilient crops | +2.5% | Asia-Pacific and Africa | Long term (≥ 4 years) |
| Rapid adoption of precision breeding and phenotyping platforms | +2.2% | North America and Europe | Short term (≤ 2 years) |
| Government-backed food-security initiatives | +1.8% | Developing economies | Medium term (2-4 years) |
| Convergence of AI and genomic selection | +1.4% | North America, Europe, China | Short term (≤ 2 years) |
| Carbon-credit incentives for low-input cultivars | +0.9% | Europe and North America | Long term (≥ 4 years) |
| Source: Mordor Intelligence | |||
Expanding Biotechnology Research and Development Funding
Private and public spending in the market is increasing rapidly. Thermo Fisher invested USD 1.3 billion in research and development in 2023 to advance next-generation sequencing and reagent innovation, reducing entry costs for midsized breeders. The U.S. Department of Agriculture's data-standards programs are harmonizing genomic datasets, preventing redundant trials, and reducing time-to-market. These capital investments have decreased compliance barriers for smaller firms, enabling novel trait developers to navigate regulatory requirements. Additionally, multilateral initiatives, such as CGIAR's USD 400 million nutrition-focused portfolio, are attracting donor funds and accelerating biofortification outcomes.
Growing Demand for High-Yield, Climate-Resilient Crops
India's release of 100-day wheat varieties capable of withstanding record temperatures has enabled heat- and drought-tolerant genotypes to advance from pilot to commercial scale. Japanese research centers are developing quinoa and soybean varieties adapted to saline and water-stress conditions to maintain production levels in climate-vulnerable countries. Plant breeding priorities now extend beyond yield optimization to include multistress tolerance, necessitating the use of multiplexed molecular markers that integrate productivity with environmental resilience. The financial implications are significant, as extreme weather events currently cause crop losses worth billions of USD per season, increasing the return on investment for climate-resilient seed portfolios.
Rapid Adoption of Precision Breeding and Phenotyping Platforms
High-throughput imaging and sensor systems enable non-destructive trait measurement and, combined with machine learning, allow breeders to conduct multiple crop generations annually in controlled environments. Syngenta laboratories integrates AI to optimize molecular design and bioassay cycles for seeds and crop-protection molecules, reducing development timelines significantly. The emergence of phenomics-as-a-service models provides regional breeders with limited capital access to these technologies, driving market adoption.
Government-Backed Food Security Initiatives
Programs such as India's National Food Security Mission provide substantial grants for breeder seed multiplication, ensuring rapid adoption of molecular-bred cultivars.[1]National Food Security Mission, “Allocations 2024-25,” nfsm.gov.in Australia's regional partnerships offer grants and technical training on climate-ready varieties across the Indo-Pacific, converting policy commitments into commercial demand. USDA grants for sweet-potato research in Pacific Island nations demonstrate how dedicated budgets reduce local research and development risks while addressing nutrition gaps.
Restraints Impact Analysis*
| Restraint | (~) % Impact on CAGR Forecast | Geographic Relevance | Impact Timeline |
|---|---|---|---|
| Stringent, slow-moving regulatory approvals | −1.8% | Europe | Long term (≥ 4 years) |
| High capital cost of sequencing and genotyping infrastructure | −1.2% | Developing economies | Medium term (2-4 years) |
| Limited breeder access to interoperable data platforms | −0.9% | Global | Medium term (2-4 years) |
| Public perception concerns over “molecular‐modified” seeds | −0.7% | Europe and parts of Asia | Long term (≥ 4 years) |
| Source: Mordor Intelligence | |||
Stringent, Slow-Moving Regulatory Approvals
The compliance cost per new trait can reach USD 15 million, consuming approximately half of the total development budgets and deterring smaller innovators. The European Union's regulation of gene-edited crops under GMO legislation drives companies to focus on markets with favorable regulations, such as the United States and Brazil. While Argentina, Uruguay, and Thailand updated their regulations in 2024 to simplify approvals, regulatory uncertainty continues to extend timelines and increase financing costs.
High Capital Cost of Sequencing and Genotyping Infrastructure
Sequencers and high-density SNP arrays remain cost-prohibitive for many public institutes. In several low-income economies, biosafety compliance costs exceed national breeding-program budgets, reinforcing reliance on imported germplasm. Shared facilities and contract-genotyping models are emerging, but their availability remains limited outside major research hubs.
*Our forecasts treat driver/restraint impacts as directional, not additive. The impact forecasts reflect baseline growth, mix effects, and variable interactions.
Segment Analysis
By Application: Livestock Segment Accelerates Despite Plant Dominance
Plant applications accounted for 62.35% of the molecular breeding market in 2025, primarily through genomic selection implementation in maize, wheat, and soybean breeding programs. The livestock segment is experiencing growth at a 12.64% CAGR, driven by genomic breeding values that demonstrate superior performance compared to traditional estimates in dairy cattle and CRISPR-based disease-resistant pig development. Tools such as Angus SteerSELECT have demonstrated prediction accuracies exceeding 0.72 for critical carcass traits, enhancing feedlot profitability and attracting investment.
The poultry sector is implementing precision editing of fertility and growth genes to reduce generation intervals. Furthermore, integrated metabolomic and genomic models in swine breeding demonstrate potential for improving average daily gain, despite current modest outcomes. These developments indicate that the livestock segment may substantially increase its contribution to the molecular breeding market by 2031.


By Marker Type: SNP Technology Dominates Through Superior Precision
Single nucleotide polymorphisms (SNPs) accounted for 41.55% of the molecular breeding market size in 2025 and maintain a 12.85% CAGR due to their compatibility with high-throughput platforms and enhanced genome-wide association outputs. The reduction in unit costs has diminished the price advantage previously held by simple sequence repeats, prompting developing-country programs to adopt SNP solutions directly. The implementation of functional-variant panels from RNA-seq and ATAC-seq data has improved breeding accuracies by 3 percentage points in dairy-protein traits, demonstrating the technology's reliability.
The standardization of SNP workflows has positioned express sequence tags and other traditional markers primarily in specialized applications such as expression profiling. The increased adoption of SNPs enhances data interoperability, which is fundamental for developing AI-enabled breeding systems.
By Breeding Process: Genomic Selection Revolutionizes Traditional Methods
Marker-assisted selection maintains a 50.35% revenue share in 2025, demonstrating its established effectiveness for single-gene traits. Genomic selection exhibits robust growth with a 15.35% CAGR, attributed to its capabilities in managing complex traits such as drought tolerance and nutrient-use efficiency. Companies such as Benson Hill integrate genomic selection with speed-breeding protocols to generate multiple soybean generations annually, reducing product development timelines.
Quantitative trait-loci mapping and marker-assisted back-crossing maintain their significance where trait architecture is well-defined, although their growth rate is moderating. The integration of machine learning with genomic selection is projected to enhance performance differentials, establishing it as the primary methodology in commercial breeding programs.
By Trait Target: Abiotic Stress Tolerance Gains Prominence
Yield enhancement maintained its dominant position at 37.45% market share in 2025, while abiotic-stress tolerance emerged as the fastest-growing segment with a 11.72% CAGR. The development of extreme-weather resilience and soil salinity tolerance has become a strategic priority in breeding programs, as evidenced by India's development of heat-resistant wheat varieties and China's salt-tolerant rice prototypes. Disease and pest resistance continues to generate sustained demand, driven by the transition toward biological control methods to reduce chemical inputs. Furthermore, micronutrient biofortification is experiencing increased consumer interest.
Modern breeding programs are integrating multiple traits - combining yield enhancement, stress tolerance, and nutritional improvements within single varieties. This integration utilizes advanced techniques such as multiplexed CRISPR editing and polygenic scoring to minimize trait trade-offs, establishing new standards for product differentiation.
By End-User: Independent Providers Challenge Traditional Dominance
Seed and crop-protection companies maintain 51.25% of spending in 2025 through established distribution networks and comprehensive IP portfolios. Independent breeding service providers demonstrate growth at 12.58% CAGR, delivering contract genotyping, AI analytics, and trait-discovery services to regional seed firms. Livestock genetics companies increase investments as genomic evaluation systems advance.
Academic and government institutes maintain their essential role in pre-competitive research, though commercial limitations affect their direct revenue share. Market consolidation persists as agribusinesses acquire biotech firms to obtain proprietary algorithms and marker panels, reflecting the strategic importance of data-driven capabilities.
Geography Analysis
North America holds 35.55% of the molecular breeding market share in 2025, supported by advanced research infrastructure and efficient regulatory frameworks. Illumina reported USD 4.33 billion revenue in 2024 and has partnered with LGC Biosearch Technologies to increase targeted genotyping-by-sequencing capabilities for row-crop and livestock segments. The USDA's SECURE rule streamlines the approval process for gene-edited products, maintaining the region's market leadership.
Asia-Pacific demonstrates the highest growth potential with a projected 11.45% CAGR through 2031. China approved disease-resistant gene-edited wheat in 2024, while India's regulatory updates streamline approvals for specific genome edits, accelerating private breeding initiatives. Japan's tiered regulatory system and focus on crop-stress research establishes it as a key regional hub. The combination of government funding and private venture capital is strengthening the region's breeding infrastructure to address food security needs.
Europe maintains significant market presence despite regulatory constraints. The EU Environment Committee's approval of new genomic technology legislation in late 2024 indicates movement toward risk-based assessment. The UK implemented the Precision Breeding Act, establishing a two-tier safety review system to expedite gene-edited crop trials. Switzerland is implementing similar regulatory changes. Market growth depends on policy developments, with substantial demand for varieties meeting European Green Deal sustainability requirements.

Competitive Landscape
The molecular breeding market demonstrates moderate concentration, with the top five sequencing providers - Illumina Inc., Thermo Fisher Scientific, LGC Limited (Cinven), Eurofins Scientific, and SGS SA - accounting for 40.1% of revenue share in 2024. Research and development investments function as a primary strategic tool, as evidenced by Thermo Fisher's USD 1.3 billion budget in 2023 for platform innovations to reduce the cost per datapoint.
Strategic partnerships are expanding in the market. Illumina's collaboration with LGC integrates Amp-Seq protocols with high-throughput sequencing for cost-efficient marker panels. Bayer maintains an innovation pipeline valued at USD 37.1 billion (EUR 32 billion) in peak sales, incorporating artificial intelligence, gene editing, and herbicide-tolerance stacks. Syngenta implements machine learning across its processes, from molecular design to greenhouse validation, to optimize efficiency.
Specialized companies such as Pairwise and MolBreeding Biotech concentrate on specific innovations, such as CRISPR berries and Genotyping-by-Targeted-Sequencing, establishing market niches despite the presence of large companies. The increasing requirement for data in AI applications has established proprietary multi-omics datasets as a competitive advantage, leading to an increase in data-focused acquisitions.
Molecular Breeding Industry Leaders
Illumina, Inc.
Thermo Fisher Scientific Inc.
LGC Limited (Cinven )
Eurofins Scientific
SGS SA
- *Disclaimer: Major Players sorted in no particular order

Recent Industry Developments
- March 2025: Bayer introduced Vyconic soybeans with five-herbicide tolerance, targeting full U.S. and Canadian launches by the 2027 planting season.
- January 2025: Illumina, Inc. posted preliminary 2024 revenue of USD 4.3 billion and reaffirmed its focus on agricultural genomics post-GRAIL divestiture.
- September 2024: Illumina, Inc. and LGC Limited announced a strategic partnership for agricultural genotyping-by-sequencing.
- June 2024: Bayer AG unveiled a 10-product innovation pipeline featuring Preceon Smart Corn and multi-trait soybean platforms.


Research Methodology Framework and Report Scope
Market Definitions and Key Coverage
Our study defines the molecular breeding market as all revenues earned from reagents, consumables, instruments, and service contracts that enable breeders to pinpoint DNA markers and then select, cross, or backcross plants or livestock so the desired genetic traits are fixed in the next generation. This remit covers marker-assisted selection, genomic selection, QTL mapping, marker-assisted backcrossing, and the analytics that guide each step, which, according to Mordor Intelligence, together generated about USD 5.5 billion in 2025.
Scope Exclusion: We exclude pure gene-editing inputs, generic sequencing services sold outside breeding programs, and broad bioinformatics platforms used only for discovery work.
Segmentation Overview
- By Application
- Plant
- Livestock
- Other Application
- By Marker Type
- Simple Sequence Repeats (SSR)
- Single Nucleotide Polymorphisms (SNP)
- Expressed Sequence Tags (EST)
- Other Markers
- By Breeding Process
- Marker-Assisted Selection (MAS)
- Quantitative Trait Loci (QTL) Mapping
- Marker-Assisted Back-Crossing
- Genomic Selection
- By Trait Target
- Yield Enhancement
- Disease and Pest Resistance
- Abiotic Stress Tolerance
- Quality and Nutritional Traits
- By End-User
- Seed and Crop-Protection Companies
- Livestock Breeding Firms
- Academic and Government Research Institutes
- Independent Breeding Service Providers
- By Geography
- North America
- United States
- Canada
- Mexico
- Rest of North America
- Europe
- Germany
- United Kingdom
- France
- Russia
- Spain
- Rest of Europe
- Asia-Pacific
- China
- Japan
- India
- South Korea
- Rest of Asia-Pacific
- South America
- Brazil
- Argentina
- Rest of South America
- Middle East
- Saudi Arabia
- United Arab Emirates
- Turkey
- Rest of Middle East
- Africa
- South Africa
- Nigeria
- Rest of Africa
- North America
Detailed Research Methodology and Data Validation
Primary Research
Mordor analysts interview seed producers, animal genetics houses, sequencing platform vendors, and public breeders across North America, Europe, Asia Pacific, and Latin America. The conversations validate adoption rates, average marker screens per line, and typical service pricing, while short online surveys with crop consultants refine regional cost assumptions.
Desk Research
We begin with foundational statistics from open sources such as the Food and Agriculture Organization, USDA, Eurostat, the International Livestock Research Institute, and patent filings that reveal marker activity trends. Industry trade groups, for example, the International Seed Federation, supply seed sales and breeding pipeline counts that we layer into our datasets. Next, we pull granular company and shipment intelligence from D&B Hoovers, Dow Jones Factiva, and Volza to benchmark leading breeders' spend on genotyping. Agricultural grant disclosures and peer-reviewed journals help us capture emerging trait targets. These named sources illustrate the mix; many additional references inform data checks and narrative clarity.
Market-Sizing & Forecasting
A top-down demand pool is first established by mapping the number of active crop and animal breeding programs and multiplying that by weighted marker screens per program, which are then valued with region-specific average service prices. Selective bottom-up roll-ups of publicly reported genotyping volumes act as a cross-check and help us adjust outliers. Key variables include arable land under commercial breeding, sequencing cost per sample, breeder R&D spend, trait release cadence, and policy incentives for stress-tolerant varieties.
We forecast through multivariate regression that links sample volumes to population growth, farm income, and sequencing price curves. Scenario analysis tests the impact of subsidy changes or technology breakthroughs. Gaps in bottom-up evidence are bridged with conservative proxies agreed upon during expert calls.
Data Validation & Update Cycle
Every dataset moves through variance screening, peer review, and a final sign-off. When quarterly earnings, technology cost shocks, or regulatory shifts create material variance, an interim refresh is triggered; otherwise, we update annually so clients receive the latest view.
Why Mordor's Molecular Breeding Baseline Commands Reliability
Published estimates often differ because providers pick unlike segment boundaries, cost assumptions, and refresh schedules. We acknowledge these moving pieces upfront and then anchor our baseline to the measurable flow of marker screens that directly generate revenue.
Key gap drivers are scope stretch into broader plant-breeding services, omission of livestock workflows, aggressive or conservative price decks, and currency conversions frozen at outdated rates. Our disciplined variable tracking and yearly updates reduce such drift.
Benchmark comparison
| Market Size | Anonymized source | Primary gap driver |
|---|---|---|
| USD 5.5 B (2025) | Mordor Intelligence | - |
| USD 8.12 B (2024) | Global Consultancy A | Includes gene-editing platforms and seed royalty streams, uses single global ASP |
| USD 3.91 B (2023) | Trade Journal B | Excludes livestock breeding and counts only five crop groups; limited regional coverage |
| USD 8.91 B (2025) | Industry Association C | Measures total plant-breeding and CRISPR services, not just molecular workflows |
In sum, the Mordor approach delivers a balanced midpoint grounded in transparent variables and repeatable steps, giving decision-makers a dependable baseline while still flagging the plausible upside and downside boundaries.


Key Questions Answered in the Report
What is the current size of the molecular breeding market?
The molecular breeding market was valued at USD 6.04 billion in 2026 and is forecast to reach USD 9.62 billion by 2031.
Which region is growing the fastest?
Asia-Pacific is anticipated to post a 11.45% CAGR through 2031, propelled by regulatory reforms in China and India that speed up gene-edited crop approvals.
Why are SNP markers so dominant?
SNPs combine high precision with compatibility for high-throughput sequencing, giving them 41.55% share of 2025 revenues and a 12.85% growth trajectory.
How is AI impacting breeding timelines?
AI-enabled genomic selection has shortened breeding cycles from five years to as little as four months, significantly accelerating product launches.
What restrains wider technology adoption?
High regulatory compliance costs and capital-intensive sequencing infrastructure remain key barriers, particularly for smaller firms and developing-country programs.
Which traits are attracting the most investment?
Yield enhancement remains lucrative, but abiotic stress tolerance is the fastest-growing trait focus as climate resilience becomes a commercial imperative.
Page last updated on:


