Bonsai Market Size and Share
Market Overview
| Study Period | 2021 - 2031 |
|---|---|
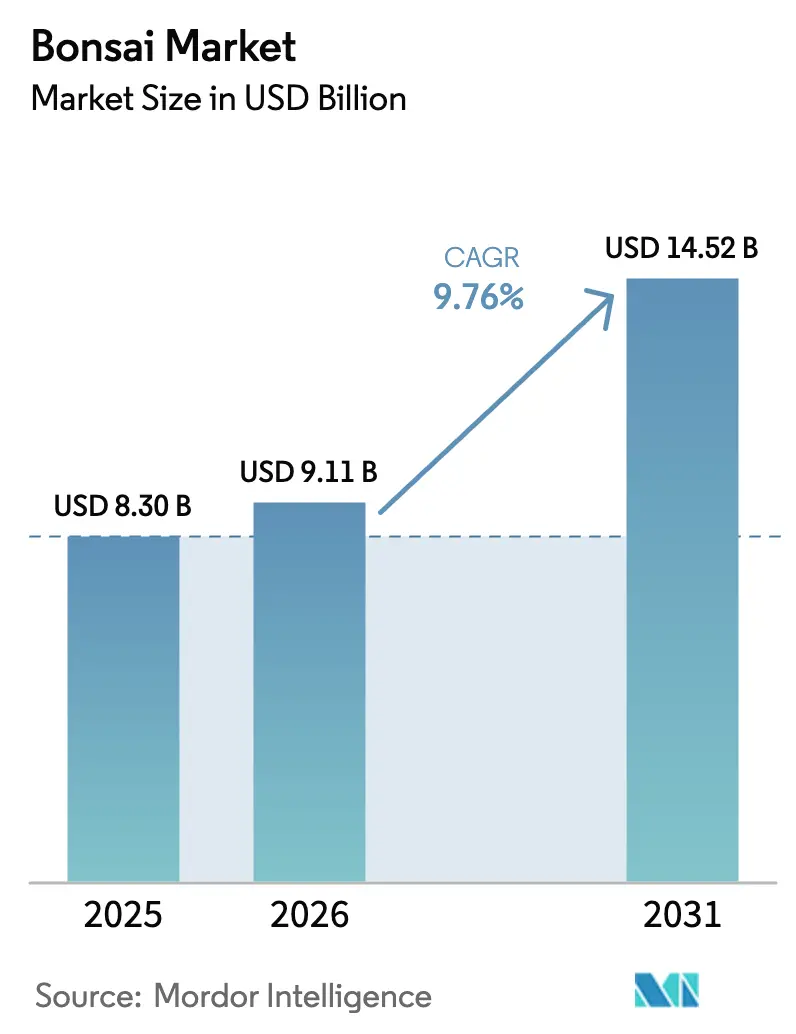
| Market Size (2026) | USD 9.11 Billion |
| Market Size (2031) | USD 14.52 Billion |
| Growth Rate (2026 - 2031) | 9.76% CAGR |
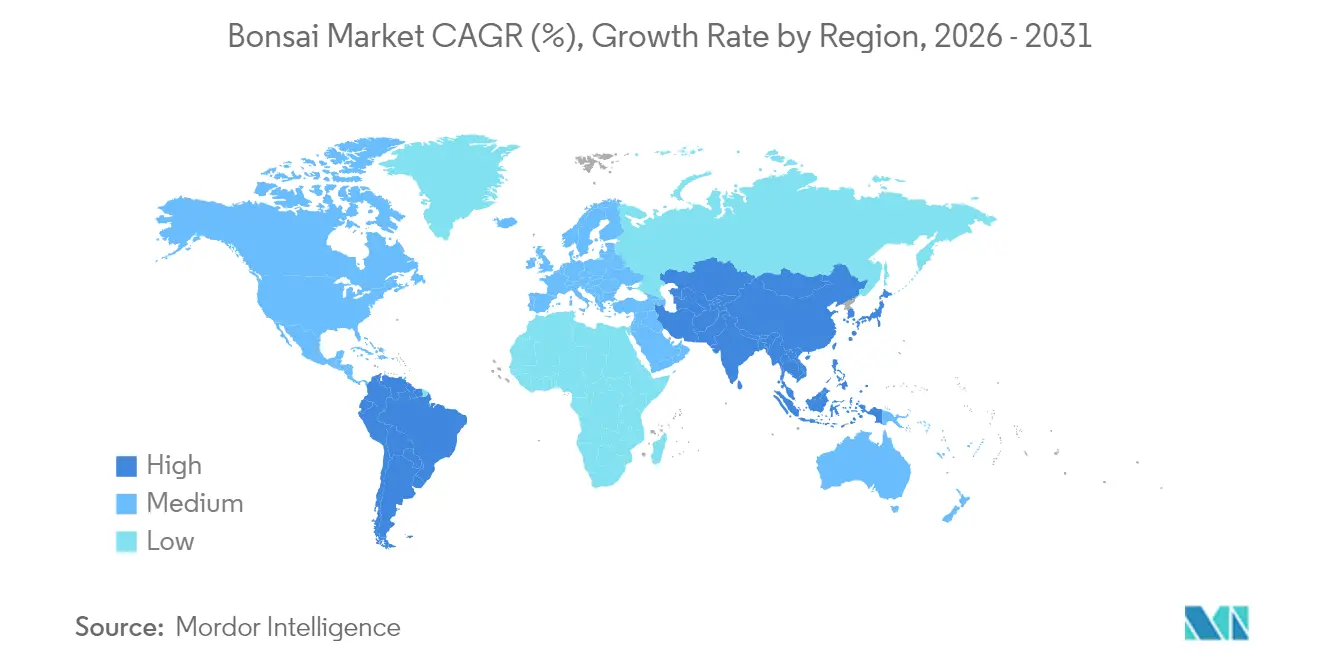
| Fastest Growing Market | Asia Pacific |
| Largest Market | Asia Pacific |
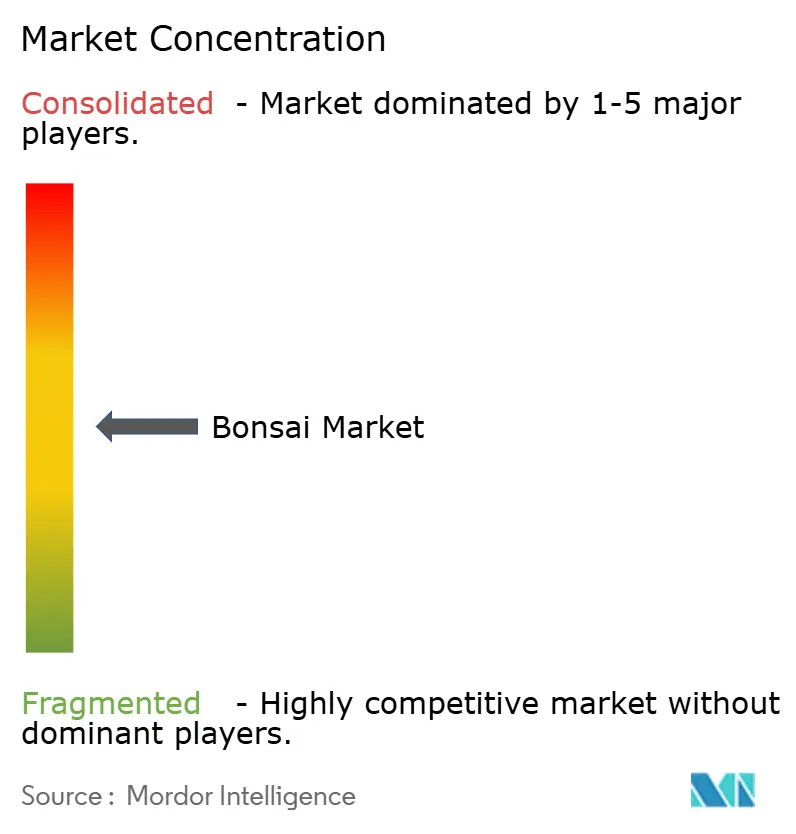
| Market Concentration | Medium |
Major Players *Disclaimer: Major Players sorted in no particular order Image © Mordor Intelligence. Reuse requires attribution under CC BY 4.0. | |
Bonsai Market Analysis by Mordor Intelligence
The bonsai market size is expected to grow from USD 8.3 billion in 2025 to USD 9.11 billion in 2026 and is forecast to reach USD 14.52 billion by 2031 at 9.76% CAGR over 2026-2031. Consumer migration to cities, the popularity of compact décor plants, and the rise of digital specialty‐plant platforms are expanding both addressable demand and geographic reach of the bonsai commodity market. Broader disposable income, especially among young urban hobbyists, is prompting a shift from niche collecting toward mainstream living-art purchases that blur the line between investment and lifestyle[1]Source: National Public Radio, “400-Year-Old Yamaki Pine Draws Crowds on World Bonsai Day,” npr.org. At the same time, regulatory complexity in cross-border plant movement, climate-related pest pressures, and labor-intensive care requirements temper the short-term scalability of the bonsai commodity market.
Key Report Takeaways
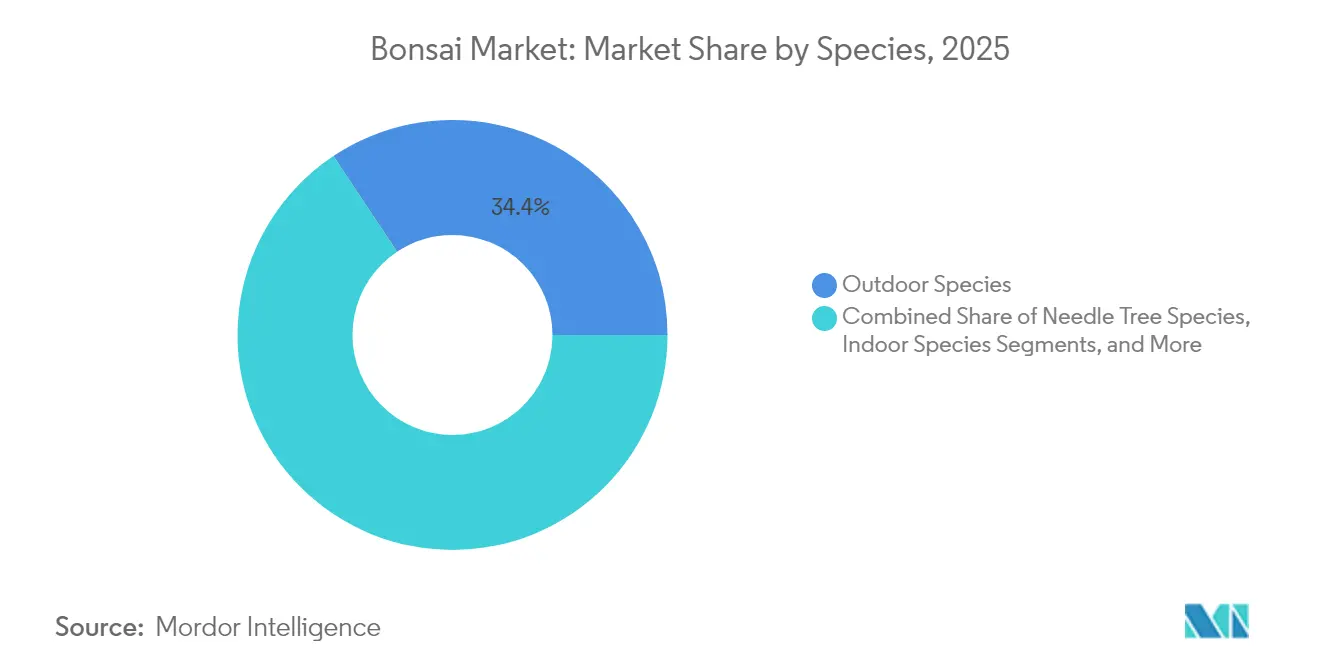
- By species, outdoor varieties led with 34.35% of bonsai commodity market share in 2025, and indoor varieties are rising at a 10.28% CAGR through 2031.
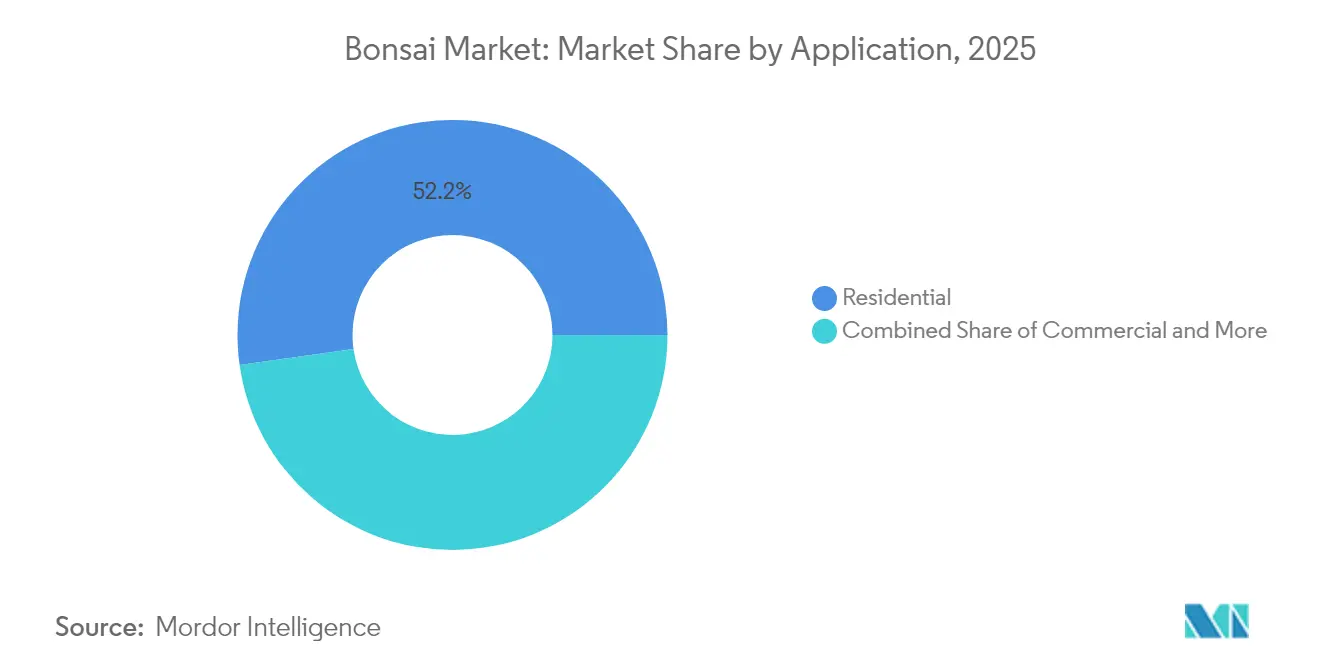
- By application, residential installations accounted for 52.23% share of the bonsai commodity market size in 2025, while commercial use is expanding at a 9.55% CAGR through 2031.
- By distribution channel, offline outlets retained 64.10% share of the bonsai commodity market in 2025, and online platforms are climbing at a 13.58% CAGR to 2031.
- By geography, Asia-Pacific captured 45.85% of the bonsai commodity market share in 2025 and is advancing at an 11.28% CAGR through 2031.
Note: Market size and forecast figures in this report are generated using Mordor Intelligence’s proprietary estimation framework, updated with the latest available data and insights as of 2026.
Global Bonsai Market Trends and Insights
Drivers Impact Analysis*
| Driver | (~) % Impact on CAGR Forecast | Geographic Relevance | Impact Timeline |
|---|---|---|---|
| Cultural significance and tradition | +2.1% | Global, with Asia-Pacific core influence | Long term (≥ 4 years) |
| Urban densification is driving demand for compact ornamentals | +2.8% | North America and European Union urban centers, Asia-Pacific megacities | Medium term (2-4 years) |
| Sustainability and low-carbon landscaping goals | +1.9% | European Union and North America, expanding to Asia-Pacific | Medium term (2-4 years) |
| Rising disposable income for premium hobby crops | +2.3% | Global, concentrated in developed markets | Short term (≤ 2 years) |
| AI-driven e-commerce platforms matching growers and collectors | +1.7% | Global, led by North America and the European Union | Short term (≤ 2 years) |
| Micro-grafting rootstock R&D boosting farm productivity | +1.4% | Asia-Pacific production centers, spillover to the global | Long term (≥ 4 years) |
| Source: Mordor Intelligence | |||
Cultural significance and tradition
Cross-generational appreciation of miniature trees is turning heritage practices into commercial momentum. The 400-year anniversary celebration of the Yamaki Pine at the U.S. National Arboretum in May 2025 drew record footfall, live auctions, and new vendor partnerships, underscoring how cultural events catalyze sales of both young and mature specimens[2]Source: U.S. National Arboretum, “World Bonsai Day Program Highlights,” usna.usda.gov. Blending Japanese styling with Western interiors is widening the taste spectrum, and curator testimonials indicate steady year-round visitor spending that supports premium retail price points.
Urban densification driving demand for compact ornamentals
Soaring apartment living is reshaping ornamental plant choice, and bonsai offers high visual impact per square foot. The 2025 Garden Trends Report notes that city dwellers are converting balconies into gardens, boosting demand for container plants with architectural form. Commercial venues illustrate the same shift, a decades-old bonsai installation in Atlanta’s airport lounge draws traveler engagement and showcases durability in high-traffic spaces.
Sustainability and low-carbon landscaping goals
Corporate campuses and homeowners subject to water restrictions favor bonsai because small root zones minimize irrigation needs. Drought-tolerant cultivars align with water-wise mandates highlighted in 2025 horticulture advisories. TAIZAN’s April 2025 “WITHERS” product line, which preserves dead trees as art pieces, illustrates circular-economy thinking that extends a tree’s life cycle while commanding premium margins.
Rising disposable income for premium hobby crops
Axiom’s 2025 survey shows nearly 40% of gardeners intend to spend more despite broader cost-of-living worries. High-ticket units validate willingness to pay. Portland’s Bonsai Mirai lists individual trees from USD 7,000, while entry specimens at regional nurseries clear at USD 160–750, enabling tiered offerings that capture broader wallets. Stress relief benefits resonate with affluent professionals, and subscription care services now bundle regular pruning, fertilizing, and styling visits, mitigating maintenance anxieties for time-pressed owners.
Restraints Impact Analysis*
| Restraint | (~) % Impact on CAGR Forecast | Geographic Relevance | Impact Timeline |
|---|---|---|---|
| High labor-intensive maintenance costs | -1.8% | Global, particularly in high-wage markets | Short term (≤ 2 years) |
| Limited grower expertise outside East Asia | -1.4% | North America and European Union, emerging markets | Medium term (2-4 years) |
| Stricter phytosanitary export rules | -1.2% | Global trade corridors | Medium term (2-4 years) |
| Climate-change-induced pest outbreaks | -0.9% | Global, concentrated in traditional growing regions | Long term (≥ 4 years) |
| Source: Mordor Intelligence | |||
High labor-intensive maintenance costs
Fine pruning, wiring and repotting require skilled labor, and wage inflation raises operating expenses outside low-cost Asian clusters. Recent consumer polling finds that 70% of shoppers value eco-friendly products yet remain highly price-sensitive, forcing growers to balance craftsmanship with affordability. Commercial buyers weigh bonsai against lower-maintenance living-wall alternatives, curbing uptake in cost-focused projects.
Limited grower expertise outside East Asia
Generations of technique reside largely in Japan, China and Taiwan, creating knowledge bottlenecks in Western production. The inaugural International Symposium on Bonsai drew experts from 16 nations, spotlighting both enthusiasm and skill gaps. Apprenticeship programs and certification schemes are scaling, yet mastery still spans years, stunting near-term supply. Collaborative research that merges tissue-culture science with traditional aesthetics may shorten learning curves, enabling more uniform quality across regions.
*Our forecasts treat driver/restraint impacts as directional, not additive. The impact forecasts reflect baseline growth, mix effects, and variable interactions.
Segment Analysis
By Species: Indoor varieties sustain double-digit growth
Indoor cultivars are the fastest-expanding slice of the bonsai commodity market, advancing at a 10.28% CAGR through 2031 on the back of apartment living and the houseplant boom. Needle conifers and deciduous maples still command the heritage aura that bolsters outdoor demand, but space-saving ficus, jade, and money-tree selections dominate new purchases. The indoor cohort benefits from micro-propagation advances, which achieve close to 100% rooting success and temper price inflation.
At 34.35% of the overall bonsai commodity market share in 2025, outdoor species remain revenue leaders, yet their growth lags as smaller urban plots limit landscape installations. The bonsai commodity market size for indoor varieties is set to swell by 2031, reflecting both volume gains and premiumization at specialty retailers.


By Distribution Channel: E-commerce gains speed, offline evolves omnichannel
Offline outlets - garden centers and specialty nurseries held 64.10% share in 2025, upheld by buyers who prefer in-person inspection of high-value specimens. Yet the online slice is projected to log a 13.58% CAGR, making it the fastest-growing conduit of the bonsai commodity market. HD photography, augmented-reality placement tools, and AI-assisted species matchups reduce perceived risk for remote purchasing.
Omnichannel pioneers livestream nursery tours, allowing global customers to reserve trees before shipping. Subscription boxes delivering pruning tools and fertilizers build recurring revenue while nurturing customer proficiency. Return policies tied to plant-health guarantees build trust, and blockchain tagging is emerging to certify provenance for collectors.
By Application: Commercial spaces accelerate, residential remains core
Residential buyers commanded 52.23% of the bonsai commodity market share in 2025, driven by hobbyist culture and décor trends. Commercial demand, however, is rising at a 9.55% CAGR through 2031 as companies integrate biophilic design. Hospitals and airports showcase mature bonsai to calm visitors and reinforce corporate sustainability narratives.
Therapeutic use cases in healthcare are expanding under evidence-based design guidelines that link plant exposure to patient recovery metrics. Universities adopt bonsai programs to blend cultural studies with horticulture, creating experiential curricula that purchase bulk starter kits. Corporate gifting of compact trees during holiday seasons is surging, spawning sub-segments for branded pots and maintenance subscriptions.
Geography Analysis
Asia-Pacific controlled 45.85% of the bonsai commodity market share in 2025 and is advancing at an 11.28% CAGR through 2031 on the strength of cultural heritage, lower labor costs, and established logistics. Japan leverages artisan authority, TRADMAN'S BONSAI introduced engraved tools at USD 60, feeding a premium accessory tier that supports overall category growth. China’s deep e-commerce penetration online, exceeding 40% of lifestyle sales, offers a scalable template for regional bonsai marketplace rollouts. Producers in Vietnam and Indonesia are entering export channels with climate-tolerant seedlings, diversifying supply, and reducing lead times.
North America is the second-largest revenue contributor and shows substantial acceleration owing to urban densification and affluent consumer bases. Portland’s nursery ecosystem, quoting trees from USD 160 entry pieces to USD 7,000 masterworks, illustrates tiered pricing that accommodates varying budgets while elevating perceived artistry. Corporate offices, hospitality venues, and airports commission statement bonsai to enhance indoor air quality and visual appeal, propelling commercial demand beyond hobbyist circles. Regulatory harmonization efforts between the United States and key Asian suppliers could trim phytosanitary delays, further unlocking growth.
Europe is pivoting toward water-efficient landscaping that aligns with strict environmental rules, positioning bonsai as a viable ornamental alternative. Compliance costs under EU phytosanitary regimes form both entry barriers and protective moats: established importers enjoy reduced competitive pressure, while emerging local greenhouses adopt controlled-environment agriculture to localize supply. Corporate net-zero pledges increasingly allocate budget for low-carbon indoor greenery, and bonsai’s small soil footprint suits retrofit projects in historic urban cores where space and water access are constrained. Subsidies in select EU states for drought-resistant plantings may further stimulate category adoption.
Note: Segment share of all individual segments available upon report purchase

Competitive Landscape
The bonsai market remains at medium concentration, with scores of regional nurseries and artisan growers but no single entity topping a double-digit share. Cultural authenticity, horticultural mastery, and established collector networks underpin competitive advantage. Large horticulture conglomerates are eyeing cross-selling opportunities, bundling bonsai with hardscape and irrigation products under integrated landscape contracts.
Technology adoption is becoming a sorting mechanism. Growers deploying automated misting, LED spectrums, and AI-driven health analytics are pushing down unit labor while sustaining artisan quality. Digital platforms that marry 3D modeling with Gaussian-splatting visualization allow designers and corporate buyers to preview fully styled trees in virtual space, accelerating specification decisions and shortening sales cycles. Sustainability-centric brands such as TAIZAN’s “WITHERS” harness circular-economy narratives to command premium margins and appeal to ESG-driven buyers.
White-space opportunities lie in subscription maintenance, commercial leasing programs, and corporate wellness workshops that offset high acquisition costs. AI-enhanced consumer profiling tools now segment prospects by décor taste, budget and sustainability priorities, enabling hyper-targeted marketing at scale. Intellectual property surrounding tissue-culture clones of heritage cultivars is projected to gain prominence, with early movers patenting disease-resistant lines to secure royalty streams.
Bonsai Industry Leaders
Kaizen Bonsai
Brussel's Bonsai
Mistral Bonsai
Lodder Bonsai BV
Bonsai Network Japan
- *Disclaimer: Major Players sorted in no particular order

Recent Industry Developments
- January 2025: Bonsai Robotics raised USD 15 million Series A to expand AI-based orchard automation, with future applicability to precision bonsai carenetwork.
- January 2025: SiteOne’s Devil Mountain joint venture acquired Pacific Nurseries in California, widening wholesale reach in the San Francisco Bay Area.
- March 2025: The U.S. National Arboretum hosted the Yamaki Pine 400-year celebration on World Bonsai Day, driving heightened media and consumer attention.


Research Methodology Framework and Report Scope
Market Definitions and Key Coverage
Our study defines the global bonsai market as the annual value of miniature, living woody plants intentionally trained to mimic mature trees, plus the pots, soils, and pruning inputs sold with them. Values represent consumer-level spending through both specialty nurseries and general retail, expressed in USD.
Scope Exclusion: Artificial plastic or silk "bonsai" décor items remain outside this valuation.
Segmentation Overview
- By Species
- Indoor Species
- Outdoor Species
- Needle Tree Species
- Deciduous Tree Species
- By Distribution Channel
- Online
- Offline
- By Application
- Residential
- Commercial
- Others (institutional gifts, art fairs)
- By Geography
- North America
- United States
- Canada
- Mexico
- Rest of North America
- Europe
- Germany
- United Kingdom
- France
- Russia
- Spain
- Rest of Europe
- Asia-Pacific
- China
- Japan
- India
- Thailand
- Australia
- Rest of Asia-Pacific
- South America
- Brazil
- Argentina
- Rest of South America
- Middle East
- Saudi Arabia
- UAE
- Rest of Middle East
- Africa
- South Africa
- Rest of Africa
- North America
Detailed Research Methodology and Data Validation
Primary Research
Mordor analysts interviewed nursery owners in Japan, the United States, and Italy, online marketplace managers, landscaping contractors, and instructors who run bonsai workshops. Their insights refined typical tree age-price ladders, online-to-offline sales ratios, and seasonal gift peaks, thereby anchoring model assumptions that are hard to observe in public data.
Desk Research
We began with horticulture trade statistics, customs codes for live ornamental trees, and nursery census tables published by organizations such as FAO, USDA-NASS, and Eurostat. National gardening surveys, patent filings for dwarfing techniques tracked on Questel, and shipment data from Volza helped us size cross-border flows and average selling prices. Company 10-Ks and investor decks revealed channel mix shifts, while regional bonsai associations, academic journals on arboriculture, and press articles rounded out demand drivers. This list is illustrative; many additional open sources were read to corroborate numbers and clarify definitions.
Market-Sizing & Forecasting
A top-down build starts with country-level production and import volumes of live ornamental trees, which are then multiplied by bonsai penetration rates gathered from surveys and adjusted for average transaction values. Select bottom-up checks, sampled price-tier inventories from leading e-stores and specialty fairs, help us reconcile totals. Key variables include mature tree export counts from Japan, average basket value in major online plant stores, frequency of bonsai gift purchases around Lunar New Year, growth in beginner workshop enrolments, and urban apartment size trends. Forecasts rely on a multivariate regression blended with scenario analysis; GDP per capita, e-commerce adoption, and hobbyist population growth were the best-fit predictors vetted with experts. Gaps in granular bottom-up data are bridged with conservative interpolation from verified analog markets.
Data Validation & Update Cycle
Outputs pass anomaly checks against independent indicators, analyst peer review, and a senior sign-off. The model refreshes each year, with interim updates triggered by material events, tariff changes, quarantine rules, or major online marketplace launches, so clients always receive our most current view.
Why Our Bonsai Baseline Commands Confidence
Published figures often diverge because publishers select different tree categories, price points, and refresh cadences.
Key gap drivers include the inclusion of decorative houseplants by some sources, the use of shelf-price scans without specialty channels, or aggressive growth assumptions untested by field interviews. Mordor's disciplined scope, balanced variables, and annual primary validations create a dependable benchmark.
Benchmark comparison
| Market Size | Anonymized source | Primary gap driver |
|---|---|---|
| USD 8.30 Bn (2025) | Mordor Intelligence | - |
| USD 9.35 Bn (2025) | Global Consultancy A | Includes wider ornamental plants and limited primary checks |
| USD 8.42 Bn (2024) | Industry Journal B | Relies on mass-retail POS prices, omits specialty nurseries |
| USD 5.30 Bn (2023) | Regional Consultancy C | Applies conservative ASPs and older data refresh cycle |
In summary, external estimates swing widely because of inconsistent scopes and assumptions. By grounding values in transparent variables, double-sourced data, and yearly expert feedback, Mordor Intelligence delivers a balanced, replicable baseline decision-makers can trust.


Key Questions Answered in the Report
What is the current size of the bonsai market?
The bonsai market is valued at USD 9.11 billion in 2026 and is forecast to reach USD 14.52 billion by 2031.
Which species segment is expanding fastest?
Indoor bonsai varieties are the fastest-growing, posting a 10.28% CAGR through 2031 due to urban living and houseplant trends.
Why is Asia-Pacific the largest regional market?
Asia-Pacific holds 45.85% of global revenue because of cultural heritage, skilled labor, and well-developed supply chains, while also delivering an 11.28% CAGR.
How are online channels reshaping sales?
E-commerce platforms enhanced with AI matching, AR visualization and global logistics are growing at a 13.58% CAGR through 2031, rapidly increasing share in what was once a predominantly offline category.
What is the main barrier to broader adoption?
High labor requirements for pruning and maintenance inflate ownership costs, particularly in high-wage countries, restraining mass-market penetration.
Which emerging trend could transform production efficiency?
Micro-grafting and tissue-culture innovations are improving rooting success and reducing growth cycles, potentially lowering supply constraints and cost structures in the coming years.
Page last updated on:


