
Market Overview
| Study Period | 2021 - 2031 |
|---|---|
| Forecast Data Period | 2026 - 2031 |
| Base Year Market Size (2025) | USD 4.3 Billion |
| Market Size (2026) | USD 4.54 Billion |
| Market Size (2031) | USD 5.95 Billion |
| Growth Rate (2026 - 2031) | 5.55 % |
| Market Concentration | Medium |
Major Players *Disclaimer: Major Players sorted in no particular order Image © Mordor Intelligence. Reuse requires attribution under CC BY 4.0. | |
Indonesia Agrochemicals Market Analysis by Mordor Intelligence
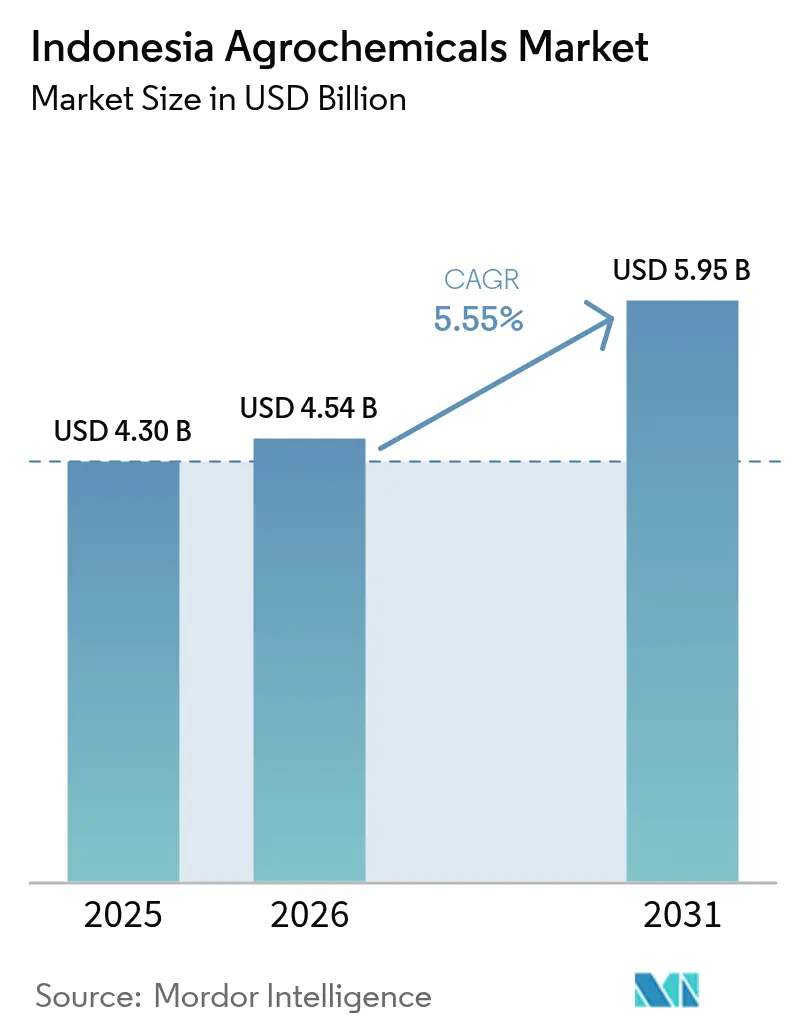
The Indonesia agrochemicals market size is expected to grow from USD 4.3 billion in 2025 to USD 4.54 billion in 2026 and is forecast to reach USD 5.95 billion by 2031 at 5.55% CAGR over 2026-2031. The market expansion is supported by government fertilizer subsidies, the development of climate-adaptive synthetic products, agricultural mechanization, and increasing horticultural exports. However, market growth faces challenges from counterfeit products, increasing adoption of organic farming practices, and growing herbicide resistance. PT Pupuk Indonesia, the state-owned enterprise, holds a significant market share through its subsidy distribution network. This market dominance has led multinational companies to focus on premium, technology-enhanced synthetic products to maintain profit margins. While Java continues to be the primary consumption center, the development of new production facilities in Papua, Kalimantan, and Sumatra is reducing logistics costs and enabling region-specific product formulations. The implementation of digital voucher systems, artificial intelligence-based crop advisory services, and mechanized paddy field transformation is increasing the per-hectare usage of agricultural inputs, strengthening Indonesia's synthetic agrochemicals market fundamentals.[1]
Key Report Takeaways
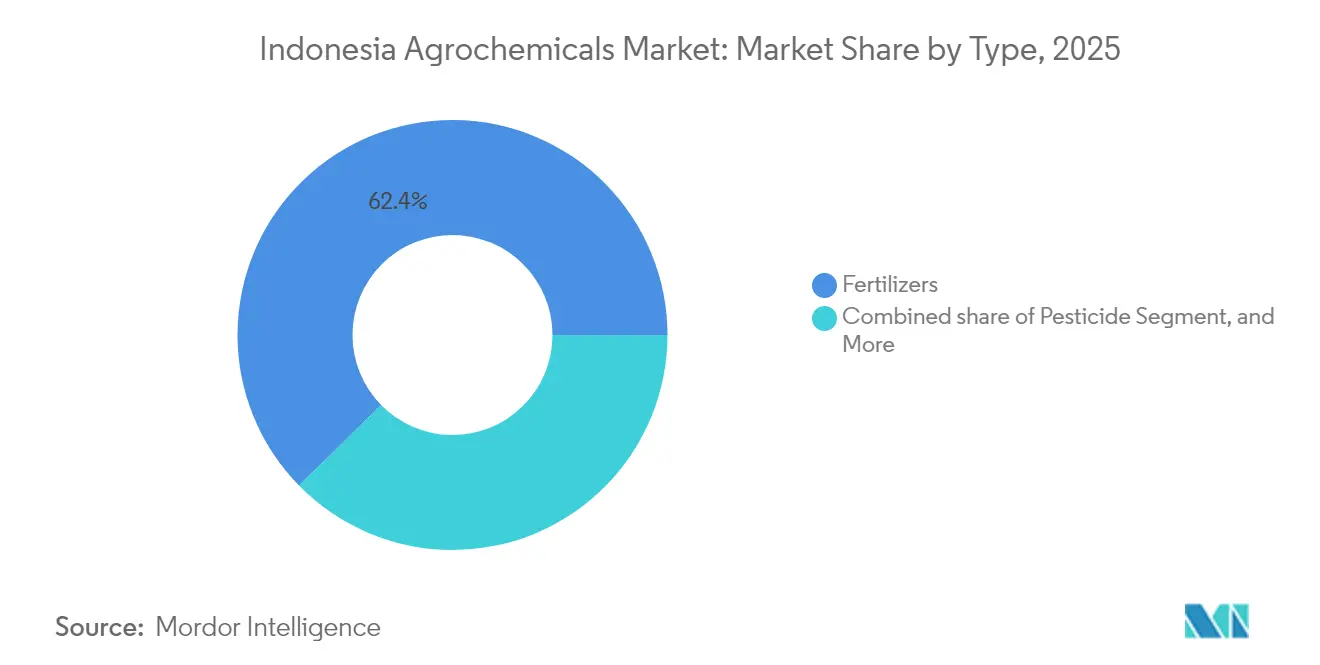
- By type, fertilizers led with 62.35% revenue share in 2025, and plant growth regulators are advancing at an 8.05% CAGR through 2031.
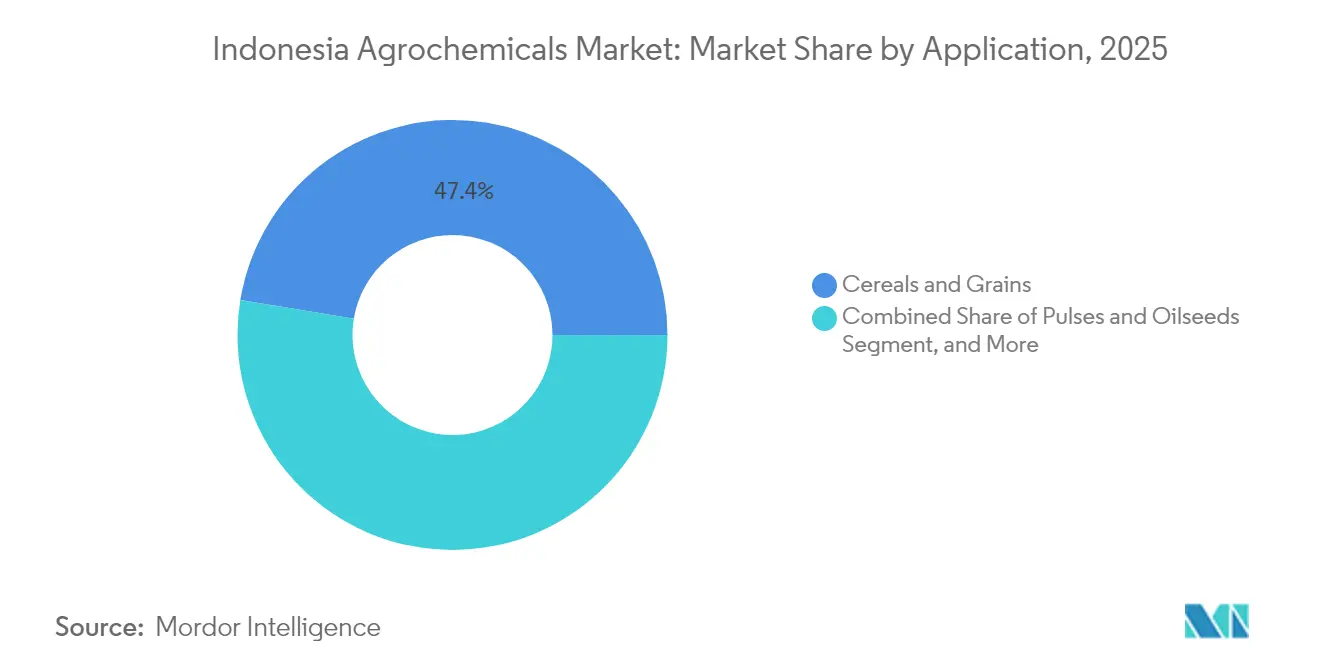
- By application, cereals and grains accounted for 47.40% of the Indonesia agrochemicals market share in 2025, while fruits and vegetables are projected to climb at a 6.72% CAGR through 2031.
- Bayer AG, Syngenta Group, Corteva Agriscience, BASF SE, and PT. Pupuk Indonesia together controlled more than half of the Indonesia agrochemicals market share in 2025.
Note: Market size and forecast figures in this report are generated using Mordor Intelligence’s proprietary estimation framework, updated with the latest available data and insights as of 2026.
Indonesia Agrochemicals Market Trends and Insights
Drivers Impact Analysis*
| Driver | (~) % Impact on CAGR Forecast | Geographic Relevance | Impact Timeline |
|---|---|---|---|
| Government Fertilizer Subsidies and E-voucher Distribution | +1.8% | National, concentrated in Java, Sumatra, and Sulawesi | Short term (≤ 2 years) |
| Expansion of Domestic Fertilizer Capacity | +1.2% | National, with major facilities in East Java, and East Kalimantan | Medium term (2-4 years) |
| Accelerating Mechanized Paddy Conversion Drives | +0.9% | Java, Sumatra, and South Sulawesi rice production centers | Medium term (2-4 years) |
| Chemical Use Surge in Horticulture Export Targets | +0.7% | Java, North Sumatra, and West Java export corridors | Long term (≥ 4 years) |
| AI-enabled Crop Advisory Apps Boosting Agrochemicals Intensity | +0.5% | Java, expanding to Sumatra and Sulawesi | Long term (≥ 4 years) |
| Palm-oil By-product Plant Growth Regulators Gaining Regulatory Fast-track | +0.3% | Sumatra, Kalimantan, and Riau palm oil regions | Long term (≥ 4 years) |
| Source: Mordor Intelligence | |||
Government Fertilizer Subsidies and E-voucher Distribution
Indonesia's fertilizer subsidy program has created a dual-tier market where subsidized nutrient blends compete with premium formulations. The digital delivery through mobile platforms improves targeting and transparency, allowing suppliers to match products with regional cropping requirements. This system maintains steady demand for basic fertilizers and increases farmer loyalty to domestic producers, while encouraging international companies to develop differentiated blends and enhanced coatings. East Java receives the largest share of subsidies, with distribution networks centered around major urban areas. As the subsidy focuses on staple crops like rice, suppliers of specialty inputs must modify their approaches to serve horticultural zones outside the subsidy coverage. The program maintains price stability and highlights the importance of government collaboration in the agrochemical industry.
Expansion of Domestic Fertilizer Capacity
Indonesia's significant investment in fertilizer production infrastructure includes new facilities and upgrades across various regions. This expansion aims to decrease import dependence and enhance supply chain performance, particularly to remote islands with historical logistics challenges. The higher production volume increases competition in standard fertilizer grades, encouraging manufacturers to focus on value-added formulations for better profit margins. The expansion increases demand for upstream chemical components, creating opportunities for international specialty chemical suppliers. The additional capacity will influence market dynamics by reducing production costs and promoting market segmentation into premium categories.
Accelerating Mechanized Paddy Conversion Drives
Agricultural machinery adoption in rice cultivation areas is changing input application patterns. Mechanized equipment enables accurate and well-timed fertilizer and pesticide application, improving yields and increasing chemical usage per hectare. Government financing programs help smallholder farmers access these technologies, particularly in the main food-producing regions. Mechanization integrates with digital farming tools that guide application timing, encouraging farmers to use diverse agrochemical products. With increasing labor scarcity and costs, mechanization continues to drive demand for equipment-compatible formulations and specialized additives.
Chemical Use Surge in Horticulture Export Targets
Indonesia's increased emphasis on tropical fruit production aims to establish regional export leadership. This development requires high-quality agrochemical inputs to meet export market requirements. Farmers are adopting advanced fungicides and pest control products with reduced pre-harvest intervals to meet residue limits. Areas with expanding fruit and vegetable production show increased demand for micronutrients and specific disease control products.[2] Government-provided technical training supports the implementation of intensive chemical programs, including water-soluble fertilizers for precision irrigation systems. The expansion of orchards and greenhouse operations is diversifying the agrochemical market beyond traditional field crops.
Restraints Impact Analysis*
| Restraints | (~) % Impact on CAGR Forecast | Geographic Relevance | Impact Timeline |
|---|---|---|---|
| Counterfeit and Illegal Pesticide Inflow | -0.8% | National and concentrated in border regions and major ports | Short term (≤ 2 years) |
| Growing Smallholder Shift to Organic Certifications | -0.6% | Java, Yogyakarta, and Central Java organic farming zones | Medium term (2-4 years) |
| Herbicide-resistant Weed Outbreaks | -0.4% | Sumatra, Kalimantan palm oil and rice regions | Medium term (2-4 years) |
| El-Niño Induced Fertilizer Price Shocks | -0.7% | National and severe impact in Eastern Indonesia | Short term (≤ 2 years) |
| Source: Mordor Intelligence | |||
Counterfeit and Illegal Pesticide Inflow
The Indonesian agricultural sector faces significant challenges from unauthorized agrochemical products entering the market. These illicit pesticides, which often mimic established brands, negatively impact farmer trust and disrupt authorized distribution networks. Companies have increased their investments in protective measures, including tamper-evident packaging and digital tracking systems, to maintain brand authenticity. The country's maritime borders remain susceptible to illegal imports due to logistical complexities and enforcement limitations. While industry participants and regulatory authorities work together to strengthen controls and enforcement measures, market disruptions continue. Companies are implementing preventive strategies, including retail outlet inspections and farmer awareness programs, to maintain market confidence and protect sales.
Growing Smallholder Shift to Organic Certifications
Small-scale farmers increasingly adopt low-input farming methods that prioritize environmental sustainability and financial stability. These agricultural practices generate lower yields per hectare but maintain economic viability through reduced synthetic input requirements and enhanced environmental stress tolerance. The adoption rate increases through community networks, particularly in areas where farmers seek protection against input price fluctuations. Traditional agrochemical suppliers face potential sales volume reductions unless they adapt their product portfolios to meet these changing farmer requirements. Organic certification attracts premium pricing from urban retailers and export buyers, encouraging gradual acreage conversion. The ongoing transition to diverse input strategies may transform market demand patterns, requiring suppliers to develop integrated solutions and complementary products that support these emerging agricultural practices.
*Our forecasts treat driver/restraint impacts as directional, not additive. The impact forecasts reflect baseline growth, mix effects, and variable interactions.
Segment Analysis
By Type: Fertilizers Anchor Market Amid Specialty Growth
Fertilizers contributed 62.35% of Indonesia's agrochemicals market size in 2025. Government subsidies maintain consistent demand, while market commoditization has prompted manufacturers to develop coated, slow-release, and micronutrient-enriched products for improved margins. The expansion of domestic production capacity has led traditional fertilizer manufacturers to partner with specialty chemical companies to access new technologies. Pesticides remain the second-largest segment, with resistance management driving diversification in active ingredients and stewardship programs. Fungicides and adjuvants show steady growth, particularly in high-frequency application areas where performance and compatibility are essential.
Plant growth regulators, despite their small market share, demonstrate the highest growth rate at 8.05% CAGR, supported by precision farming practices and controlled cultivation methods that require hormonal products for harvest uniformity. Multinational companies now combine regulators and adjuvants with pesticide products to provide comprehensive crop management solutions. Extended registration periods create barriers to entry, benefiting established companies but limiting the introduction of new formulations. Market success requires strong regulatory compliance and adaptable research capabilities to address evolving agricultural needs.

By Application: Cereals Dominance Challenged by Export Crops
Cereals and grains represented 47.40% of the Indonesia agrochemical market share in 2025, supported by rice self-sufficiency initiatives and increased corn cultivation, which maintains high demand for nitrogen fertilizers and herbicides. Growth in this segment is stabilizing as subsidy levels plateau. The fruits and vegetables segment is expanding at 6.72% CAGR, driven by export opportunities and increased urban demand for consistent produce supply. Plantation crops, particularly palm oil, maintain a stable demand for fungicides and herbicides suited for long-term cultivation.
Indonesia's regions display distinct agrochemical usage patterns. Java's intensive shallot and pepper intercropping requires substantial pesticide use, North Sumatra's citrus production needs balanced micronutrient applications, and Riau's palm oil estates require targeted weed management for resistance control. Export-oriented producers increasingly adopt low-residue products and traceable input systems to meet international requirements, leading suppliers to provide documentation and compliance support. These regional and crop-specific requirements create distinct market opportunities within Indonesia's agrochemical sector
Geography Analysis
Java dominates value capture, accounting for more than half of Indonesia's agrochemicals market transactions. Dense cropping patterns, efficient logistics, and well-established advisory networks drive this. East Java reinforces its primacy through substantial fertilizer distribution, while Central and West Java mirror this intensity. The widespread adoption of AI-driven advisory tools among rice farmers in these regions has led to increasingly sophisticated input strategies. However, land scarcity and growing environmental scrutiny are prompting a gradual shift toward low-chemical models in select districts.
Sumatra represents the market's fastest-growing region. The diversification of palm-oil estates into corn, rice, and tropical fruits increases crop protection product demand. North Sumatra's export infrastructure supports high-value horticulture, increasing fungicide consumption. Riau and South Sumatra focus on mature plantation rejuvenation through integrated weed management, while Lampung's smallholder practices moderate synthetic input demand.
Kalimantan and Sulawesi present growth opportunities despite infrastructure limitations. South Kalimantan's agroindustry initiatives attract distributors offering adaptable logistics solutions. Central Kalimantan's food-estate developments increase per-acre agrochemical expenditure through mechanization and irrigation improvements. South Sulawesi shows increased demand for new active ingredients and stewardship programs due to resistance management needs. While expansion into these outer islands requires sustained investment and region-specific approaches, they offer early-entry advantages as Java's market reaches saturation.
Regulatory Landscape
Indonesia regulates pesticides through the Ministry of Agriculture, with registration centralized under the Center for Plant Variety Protection and Agricultural Licensing (PVTPP), in line with Ministry of Agriculture Regulation No. 43/2019. In January 2025, PVTPP launched the Sustainable Pesticide Management Framework (SPMF) with CropLife Asia and CropLife Indonesia, reflecting a shift toward more risk-based, transparent, and digital licensing workflows that favor compliant dossiers and readiness for local testing.
For fertilizers, Presidential Regulation (Perpres) No. 113/2025 entered full implementation in January 2026, reforming the subsidy mechanism toward an input-based model. The 2026 allocation is referenced at 9.55 million tons for agriculture and 295,686 tons for fisheries. Trade controls also tightened in 2026, as the Ministry of Trade issued Trade Minister Regulation (Permendag) No. 11/2026, implemented from May 8, 2026, adding stricter import-licensing and technical-recommendation requirements for selected agricultural inputs. This reinforces the need for coordinated customs clearance and technical approvals.
Competitive Landscape
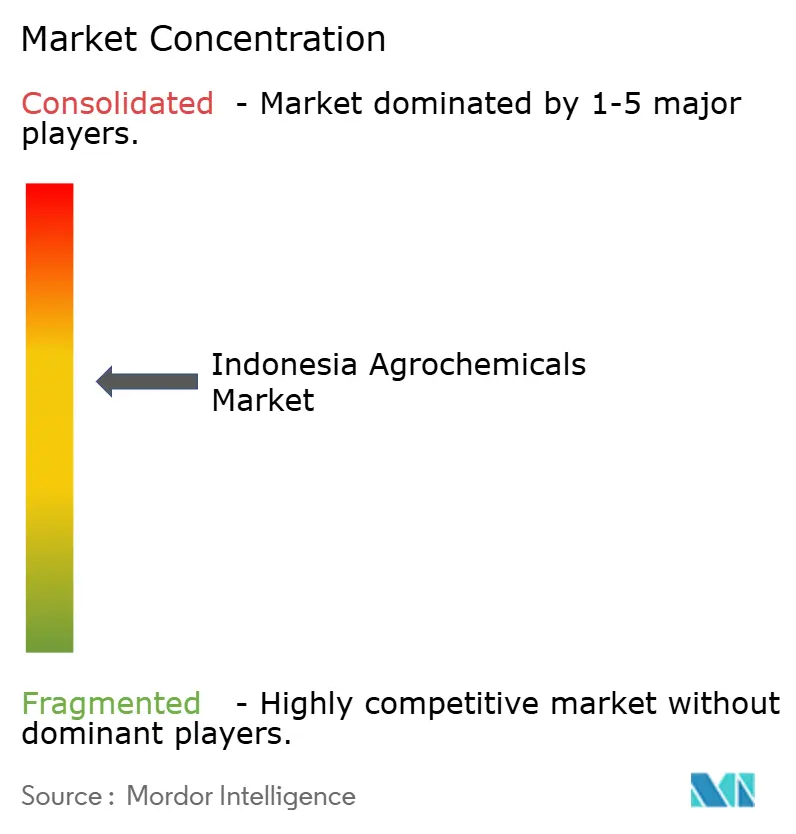
The Indonesia agrochemicals market shows moderate consolidation, with Bayer AG, Syngenta Group, Corteva Agriscience, BASF SE, and PT. Pupuk Indonesia holds more than half of the Indonesia agrochemical market share in 2024. The market structure combines state-backed control in commodity fertilizers and multinational presence in innovation-focused segments. PT Pupuk Indonesia maintains its position through subsidy distribution management, warehouse infrastructure, and integrated logistics across staple crop regions. Global companies focus on digital agronomy platforms, resistance-management solutions, and specialized crop protection programs to address farmer requirements.
Multinational companies are strengthening their market presence by integrating advisory services and combining agricultural inputs through local retail networks. This approach improves engagement with small-scale farmers and increases the adoption of comprehensive solutions. International companies are acquiring strategic assets to enhance distribution capabilities, combining global brands with local production facilities and improving access to micronutrient and specialty products. The combination of global expertise and local market understanding has become essential for market growth and customer retention.
Sustainability initiatives are becoming a key competitive advantage. Domestic manufacturers are investing in low-carbon production through green ammonia and hybrid manufacturing processes, meeting environmental standards and attracting environmentally conscious investors. Global companies are collaborating with drone operators for precision application services, while local firms are developing alternative raw materials for specialized market segments. While regulatory approvals remain time-intensive, they benefit established companies with strong compliance systems. Market success requires the integration of technology, commitment to sustainability practices, and implementation of farmer-focused service approaches that extend beyond traditional product sales.
Indonesia Agrochemicals Industry Leaders
-
Bayer AG
-
Syngenta Group
-
Corteva Agriscience
-
BASF SE
-
PT. Pupuk Indonesia
- *Disclaimer: Major Players sorted in no particular order
Market Opportunities and Future Outlook
State-led capacity expansion and upstream security initiatives are creating room for technology providers, specialty input suppliers, and partnership models tied to domestic production upgrades and logistics into outer islands. In April 2026, PT Pupuk Indonesia announced a Rp77 trillion plan for seven fertilizer and chemical factory projects through 2030, including a revamp of the Kaltim-2 ammonia facility scheduled for completion in 2026. Programs of this scale tend to raise demand for catalysts, process chemicals, coatings, and value-added formulations that differentiate beyond subsidized commodity grades.
Industrial diversification into chemicals linked to energy programs also provides adjacency opportunities that connect back to agrochemicals through feedstocks and distribution capabilities. PT Pupuk Indonesia confirmed plans for two methanol plants (Lhokseumawe, Aceh and Bontang, East Kalimantan) to support the national B50 biodiesel program, including an MoU for the Lhokseumawe site with Mubadala, alongside continued revitalization plans for aging assets that support a multi-year capex pipeline. On crop protection, PVTPP's digital and risk-based licensing direction under the SPMF, alongside Ministry of Agriculture Regulation No. 43/2019, supports demand for local efficacy and residue testing services, label-compliance capabilities, and stewardship programs. This is especially relevant as suppliers focus on premium, low-residue, and traceable solutions for export-oriented horticulture corridors.
Recent Industry Developments
- July 2026: PT Pupuk Indonesia signed an MoU with PT Pertamina (Persero) to collaborate on methanol development, clean ammonia, natural gas utilization, and renewable energy. The agreement links fertilizer and chemical production planning with domestic energy feedstock strategies, supporting input security and new industrial integration pathways for agricultural inputs.
- April 2026: PT Pupuk Indonesia announced a Rp77 trillion plan for seven fertilizer and chemical factory projects through 2030, including a revamp of the Kaltim-2 ammonia facility scheduled for completion in 2026. These investments reinforce a multi-year capex cycle and broaden domestic capacity for critical feedstocks.
- April 2024: PT Pupuk Indonesia partnered with Brunei Fertilizer Industries to jointly produce urea and ammonia, framed around regional food security and ASEAN collaboration. The tie-up strengthens cross-border supply options for key nutrient feedstocks and supports scale economics in commodity fertilizers that shape pricing dynamics for the broader agrochemicals basket.
Research Methodology Framework and Report Scope
Market Definition and Coverage
For this study, the Indonesia agrochemicals market is defined as the value of commercially produced chemical inputs used to improve crop yield and quality, mainly by supplying nutrients and controlling weeds, pests, and diseases, across agricultural production in Indonesia.
Scope exclusions: Farm tools, irrigation equipment, seeds, biological-only inputs, and on-farm labor services are excluded from this market sizing unless they are explicitly priced and sold as an agrochemical product.
Segmentation Overview
- By Type
- Fertilizers
- Nitrogenous
- Phosphatic
- Potassic
- Other Fertilizers
- Pesticides
- Herbicides
- Insecticides
- Fungicides
- Other Pesticides
- Adjuvants
- Plant Growth Regulators
- Fertilizers
- By Application
- Cereals and Grains
- Pulses and Oilseeds
- Fruits and Vegetables
- Commercial Crops
Data Sources, Market Sizing, and Validation
Desk Research
Desk research was used to build the fact base and confirm the market boundaries before any modeling was finalized, since agrochemicals link closely with planted area, crop mix, and regulated product availability in Indonesia. We reviewed public sources such as Statistics Indonesia (BPS) for crop area and output signals, FAOSTAT for longer time series checks, and Ministry of Agriculture publications for policy and adoption context. Import and export direction was checked using UN Comtrade, and ingredient or formulation references were cross-checked through the FAO and open literature in peer-reviewed agronomy journals.
To keep the commercial picture realistic, we also scanned company annual reports, investor decks, and official distributor or association communications for pricing direction and channel structure. Where the public trail was thin, a paid subscription for company financials and shipment-level trade intelligence was used selectively to validate revenue ranges and trade-mix assumptions. The desk research source list above is illustrative only, and other public documents and datasets were also used for data collection, validation, and clarification.
Primary Interviews and Surveys
Primary work focused on validating what is actually applied in Indonesia and how value is realized through channels, since label claims and list prices do not always match farm-level purchasing. We spoke with manufacturers, importers, distributors, large plantation buyers, and independent agronomists to confirm product mix splits, typical price movement, and how demand shifts across crop cycles and pest pressure. We also checked inputs across major producing areas within Indonesia, so the final assumptions reflect regional usage patterns rather than a single-province view.
Distribution of primary research fieldwork respondents
| Company type | Respondent position |
|---|---|
| Top tier: 25% | CXOs: 14% |
| Mid tier: 60% | Functional/Unit leaders: 30% |
| Smaller Players: 15% | Managers: 56% |
Market-Sizing & Forecasting
Sizing was built using a top-down approach where crop-wise demand pools were reconstructed from planted area, cropping intensity, and typical application norms, then converted to value using realistic price bands. To keep the totals grounded, we added selective bottom-up checks through supplier revenue ranges, channel markups, and a sampled ASP-times-volume logic for key product groups, and the model was adjusted only when multiple signals pointed the same way.
Key inputs used in the model included crop area and production trends, the mix shift between cereals, oilseeds, and commercial crops, fertilizer consumption direction as a nutrient demand signal, pesticide use intensity by pest and weed pressure, and import dependence for certain actives or formulations. Since pricing is a major driver in this market, assumptions also covered currency movement, typical distributor margins, and the pace of product upgrades, for example formulation concentration and pack size changes. Forecasts were developed using scenario analysis supported by short trend smoothing, where adoption and pricing paths were stress tested with primary insights so that expansion, flat, and tighter regulation cases were handled consistently. When bottom-up proxies had gaps for smaller channels, those parts were bridged using coverage ratios derived from interviews and trade shares, then rechecked against the final demand pool totals.
Data Validation & Update Cycle
Validation was done in steps so that large errors are caught early and small drifts are corrected before sign-off. Model outputs were compared against independent checks such as fertilizer import values, crop area movements, and price direction from market participants, and then variance flags were reviewed by another analyst for reasonableness. When an assumption drove an outsized change, the team went back to recheck the source trail and, if needed, recontacted respondents to confirm the latest on pricing or demand.
Reports are refreshed once a year so base numbers stay aligned with the latest public statistics and industry shifts, and interim updates are triggered when there are material events such as policy changes, major currency swings, or supply disruptions. Before delivery, a final review pass is completed to ensure the narrative, tables, and model outputs match the most recent validated inputs.
Mordor Intelligence's Indonesia Agrochemicals Market Size Compared With Other Published Estimates
It is common to see different market sizes quoted for Indonesia agrochemicals because the term agrochemicals is not treated the same way across studies, and pricing can be captured at different points in the value chain. Timing also matters, since agricultural seasons, currency conversion periods, and short-term supply tightness can shift a single-year value even when volumes do not change much.
Key gaps usually come from scope boundaries and how value is counted, where some estimates include only crop protection while others include fertilizers, adjuvants, and plant growth regulators together. By tracking application intensity by crop and refreshing price bands with channel checks, Mordor Intelligence keeps the value model anchored to what is applied in Indonesia and avoids mixing farm-gate spending with manufacturer-level sales.
Benchmark comparison
| Source | Market Size | Gaps in Research Methodology |
|---|---|---|
| Mordor Intelligence | USD 4.30 B (2025) | |
| Industry Publisher A | USD 3.70 B (2025) | This estimate appears to use a tighter boundary and may undercount non-pesticide inputs such as adjuvants or plant growth regulators, and it can also reflect different price point selection or timing for currency conversion. |
| Market Publisher B | USD 0.63 B (2025) | The value is closer to a crop protection only view or a restricted product subset, so fertilizer value and broader agrochemical categories are likely not included, which naturally pulls the total down. |
The spread in the table is largely explained by what gets included under agrochemicals and whether prices are taken at a manufacturer, distributor, or farm purchase level. Our approach stays traceable because each major crop demand pool is tied back to area, usage norms, and a clear pricing logic that can be rechecked when conditions change.
Key Questions Answered in the Report
What is the current value of the Indonesia agrochemicals market?
The market is valued at USD 4.54 billion in 2026 and is projected to reach USD 5.95 billion by 2031.
Which segment leads by type in Indonesia?
Fertilizers dominate with 62.35% revenue share in 2025, supported by large-scale government subsidies.
Which crop application segment is growing fastest?
Fruits and vegetables are expanding at a 6.72% CAGR through 2031 as Indonesia pushes tropical fruit exports.
Which region outside Java offers the strongest growth potential?
Sumatra, driven by palm-oil diversification and export horticulture, provides the most attractive expansion opportunities for suppliers.