Africa Biostimulants Market Size and Share
Market Overview
| Study Period | 2018 - 2031 |
|---|---|
| Forecast Data Period | 2026 - 2031 |
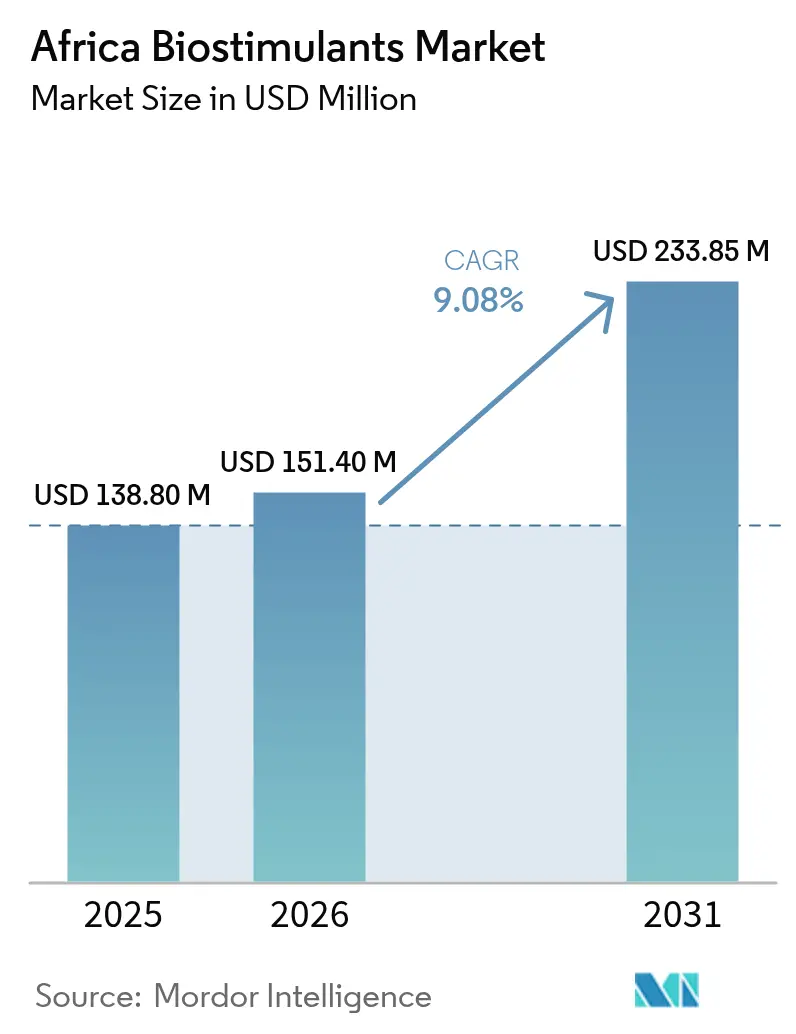
| Base Year Market Size (2025) | USD 138.8 Million |
| Market Size (2026) | USD 151.4 Million |
| Market Size (2031) | USD 233.85 Million |
| Growth Rate (2026 - 2031) | 9.08% CAGR |
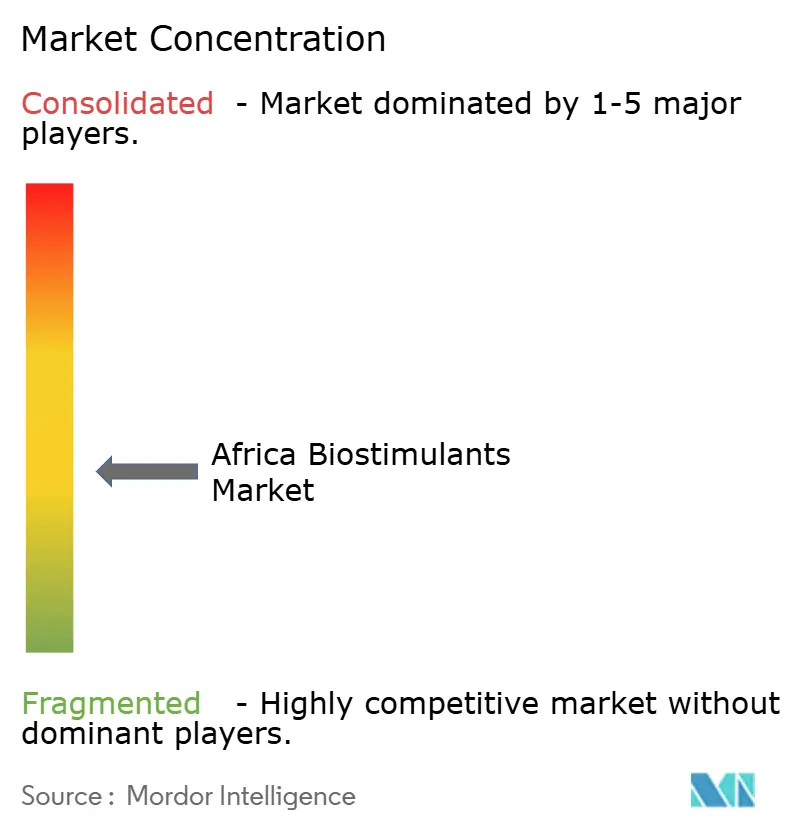
| Market Concentration | Medium |
Major Players *Disclaimer: Major Players sorted in no particular order Image © Mordor Intelligence. Reuse requires attribution under CC BY 4.0. | |
Africa Biostimulants Market Analysis by Mordor Intelligence
The Africa biostimulants market size is expected to grow from USD 138.8 million in 2025 to USD 151.4 million in 2026 and is forecast to reach USD 233.85 million by 2031 at 9.08% CAGR over 2026-2031. Widespread adoption of sustainable agriculture practices, expanding government incentive programs, and steady growth in export-oriented horticulture underpin this rise in demand. Climate-smart farming goals drive commercial growers to integrate biological inputs that boost nutrient efficiency and help crops tolerate water and heat stress. Larger agribusinesses increasingly partner with regional distributors to improve last-mile delivery, while new regenerative agriculture investment funds channel capital toward product trials and local manufacturing capacity. Evidence-based recommendations from research institutions in South Africa, Kenya, and Nigeria further encourage smallholder adoption by documenting yield and quality benefits across maize, horticulture, and cash crops. [1]Source: African Union Commission, “CAADP Strategy and Action Plan 2026-2035,” au.int
Key Report Takeaways
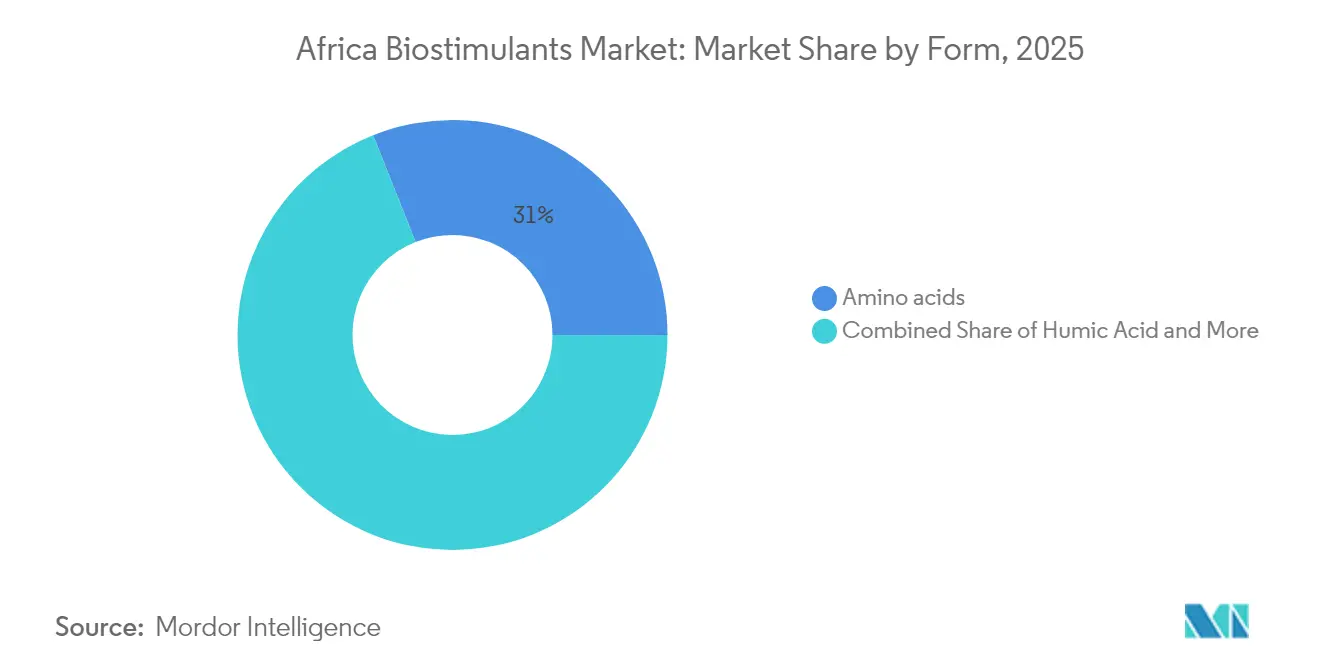
- By form, amino acids led with 31.02% revenue share in 2025, while humic acid is forecast to advance at a 10.12% CAGR to 2031.
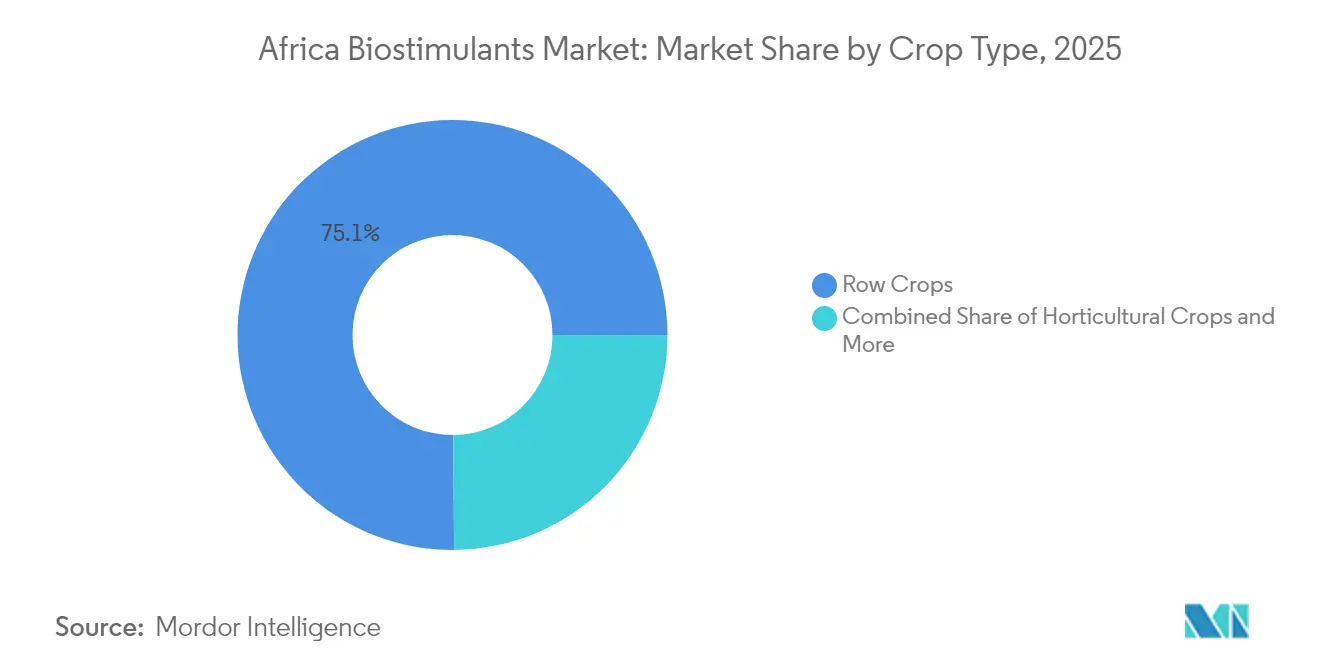
- By crop type, row crops accounted for 75.12% share of the Africa biostimulants market size in 2025, where as horticultural crops are progressing at a 9.36% CAGR through 2031.
- By geography, Nigeria held 7.11% of the Africa biostimulants market share in 2025, while Egypt is projected to expand at a 10.42% CAGR through 2031.
Note: Market size and forecast figures in this report are generated using Mordor Intelligence’s proprietary estimation framework, updated with the latest available data and insights as of 2026.
Africa Biostimulants Market Trends and Insights
Drivers Impact Analysis*
| Driver | (~) % Impact on CAGR Forecast | Geographic Relevance | Impact Timeline |
|---|---|---|---|
| Rising adoption of sustainable agriculture practices | +2.1% | Global, with highest impact in South Africa, Kenya, Egypt | Long term (≥ 4 years) |
| Government incentives supporting organic farming in Africa | +1.8% | Continental, strongest in Nigeria, Ghana, South Africa | Medium term (2-4 years) |
| Increasing demand for high-value export horticultural produce | +1.5% | Egypt, Kenya, South Africa, Morocco | Short term (≤ 2 years) |
| Improved distribution networks for specialty inputs | +1.2% | East Africa core, spill-over to West Africa | Medium term (2-4 years) |
| Expansion of regenerative-agriculture investment funds | +0.9% | Continental, early gains in Kenya, Nigeria, South Africa | Long term (≥ 4 years) |
| Scale-up of microbial-consortia research for tropical soils | +0.7% | Sub-Saharan Africa, research hubs in South Africa, Kenya | Long term (≥ 4 years) |
| Source: Mordor Intelligence | |||
Rising Adoption of Sustainable Agriculture Practices
The African Union's Comprehensive Africa Agricultural Development Programme (CAADP) Strategy and Action Plan 2026-2035 establishes continental policy frameworks that prioritize soil health and sustainable intensification, creating institutional demand for biological inputs, including biostimulants. The strategy's emphasis on tripling fertilizer production capacity while promoting environmental sustainability positions biostimulants as complementary solutions that enhance nutrient use efficiency without increasing chemical residues. This policy alignment drives adoption through public procurement programs and extension services that increasingly recommend biological inputs for smallholder farmers. The Nairobi Declaration from the 2024 Africa Fertilizer and Soil Health Summit further reinforces this commitment by establishing soil health as a continental priority, with accompanying action plans that explicitly support the integration of biological soil amendments. Research institutions across the continent are responding with targeted programs, such as the University of the Free State's studies on biostimulant efficacy in South African maize systems, which provide the empirical foundation for scaling adoption among commercial and smallholder producers.
Government Incentives Supporting Organic Farming in Africa
Policy frameworks across African countries increasingly incorporate financial incentives and regulatory support for organic and biological inputs, creating market pull for biostimulant adoption. The Economic Community of West African States (ECOWAS) pesticide registration regulation framework establishes fast-track approval pathways for low-risk biological substances, reducing market entry barriers and compliance costs for biostimulant manufacturers. South Africa's updated agricultural remedy registration tariffs, implemented in January 2025, introduce preferential fee structures for biological products, making biostimulant registration more economically viable compared to synthetic alternatives. Nigeria's establishment of the International Institute of Tropical Agriculture (IITA) Regional Hub for Fertilizer and Soil Health in June 2024 represents a USD 12.5 million continental investment in biological soil health solutions, providing technical support and demonstration programs that accelerate farmer adoption. These policy measures address historical barriers to biological input adoption by reducing regulatory complexity and providing institutional support for farmer education and product validation.
Increasing Demand for High-Value Export Horticultural Produce
Export market requirements for residue-free produce drive premium pricing for crops grown with biological inputs, creating economic incentives for biostimulant adoption in horticultural systems. Kenya's horticultural exports, valued at over USD 1.3 billion annually, increasingly require compliance with stringent European Union pesticide residue limits, making biostimulants attractive for maintaining crop quality while meeting export standards. The Del Monte-Vellsam biofertilizer plant in Kenya, operational since June 2024, exemplifies how export-oriented producers integrate biological inputs to enhance product quality and market access. Egypt's expanding agricultural trade missions to African countries in 2025 promote technology transfer and market development for specialty inputs, including biostimulants, that support high-value crop production. This export orientation creates demonstration effects as successful producers showcase the quality and yield benefits of biological inputs to neighboring farmers and regions.
Improved Distribution Networks for Specialty Inputs
Strategic partnerships between global biologicals companies and local distributors address the critical last-mile delivery challenges that historically limited biostimulant market penetration in rural African markets. Koppert's expansion of its African distribution network, supported by local partnerships and technical training programs, demonstrates how international companies adapt their supply chains to reach smallholder farmers effectively. The company's 2024 sustainability report highlights support for 21,570 smallholder farmers through 27 global projects focused on agroecology, indicating significant investment in farmer education and product adoption programs. Omnia Holdings' expansion of its AgriBio division in November 2024 strengthens regional distribution capabilities for biological inputs across Southern Africa, leveraging existing fertilizer distribution channels to introduce biostimulant products. These distribution improvements reduce product costs and increase farmer access, particularly in remote areas where specialty input availability was previously limited.[2]Source: Koppert, “2024 Sustainability Report,” koppert.com
Restraints Impact Analysis*
| Restraint | (~) % Impact on CAGR Forecast | Geographic Relevance | Impact Timeline |
|---|---|---|---|
| Limited farmer awareness and training programs | -1.8% | Continental, highest impact in rural West and Central Africa | Medium term (2-4 years) |
| High product cost versus conventional fertilizers | -1.5% | Continental, particularly affecting smallholder segments | Short term (≤ 2 years) |
| Inconsistent product quality from counterfeit imports | -1.1% | West Africa, East Africa trade corridors | Short term (≤ 2 years) |
| Gaps in region-specific performance data | -0.8% | Sub-Saharan Africa, excluding South Africa research hubs | Medium term (2-4 years) |
| Source: Mordor Intelligence | |||
Limited Farmer Awareness and Training Programs
Extension service capacity constraints across African countries limit the technical support necessary for effective biostimulant adoption, particularly among smallholder farmers who represent the majority of agricultural producers. Research from Ghanaian farming systems indicates that farmer willingness to pay for specialty inputs correlates directly with technical knowledge and demonstration plot exposure, yet extension worker-to-farmer ratios remain inadequate across most African countries. The complexity of biostimulant application timing and integration with existing fertilizer programs requires specialized training that exceeds the capacity of traditional extension systems. Tanzania's experience with smallholder cost-benefit analysis reveals that farmers who receive comprehensive technical support achieve significantly higher returns from biological inputs compared to those relying solely on product labels or basic recommendations. This knowledge gap creates adoption barriers that persist despite product availability and economic incentives, requiring sustained investment in farmer education and demonstration programs to overcome.
High Product Cost Versus Conventional Fertilizers
Price premiums for biostimulant products relative to conventional fertilizers create adoption barriers, particularly for smallholder farmers operating under tight economic constraints. Ethiopian wheat farming profitability studies demonstrate that while biological inputs can improve yields and soil health, the initial cost burden often exceeds smallholder cash flow capacity, necessitating credit access or subsidy support for widespread adoption. Malawi's fertilizer profitability evidence indicates that farmers prioritize immediate nutrient availability over long-term soil health benefits when facing capital constraints, creating market resistance to biostimulant adoption despite proven agronomic benefits. These economic barriers require innovative financing mechanisms or targeted subsidies to overcome price sensitivity and enable market expansion among cost-conscious farmer segments.
*Our forecasts treat driver/restraint impacts as directional, not additive. The impact forecasts reflect baseline growth, mix effects, and variable interactions.
Segment Analysis
By Form: Amino Acids Lead Market Share
Amino acids dominate the Africa biostimulants market with a 31.02% share in 2025 and humic acid emerges as the fastest-growing segment with a 10.12% CAGR forecast for 2026-2031. Amino acids growth is driven by their proven efficacy in enhancing nutrient uptake and stress tolerance across diverse crop systems and agroecological zones. The effectiveness of amino acid-based biostimulants in improving the efficiency of other agricultural inputs, such as pesticides and fertilizers, has further cemented their position as the leading segment in the market. The humic acid market is supported by increasing recognition of its soil conditioning properties and compatibility with existing fertilizer programs.
Fulvic acid maintains steady demand in premium horticultural applications, while seaweed extracts gain traction in coastal regions where kelp-based products like KELPAK demonstrate consistent performance in field trials. Seaweed extract-based biostimulants have established a strong presence, particularly in coastal regions, offering unique benefits through their rich composition of nutrients, amino acids, and growth-promoting compounds.Other biostimulants category captures emerging technologies including microbial consortia and plant growth-promoting rhizobacteria, representing innovation opportunities as research institutions develop region-specific inoculants for tropical soil conditions. Protein hydrolysates, though representing a smaller market share, are valued for their role in enhancing germination, productivity, and crop quality.


By Crop Type: Row Crops Dominate Applications
In 2025, row crops dominate Africa's biostimulants market, holding a 75.12% share. This trend underscores the continent's emphasis on staple grain production and the benefits of applying biological inputs over vast acreages. Horticultural crops, however, are emerging as the fastest-growing segment, projected to expand at a 9.36% CAGR through 2031. This growth is buoyed by export market premiums for residue-free produce and the elevated value per hectare, which justifies the higher costs of premium inputs. Key staples like maize, wheat, and rice are increasingly turning to biostimulants, that boosts nutrient efficiency and also bolster stress tolerance. Meanwhile, cash crops such as cotton, coffee, and cocoa are witnessing a tailored demand for biostimulants. .
Controlled studies by the University of the Free State on maize biostimulant applications lend credible weight to the adoption of these treatments in row crops. Their research highlights that treatments with brassinosteroids and seaweed extracts can bolster plant physiology and aid stress recovery, especially in glyphosate-resistant maize varieties. The growth of horticultural crops is largely fueled by Kenya's burgeoning export vegetable sector, Egypt's vibrant fruit and vegetable markets, and South Africa's renowned wine and citrus industries. Here, biostimulants play a pivotal role, enhancing quality and mitigating stress, thus justifying their premium costs. For cash crops, established value chains and processing ties mean that the industry can comfortably absorb these premium input costs, owing to the resultant quality enhancements and superior processing traits.
Geography Analysis
Nigeria dominates the continental biostimulants landscape with an 7.11% market share in 2025, while Egypt emerges as the fastest-growing market with a projected 10.42% CAGR through 2031. The region benefits from increasing government support for agricultural modernization, as demonstrated by Nigeria's establishment of the IITA Regional Hub for Fertilizer and Soil Health in June 2024, which represents a USD 12.5 million investment in biological soil health solutions African Development Bank.
Egypt's growth is driven by government initiatives supporting agricultural export competitiveness and water-efficient farming practices that align with biostimulant benefits. Its established research infrastructure and export-oriented agriculture provide validation platforms for biostimulant efficacy, generating performance data that supports broader continental adoption. The active promotion of organic cultivation through initiatives has created a favorable environment for biostimulant adoption. South Africa's regulatory leadership in biological product registration, including updated tariff structures implemented in January 2025 that favor low-risk biological substances, creates a supportive environment for market development and serves as a model for other African countries developing biostimulant frameworks.
Competitive Landscape
The Africa biostimulants market exhibits moderate concentration, as the top 5 players control 24.5% of market share, creating opportunities for both established leaders and emerging disruptors to capture growth. The market structure is evolving with international companies establishing local manufacturing facilities and acquiring regional players to strengthen their foothold.
Market leaders employ diverse strategies including local manufacturing partnerships, distribution network expansion, and farmer education programs to build market presence and technical credibility. Strategic partnerships dominate competitive dynamics, as evidenced by Andermatt-Novonesis Cell-Tech's collaboration with soy farmers across multiple African countries and Bayer's bioinsecticide agreement with AlphaBio Control in April 2024, demonstrating how global companies access local markets through technology transfer and joint development programs.
Technology adoption patterns favor companies that integrate digital agronomy platforms with biological products, enabling precision application and performance monitoring that justify premium pricing and build farmer loyalty. The East African Business and Chemical Lab's updated 2025 product catalogue demonstrates how regional suppliers diversify product offerings to include seaweed extracts, humic acids, and microbial inoculants, indicating active competition from local players who understand regional market conditions and farmer preferences.
Africa Biostimulants Industry Leaders
Biolchim SPA
Coromandel International Ltd
Koppert Biological Systems Inc.
T. Stanes and Company Limited
Trade Corporation International
- *Disclaimer: Major Players sorted in no particular order

Recent Industry Developments
- March 2025: REKA Group B.V. has taken over the management of Koppert's biostimulant and fertilizer portfolio, while Koppert's subsidiaries will still handle the distribution of these products.
- December 2024: Afreximbank partnered with OPAIA Group on a USD 2.0 billion fertilizer complex in Soyo, Angola. The project allocates USD 1.4 billion in debt to build 1,400 MT per day ammonia and urea lines, improving regional input logistics that also facilitate biological product distribution.
- October 2024: Biota Nutri and Koppert Kenya published positive field data on calcium and iron biostimulant formulations that improved nutrient status and crop quality in Kenyan vegetable systems, paving the way for commercial roll-out in East Africa


Africa Biostimulants Market Report Scope
| Amino Acids |
| Fulvic Acid |
| Humic Acid |
| Protein Hydrolysates |
| Seaweed Extracts |
| Other Biostimulants |
| Cash Crops |
| Horticultural Crops |
| Row Crops |
| Egypt |
| Nigeria |
| South Africa |
| Rest of Africa |
| Form | Amino Acids |
| Fulvic Acid | |
| Humic Acid | |
| Protein Hydrolysates | |
| Seaweed Extracts | |
| Other Biostimulants | |
| Crop Type | Cash Crops |
| Horticultural Crops | |
| Row Crops | |
| Country | Egypt |
| Nigeria | |
| South Africa | |
| Rest of Africa |


Market Definition
- AVERAGE DOSAGE RATE - The average application rate is the average volume of biostimulants applied per hectare of farmland in the respective region/country.
- CROP TYPE - Crop type includes Row crops (Cereals, Pulses, Oilseeds), Horticultural Crops (Fruits and vegetables) and Cash Crops (Plantation Crops, Fibre Crops and Other Industrial Crops)
- FUNCTION - The Crop Protection function of agirucultural biological include products that prevent or control various biotic and abiotic stress.
- TYPE - Biostimulants boost crop growth and yield by preventing or controlling various abiotic stresses.
| Keyword | Definition |
|---|---|
| Cash Crops | Cash crops are non-consumable crops sold as a whole or part of the crop to manufacture end-products to make a profit. |
| Integrated Pest Management (IPM) | IPM is an environment-friendly and sustainable approach to control pests in various crops. It involves a combination of methods, including biological controls, cultural practices, and selective use of pesticides. |
| Bacterial biocontrol agents | Bacteria used to control pests and diseases in crops. They work by producing toxins harmful to the target pests or competing with them for nutrients and space in the growing environment. Some examples of commonly used bacterial biocontrol agents include Bacillus thuringiensis (Bt), Pseudomonas fluorescens, and Streptomyces spp. |
| Plant Protection Product (PPP) | A plant protection product is a formulation applied to crops to protect from pests, such as weeds, diseases, or insects. They contain one or more active substances with other co-formulants such as solvents, carriers, inert material, wetting agents or adjuvants formulated to give optimum product efficacy. |
| Pathogen | A pathogen is an organism causing disease to its host, with the severity of the disease symptoms. |
| Parasitoids | Parasitoids are insects that lay their eggs on or within the host insect, with their larvae feeding on the host insect. In agriculture, parasitoids can be used as a form of biological pest control, as they help to control pest damage to crops and decrease the need for chemical pesticides. |
| Entomopathogenic Nematodes (EPN) | Entomopathogenic nematodes are parasitic roundworms that infect and kill pests by releasing bacteria from their gut. Entomopathogenic nematodes are a form of biocontrol agents used in agriculture. |
| Vesicular-arbuscular mycorrhiza (VAM) | VAM fungi are mycorrhizal species of fungus. They live in the roots of different higher-order plants. They develop a symbiotic relationship with the plants in the roots of these plants. |
| Fungal biocontrol agents | Fungal biocontrol agents are the beneficial fungi that control plant pests and diseases. They are an alternative to chemical pesticides. They infect and kill the pests or compete with pathogenic fungi for nutrients and space. |
| Biofertilizers | Biofertilizers contain beneficial microorganisms that enhance soil fertility and promote plant growth. |
| Biopesticides | Biopesticides are natural/bio-based compounds used to manage agricultural pests using specific biological effects. |
| Predators | Predators in agriculture are the organisms that feed on pests and help control pest damage to the crops. Some common predator species used in agriculture include ladybugs, lacewings, and predatory mites. |
| Biocontrol agents | Biocontrol agents are living organisms used to control pests and diseases in agriculture. They are alternatives to chemical pesticides and are known for their lesser impact on the environment and human health. |
| Organic Fertilizers | Organic fertilizer is composed of animal or vegetable matter used alone or in combination with one or more non-synthetically derived elements or compounds used for soil fertility and plant growth. |
| Protein hydrolysates (PHs) | Protein hydrolysate-based biostimulants contain free amino acids, oligopeptides, and polypeptides produced by enzymatic or chemical hydrolysis of proteins, primarily from vegetal or animal sources. |
| Biostimulants/Plant Growth Regulators (PGR) | Biostimulants/Plant Growth Regulators (PGR) are substances derived from natural resources to enhance plant growth and health by stimulating plant processes (metabolism). |
| Soil Amendments | Soil Amendments are substances applied to soil that improve soil health, such as soil fertility and soil structure. |
| Seaweed Extract | Seaweed extracts are rich in micro and macronutrients, proteins, polysaccharides, polyphenols, phytohormones, and osmolytes. These substances boost seed germination and crop establishment, total plant growth and productivity. |
| Compounds related to biocontrol and/or promoting growth (CRBPG) | Compounds related to biocontrol or promoting growth (CRBPG) are the ability of a bacteria to produce compounds for phytopathogen biocontrol and plant growth promotion. |
| Symbiotic Nitrogen-Fixing Bacteria | Symbiotic nitrogen-fixing bacteria such as Rhizobium obtain food and shelter from the host, and in return, they help by providing fixed nitrogen to the plants. |
| Nitrogen Fixation | Nitrogen fixation is a chemical process in soil which converts molecular nitrogen into ammonia or related nitrogenous compounds. |
| ARS (Agricultural Research Service) | ARS is the U.S. Department of Agriculture's chief scientific in-house research agency. It aims to find solutions to agricultural problems faced by the farmers in the country. |
| Phytosanitary Regulations | Phytosanitary regulations imposed by the respective government bodies check or prohibit the importation and marketing of certain insects, plant species, or products of these plants to prevent the introduction or spread of new plant pests or pathogens. |
| Ectomycorrhizae (ECM) | Ectomycorrhiza (ECM) is a symbiotic interaction of fungi with the feeder roots of higher plants in which both the plant and the fungi benefit through the association for survival. |


Research Methodology
Mordor Intelligence follows a four-step methodology in all our reports.
- Step-1: Identify Key Variables: In order to build a robust forecasting methodology, the variables and factors identified in Step-1 are tested against available historical market numbers. Through an iterative process, the variables required for market forecast are set and the model is built on the basis of these variables.
- Step-2: Build a Market Model: Market-size estimations for the forecast years are in nominal terms. Inflation is not a part of the pricing, and the average selling price (ASP) is kept constant throughout the forecast period.
- Step-3: Validate and Finalize: In this important step, all market numbers, variables and analyst calls are validated through an extensive network of primary research experts from the market studied. The respondents are selected across levels and functions to generate a holistic picture of the market studied.
- Step-4: Research Outputs: Syndicated Reports, Custom Consulting Assignments, Databases & Subscription Platforms.


