
Market Overview
| Study Period | 2021 - 2031 |
|---|---|
| Forecast Data Period | 2026 - 2031 |
| Historical Data Period | 2021 - 2024 |
| Growth Rate | 5.55 % |
| Market Concentration | Medium |
Major Players *Disclaimer: Major Players sorted in no particular order Image © Mordor Intelligence. Reuse requires attribution under CC BY 4.0. | |
Africa Oil And Gas Market Analysis by Mordor Intelligence
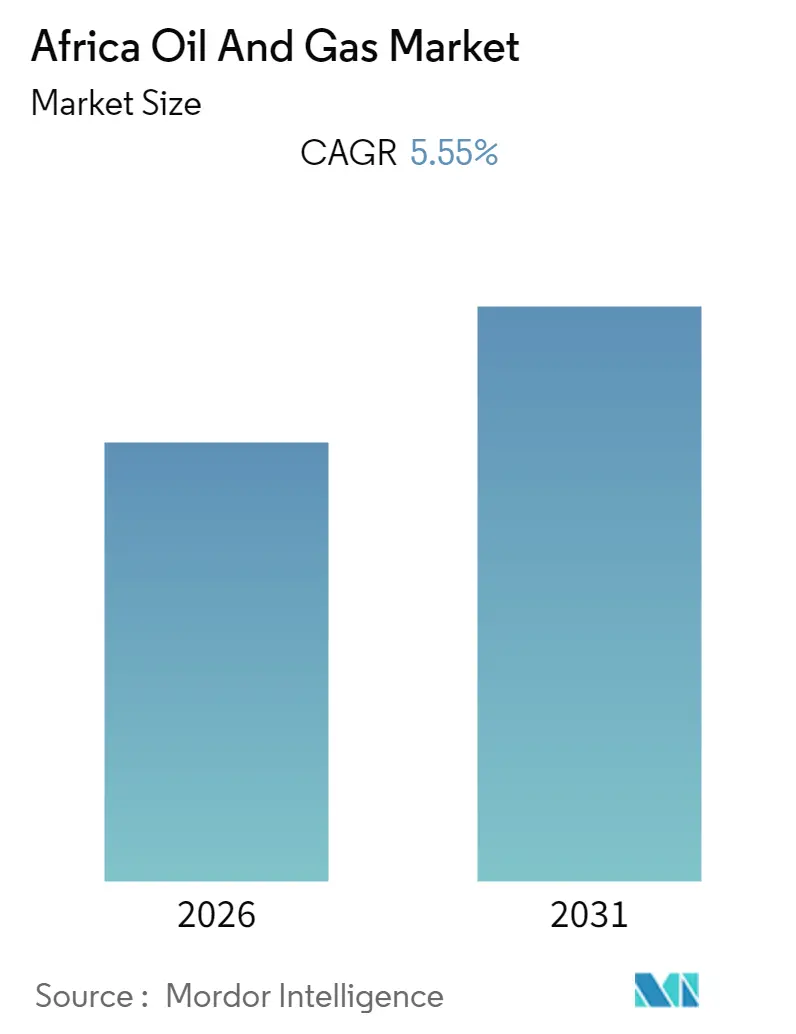
The Africa Oil and Gas Market size is expected to register a CAGR of 5.55% during the forecast period.
- Offshore upstream activities are expected to dominate the market due to their relative insulation from vandalism. These sites are comparatively less accessible for the terrorists and vandalism groups in the region, such as the attack on the Anadarko Petroleum LPG project in northern Mozambique.
- The recent offshore discovery of oil and gas in Senegal showcases the potential of the West African offshore region, which is largely untapped, for which the National Oil Company of Senegal, PETROSEN, officially launched the licensing round for 12 blocks in January 2020. Also, several other offshore discoveries are recorded in the region, which is expected to create a lucrative opportunity for oil and gas upstream companies to invest in this region.
- Nigeria dominated the market due to many upstream projects due to operators gaining confidence and increased production, with a rise in crude oil prices after a slump. Therefore, Nigeria is expected to dominate the market during the forecast period.
Note: Market size and forecast figures in this report are generated using Mordor Intelligence’s proprietary estimation framework, updated with the latest available data and insights as of 2026.
Africa Oil And Gas Market Trends and Insights
Upstream Segment to dominate the Market
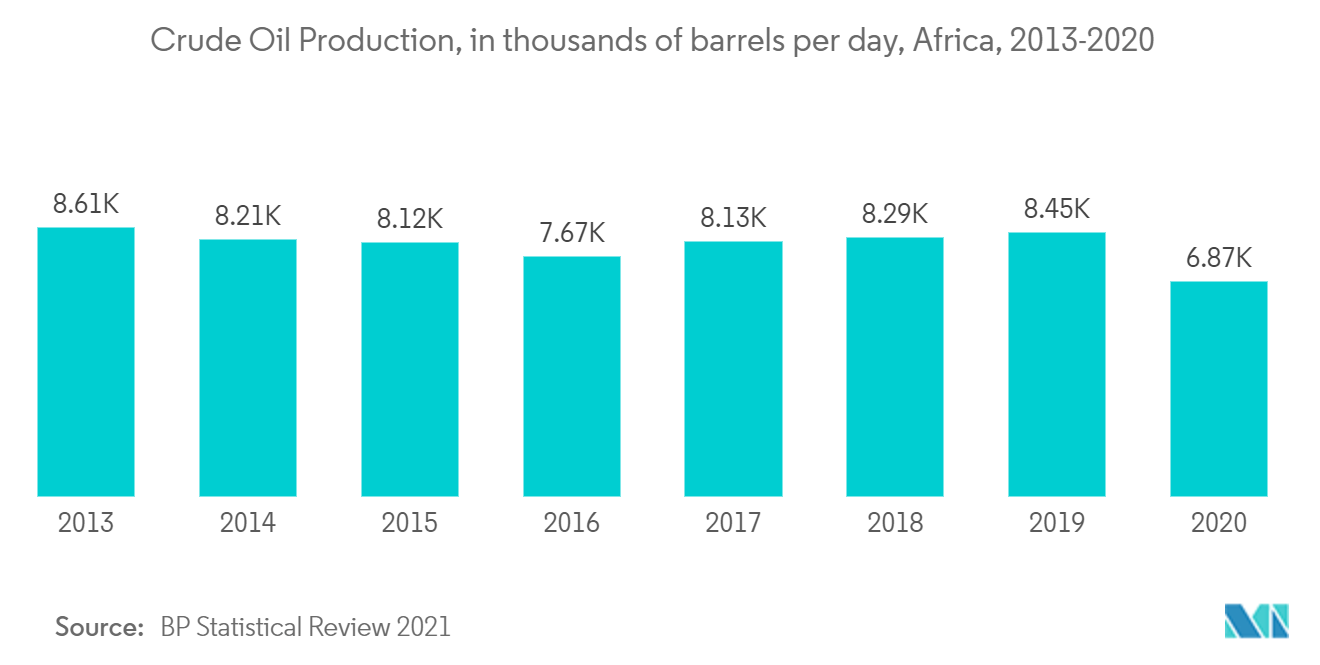
- Africa accounted for roughly eight per cent of the global oil output in 2020. Nearly 6865 thousand barrels per day of oil is produced on the continent that same year. The region generated 6.9 million barrels daily, the lowest production level since 2000. Crude oil and natural gas production is distributed widely in Africa but heavily concentrated in the West and North regions.
- West Africa's offshore oil and gas industry continues to expand, albeit not very fast, opening up more market opportunities. West Africa's offshore deep and ultra-deep space has continued to attract oil explorers and producers to expand their operations, especially in Southern and Western Africa, where significant projects have either started or have been unveiled, awaiting resource appraisal and development.
- The growth of offshore exploration and production activities has been mainly driven by the efforts of governments in their region to provide critical incentives and supporting policies to unlock the investment opportunity, as well as the growing number of international oil and gas companies interested in exploring alternative fields to replace the maturing offshore producing sites in countries such as Nigeria and Ghana.
- In December 2021, PGS secured a contract from an unnamed company for a 3D seismic survey in offshore West Africa. Similarly, in August 2021, the shallow water drilling contractor Borr Drilling secured awards for two offshore rigs in Africa for two years plus options.
- Furthermore, several long-term tenders for the development of reserves have been issued in Angola, Ghana, and Nigeria. The offshore region has also recently witnessed successful discoveries, such as Eni's recent finding in offshore Cote d'Ivoire and Ghana. Such discoveries will require an additional appraisal, and development activities in the region are likely to attract investors, thereby driving the market demand during the forecast period.
- Thus, based on the factors mentioned above, the upstream segment is expected to dominate the African oil and gas market during the forecast period.
Nigeria is Expected to Dominate the Market
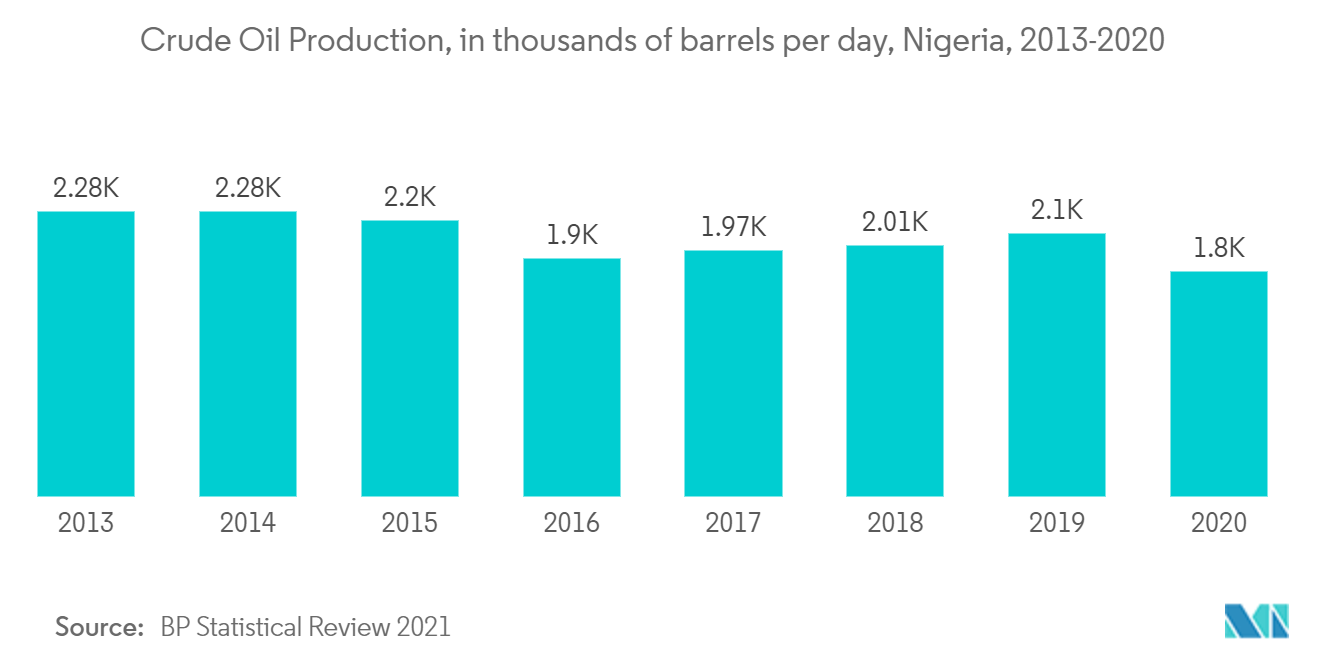
- Nigeria is one of Africa's largest countries in terms of proven oil and gas reserves. As of 2020, Nigeria's crude oil and natural gas reserves reached 36.9 thousand million barrels and 5.5 trillion cubic meters, respectively. However, crude oil production in the country has been witnessing a declining trend recently, from its peak at 2,487 thousand barrels daily in 2004 to 1,798 thousand barrels in 2020. This has been mainly due to maturing oil fields and a lack of new foreign investment in the country.
- Nigeria is one of the largest and oldest oil producers in Africa. The oil and gas sector is one of the most important sectors in the country's economy, accounting for more than 90% of the country's exports and 80% of the federal government's revenue. As of 2020, Nigeria had the largest oil and gas production in the West African region, with around 86.9 million tons of crude oil and 49.4 billion cubic meters of gas.
- Furthermore, the country plans to become an export hub in Africa by exporting not only to regional countries but also to other Asian countries like India and China, where the gas demand is anticipated to increase in the coming years, resulting in increased upstream activities in the region.
- In January 2022, Nigerian National Petroleum Company Ltd secured a USD 5 billion corporate finance commitment from the African Export-Import Bank to fund major investments in the Nigerian upstream sector. This is likely to aid the growth of the market during the forecast period.
- Therefore, based on the above-mentioned factors, Nigeria is expected to dominate the African oil and gas market during the forecast period.
Regulatory Landscape
Regulatory oversight in Africa is largely country-specific, with recent changes concentrated in major producing and frontier basins. In Nigeria, the Petroleum Industry Act (PIA) continues to anchor upstream licensing and administration through the Nigerian Upstream Petroleum Regulatory Commission (NUPRC), and a 2026 Presidential Executive Order was issued to safeguard federation oil and gas revenues and provide additional regulatory clarity for industry operations.
In Mozambique, the Assembly of the Republic approved a new Oil Law in May 2026, strengthening the National Petroleum Institute (INP) with expanded supervisory powers, including tighter control over recoverable costs and concession budgets. South Africa enacted the Upstream Petroleum Resources Development Act 23 of 2024 to govern upstream licensing, including provisions enabling non-exclusive multi-client speculative surveys. In Gabon, plans announced in October 2025 aim to split its hydrocarbons framework into separate Petroleum and Gas Codes, with drafting activity continuing into 2026.
Value Chain Analysis
The Africa oil and gas value chain covers offshore and onshore exploration and production, field development and drilling services, crude and gas gathering and processing, and transportation through pipelines and marine export systems, followed by downstream refining and product distribution. In Nigeria and other major producing markets, operators have been emphasizing infill drilling and life-extension on existing deepwater assets (for example, activity around OML 138 and Erha), which reinforces the role of subsea services, offshore logistics, and brownfield engineering in sustaining upstream supply.
On the gas side, value-chain focus is increasingly visible in infrastructure that supports both domestic utilization and export pathways, including gas delivery networks, local liquefaction concepts, and cross-border pipeline systems tied to power and industrial demand. Regional integration initiatives such as the Nigeria-Morocco Gas Pipeline program also illustrate how midstream buildout can create linkages to petrochemicals and industrial corridors by connecting upstream gas to multiple end markets across West Africa and beyond.
Competitive Landscape
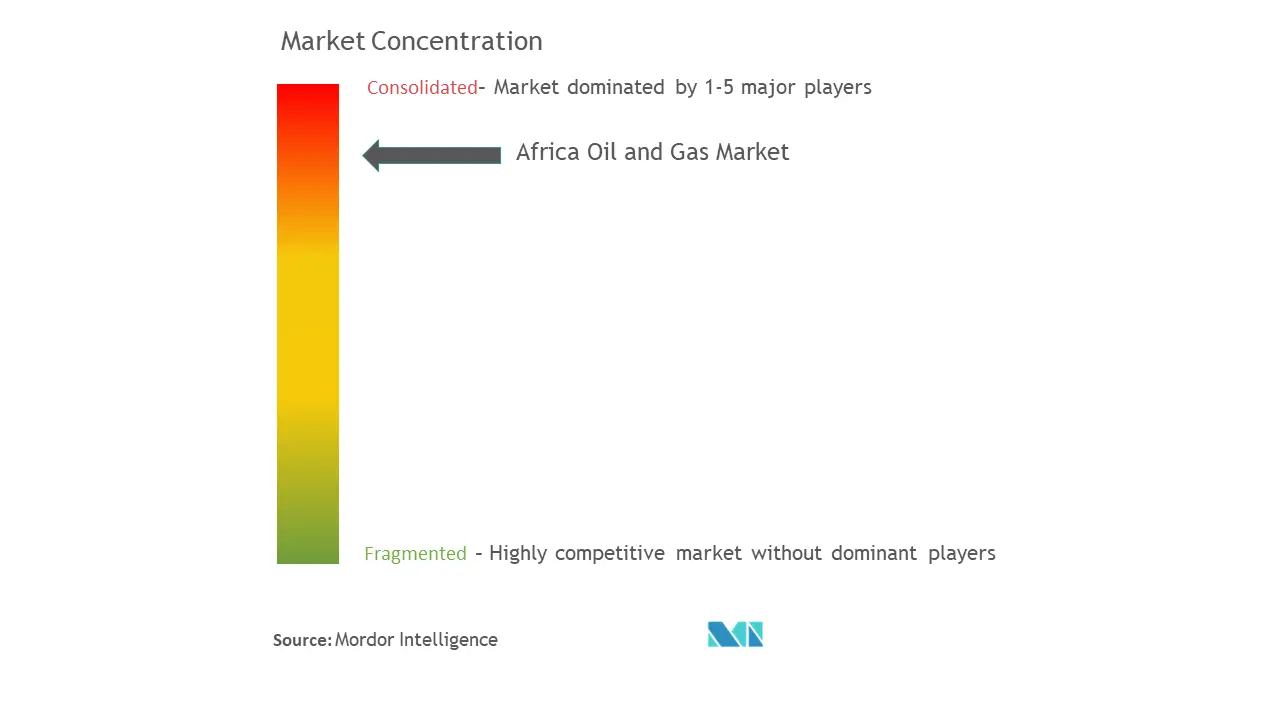
The African Oil and Gas market is moderately consolidated. Some of the key players in the market include Shell PLC, TotalEnergies SE, Eni SpA, Exxon Mobil Corporation, and Nigerian National Petroleum Corporation.
Africa Oil And Gas Industry Leaders
-
TotalEnergies SE
-
Eni SpA
-
Exxon Mobil Corporation
-
Nigerian National Petroleum Corporation
-
Shell PLC
- *Disclaimer: Major Players sorted in no particular order
Market Opportunities and Future Outlook
Deepwater redevelopment and incremental capacity additions in established producing countries are creating near-term demand for drilling, subsea, FPSO-related services, and brownfield EPC work. Nigeria is providing supporting evidence through multiple deepwater initiatives, including the July 2026 final investment decision for a USD 1 billion Usan infill drilling program in OML 138 (cited as adding 40,000 bpd) and ongoing industry work around large-scale projects such as Bonga Southwest Aparo, framed as a multi-billion-dollar deepwater investment program supported by fiscal measures.
Gas monetization and regional midstream connectivity are also active areas for investment where government-backed programs and intergovernmental agreements are in motion. In July 2026, ECOWAS member states signed an intergovernmental agreement for the Nigeria-Morocco Atlantic Gas Pipeline, described as a USD 25 billion project designed for 30 bcm per year across 13 countries, which expands the addressable market for gas transportation, compression, metering, and downstream industrial offtake development. In East and Southern Africa, Mozambique LNG progress, including TotalEnergies resuming work in January 2026 and stated intent for ExxonMobil to take a Rovuma LNG FID decision in H2 2026, supports demand for security-resilient offshore development, construction services, and associated supply-chain capacity.
Recent Industry Developments
- July 2026: Shell PLC: The Federal Government approved an enhanced production-linked tax credit of $11.50 per barrel to unlock the Bonga Southwest Aparo deepwater project, aiming to attract $20 billion in investment. This incentive improves deepwater project economics and elevates Nigeria's offshore growth trajectory and FID activity in the market.
- July 2026: Exxon Mobil Corporation: Announced a Final Investment Decision FID for a $1 billion infill drilling project at the Usan Field (OML 138), expected to add 40,000 barrels per day to output. The decision signals intensified focus on offshore assets and strengthens near term output and downstream supply stability.
- July 2026: Nigerian National Petroleum Corporation (NNPC) Limited & Seplat Energy: Executed a 15-year gas sale and purchase agreement to supply 200 million standard cubic feet per day to the UTM Floating LNG project. The gas contract advances gas infrastructure monetization and domestic to export gas integration, influencing regional gas market dynamics.
Research Methodology Framework and Report Scope
Market Definition and Coverage
For this study, the Africa oil and gas market is defined as the value generated across upstream, midstream, and downstream activities, covering field development and production, transportation and processing, and refining and product supply within Africa.
Scope exclusions: We exclude renewable power, mining, and pure utilities activity that is not directly tied to oil and gas value chain revenues.
Segmentation Overview
- By Type
- Upstream
- Midstream
- Downstream
- By Geography
- Algeria
- Nigeria
- Egypt
- Rest of Africa
Data Sources, Market Sizing, and Validation
Desk Research
Desk work starts by mapping the demand and supply signals that can be checked regularly, before we build any forecast logic. We review public datasets such as OPEC and IEA publications, U.S. EIA country and regional series, World Bank macro indicators, and UN Comtrade trade statistics to anchor production, consumption, and trade flows.
To translate activity into market value, we also scan regulator and NOC releases, port and pipeline notices, and project award coverage in reputed press. This helps track sanctioning, delays, and ramp ups. Company filings, investor presentations, and industry association updates are used to confirm capacity additions, utilization direction, and pricing commentary. Where public detail is thin, selected paid subscriptions for company financials and shipment level trade intelligence are used. These sources are illustrative, and many other public documents and databases were also referred to for data collection, validation, and clarification.
Primary Interviews and Surveys
Primary work is used to turn the desk view into realistic assumptions, especially where project timing and realized pricing can drift from public announcements. We speak with operators, service providers, midstream and downstream stakeholders, and country level experts across key producing and consuming sub regions, and then we revisit gaps until the input set is consistent.
Feedback from these discussions is applied to validate run rate volumes, utilization, cost and price pass through behavior, and the likelihood of project start dates. We then check these assumptions against the desk indicators before finalizing the model.
Distribution of primary research fieldwork respondents
| Company type | Respondent position |
|---|---|
| Top tier: 28% | CXOs: 12% |
| Mid tier: 58% | Functional/Unit leaders: 41% |
| Smaller Players: 14% | Managers: 47% |
Market-Sizing & Forecasting
Sizing starts with a top down build where production and refinery throughput indicators are translated into value using a consistent set of price and margin assumptions by activity. From there, the totals are stress tested using selective bottom-up approximations, such as sampled asset and project roll ups, channel checks for refined products, and volume times average realized price benchmarks. These checks adjust for gaps in public reporting.
Key inputs tracked include crude oil production by country, gas production and monetization routes, rig count and offshore activity cues, pipeline and LNG export capacity additions, refinery capacity and utilization, and crude and product price markers used for currency normalized comparisons. Forecasts are prepared using scenario analysis, where base, tighter supply, and slower project timing paths are discussed with experts and then tied back to macro indicators and investment cycles. Where data is missing at the country or segment level, we apply conservative proxy shares anchored to the most recent confirmed volumes, and we document the step so the logic stays repeatable.
Data Validation & Update Cycle
Model outputs are cross checked against independent signals, including project FID timelines, public production guidance, trade balance direction, and major capacity start ups. This helps catch sudden jumps that do not match reality. Variances are investigated through a second analyst review, followed by targeted re contact with sources when a specific country, asset type, or price assumption drives the mismatch.
The study is refreshed annually, and interim updates are made when material events occur such as large project sanctions, geopolitical disruption, or major pricing regime shifts. Before delivery, we run a final data pass so clients receive the latest available view with consistent assumptions carried through the time series.
Mordor Intelligence's Africa Oil and Gas Market Size Measured Against Other Published Estimates
Published market sizes for Africa oil and gas rarely match perfectly, because each publisher makes different choices on what to count and how to price it. The biggest differences usually come from whether the estimate reflects upstream only versus the full chain, how midstream fees are treated, and whether downstream value is counted at wholesale or retail levels.
The main gap comes from what is included around downstream product value and associated midstream services. Here, Mordor Intelligence counts revenues across upstream, midstream, and downstream using consistent country level volume signals and price benchmarks, rather than mixing retail pump value or excluding transport and processing economics.
Benchmark comparison
| Source | Market Size | Gaps in Research Methodology |
|---|---|---|
| Mordor Intelligence | USD 101.75 B (2026) | |
| Industry Portal A | USD 60.16 B (2026) | Often framed closer to upstream activity value, which can undercount midstream and downstream revenues, and it may apply simplified pricing that does not reflect country mix or product spread effects. |
| Energy Brief B | USD 22.00 B (2026) | Represents onshore spending only rather than total market value, so it excludes offshore development, production economics, and downstream value capture, which keeps the figure structurally lower. |
The spread across the three figures is explained mostly by scope, and by whether the number represents total value chain revenue or a narrower spend pool. By keeping inputs tied to observable volumes, capacity, and price markers, and then checking them through expert validation, the final number stays traceable and practical to replicate year over year.
Key Questions Answered in the Report
What is the current Africa Oil and Gas Market size?
The Africa Oil and Gas Market size is estimated at USD 101.75 billion in 2026 and is projected to reach USD 133.3 billion by 2031, registering a CAGR of 5.55% during the forecast period (2026-2031).
Who are the key players in Africa Oil and Gas Market?
TotalEnergies SE, Eni SpA, Exxon Mobil Corporation, Nigerian National Petroleum Corporation and Shell PLC are the major companies operating in the Africa Oil and Gas Market.
What years does this Africa Oil and Gas Market cover?
The report covers the Africa Oil and Gas Market historical market size for years: 2020, 2021, 2022, 2023, 2024 and 2025. The report also forecasts the Africa Oil and Gas Market size for years: 2026, 2027, 2028, 2029, 2030 and 2031.