3D Printing In Aerospace And Defense Market Size and Share
Market Overview
| Study Period | 2020 - 2031 |
|---|---|
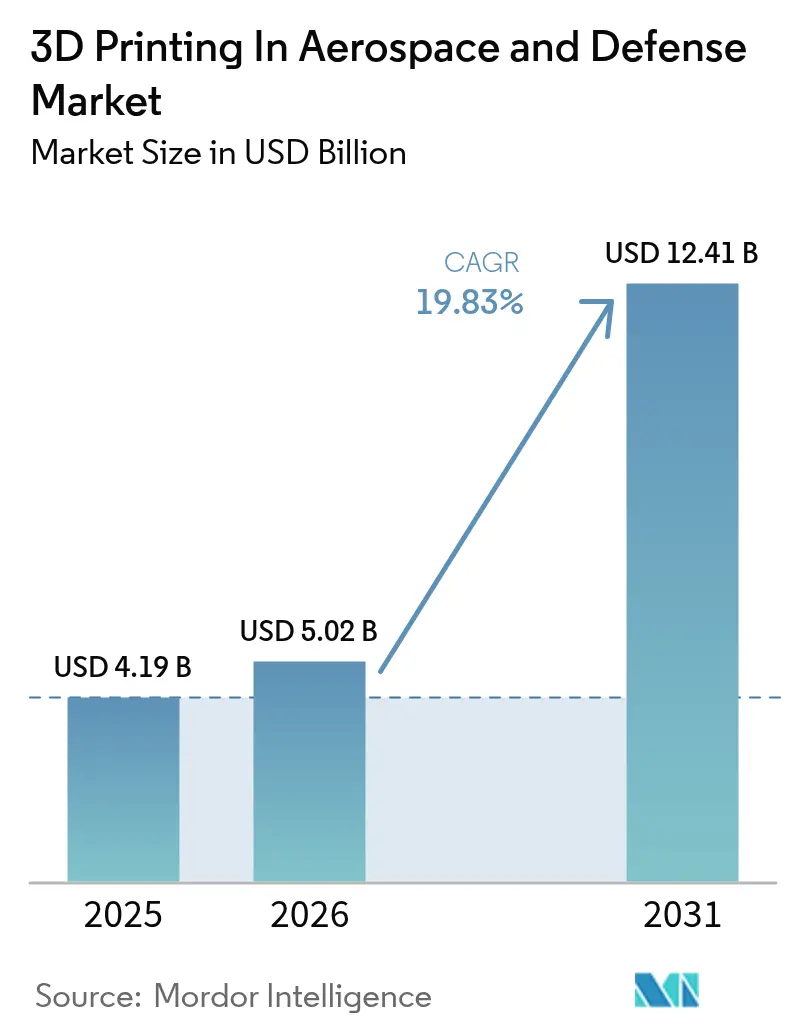
| Market Size (2026) | USD 5.02 Billion |
| Market Size (2031) | USD 12.41 Billion |
| Growth Rate (2026 - 2031) | 19.83% CAGR |
| Fastest Growing Market | Asia-Pacific |
| Largest Market | Europe |
| Market Concentration | Medium |
Major Players *Disclaimer: Major Players sorted in no particular order Image © Mordor Intelligence. Reuse requires attribution under CC BY 4.0. | |
3D Printing In Aerospace And Defense Market Analysis by Mordor Intelligence
3D printing in aerospace and defense market size in 2026 is estimated at USD 5.02 billion, growing from 2025 value of USD 4.19 billion with 2031 projections showing USD 12.41 billion, growing at 19.83% CAGR over 2026-2031. Rapid escalation in fuel-efficiency mandates, the need for resilient supply chains, and the maturation of next-generation manufacturing platforms propel adoption across civil, defense, and space programs. Weight-sensitive propulsion systems, serial production of cabin and structural parts, and faster qualification pathways enabled by artificial intelligence (AI) now converge to shorten time-to-market and compress development costs. Robust public funding, exemplified by the US Air Force Research Laboratory’s USD 235 million additive manufacturing (AM) innovation tranche in 2024 and NASA’s Artemis demand pull to keep North America in a leadership position.[1]Source: Air Force Research Laboratory Press Release, “Manufacturing Technology Program Awards,” afrl.af.mil Material supply agreements focused on titanium, nickel, and aluminum powders underpin ecosystem stability, while falling printer prices open participation to hundreds of tier-2 and tier-3 suppliers. Strategic equipment mergers, notably Nikon’s USD 622 million purchase of SLM Solutions, signal a shift from prototyping toward high-volume production readiness.
Key Report Takeaways
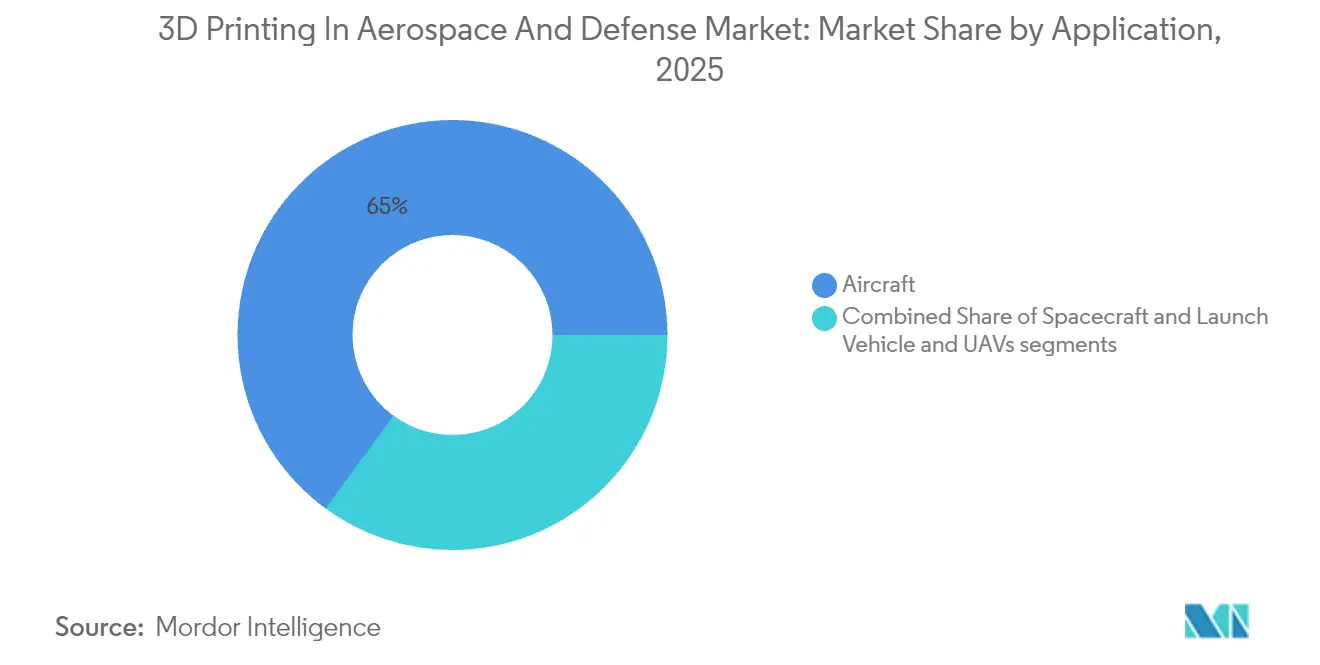
- By application, aircraft accounted for 64.95% of the aerospace 3D printing market share in 2025, while unmanned aerial vehicles (UAVs) posted the fastest 26.10% CAGR through 2031.
- By material, metal alloys captured a 60.05% share of the aerospace 3D printing market in 2025, and specialty and refractory metals are projected to grow at a 24.95% CAGR to 2031.
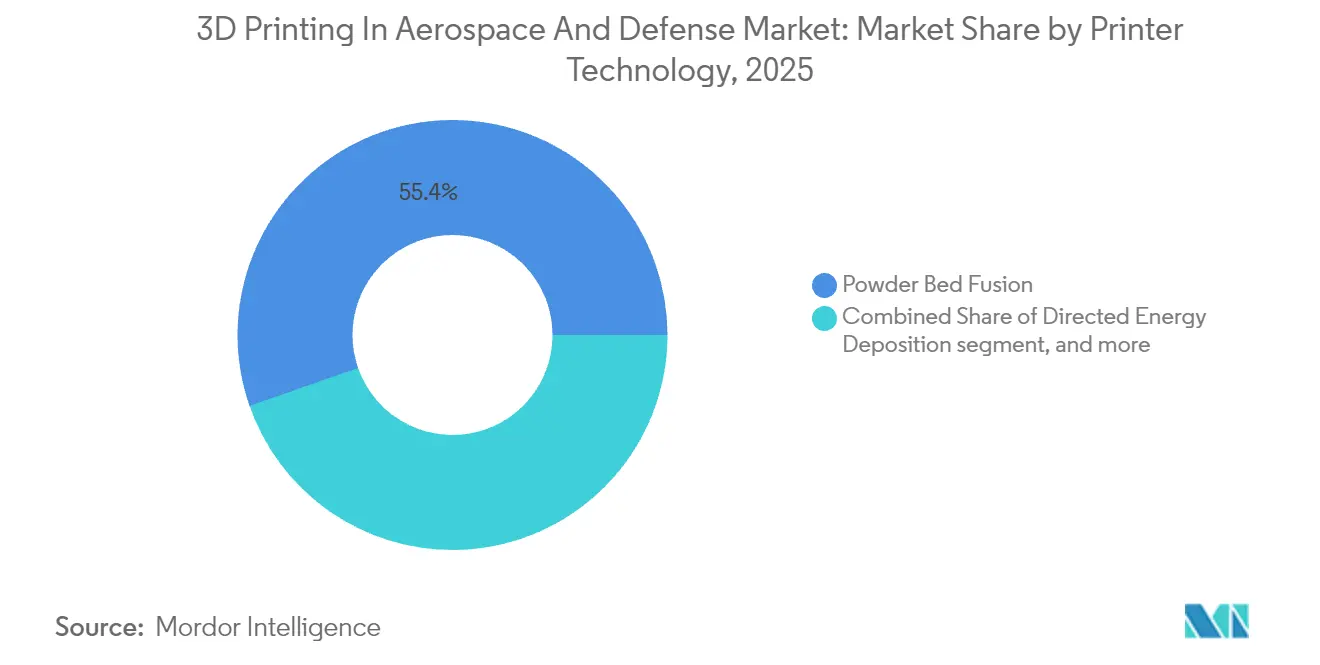
- By printer technology, powder bed fusion led with 55.35% share in 2025; directed energy deposition is advancing at a 23.70% CAGR during 2026-2031.
- By end product, engine components represented a 52.05% share of the aerospace 3D printing market in 2025, while structural components recorded the highest 22.55% CAGR through 2031.
- By printer technology, powdered fusion led with 55.35% share in 2025; directed energy deposition is advancing at a 23.70% CAGR during 2026-2031.
Note: Market size and forecast figures in this report are generated using Mordor Intelligence’s proprietary estimation framework, updated with the latest available data and insights as of 2026.
Global 3D Printing In Aerospace And Defense Market Trends and Insights
Drivers Impact Analysis*
| Driver | (~)% Impact on CAGR Forecast | Geographic Relevance | Impact Timeline |
|---|---|---|---|
| Weight-reduction mandate for fuel-efficient fleets | +3.2% | Global, strongest in North America and Europe | Medium term (2-4 years) |
| Falling metal-printer and powder prices | +2.8% | Global, accelerated adoption in Asia-Pacific | Short term (≤ 2 years) |
| Defense AM-Forward funding lifts SME adoption | +3.5% | North America, expanding to allied nations | Medium term (2-4 years) |
| AI-driven qualification slashes certification lead-times | +2.1% | North America and Europe initially, global expansion | Long term (≥ 4 years) |
| In-orbital printing demand for military space assets | +1.9% | North America, China, emerging in Europe | Long term (≥ 4 years) |
| Sustainability mandates driving engine retrofits | +2.4% | Europe leading, expanding globally | Medium term (2-4 years) |
| Source: Mordor Intelligence | |||


Weight-Reduction Mandate for Fuel-Efficient Fleets
Global aviation faces intensifying carbon goals under ICAO's CORSIA and the European Union's (EU's) Fit for 55 package, spurring manufacturers to cut airframe mass wherever possible. AM enables 40-60% weight reduction while consolidating multipart assemblies, as evidenced by GE Aerospace's LEAP fuel nozzle, which merges 20 pieces into one and trims 25% of the mass.[2]Source: GE Aerospace Communications, “LEAP Engine Fuel Nozzle Overview,” ge.com The B787 program already flies over 300 printed parts, supporting a 20% fuel-burn improvement relative to previous-generation widebodies. Complex lattice structures and internal cooling channels, impossible to machine conventionally, now pass stringent static and fatigue tests, allowing OEMs to push weight targets without compromising safety. Military programs add a tactical dimension because lighter aircraft extend range and loiter time, which is critical for next-generation fighters and long-endurance UAVs.
Falling Metal-Printer and Powder Prices
Average selling prices for production-grade metal printers fell 25-30% between 2022 and 2024, driven by competitive intensity and scaling benefits. Desktop Metal’s Shop System, priced at USD 420,000, comes roughly 40% below 2023 equivalents yet maintains AS9100-ready repeatability for steel, nickel, and titanium parts.[3]Source: Desktop Metal Product Team, “Shop System Specifications,” desktopmetal.com Parallel gains in powder recycling push reuse rates to 95-98%, slicing material spend by double-digit percentages. Höganäs AB’s Swedish capacity expansion, online since late 2024, adds thousands of metric tons of aerospace-grade titanium powder per year and narrows spot-price volatility. Lower capital thresholds enable smaller suppliers to justify AM investments for low-volume, high-mix contracts, especially in the UAV arena, where component variety is high and production runs remain modest.
Defense AM-Forward Funding Lifts SME Adoption
The US Department of Defense (DoD) earmarked USD 350 million in 2024 for AM acceleration, with the Air Force Research Laboratory (AFRL) channeled grants to small and medium enterprises and compressed seven to three years of qualification cycles. Similar initiatives under NATO’s Defence Innovation Accelerator and the UK’s Defence & Security Accelerator funnel complementary funds to allied supply bases. Financial incentives extend beyond direct cash: loan guarantees, fast-track contracting, and tax offsets lower perceived risk. Resulting supplier diversity strengthens the aerospace 3D printing market by expanding certified capacity for flight hardware at multiple tiers, making the defense industrial base more resilient.
AI-Driven Qualification Slashes Certification Lead-Times
AI models forecast material behavior with 95% accuracy, allowing regulators to accept virtual data in partial substitution for exhaustive physical testing. The FAA and NASA jointly demonstrated an eight-to-twelve-month approval route for printed brackets versus nearly two years under legacy methods. Honeywell reports 99.7% first-pass yield on turbine shrouds after embedding real-time anomaly detection powered by machine learning, eliminating costly scrap and rework. Europe echoes the trend; EASA’s latest CS-25 amendment lets AI-validated simulations offset 30% of test articles, spurring faster rollouts in A320neo and A350 lines. Virtual twins further shorten iterative design loops, pushing the aerospace 3D printing market toward genuine production cadence rather than lengthy prototyping cycles.
Restraints Impact Analysis*
| Restraint | (~)% Impact on CAGR Forecast | Geographic Relevance | Impact Timeline |
|---|---|---|---|
| High capital and powder costs for production-grade metal AM | -2.8% | Global, most acute in developing markets | Short term (≤ 2 years) |
| Stringent aerospace qualification timelines | -3.1% | Global, varying by regulatory jurisdiction | Medium term (2-4 years) |
| Titanium-powder supply-chain disruptions | -2.2% | Global, critical in Europe and Asia | Short term (≤ 2 years) |
| Cyber/IP risks from weapon-system build files | -1.7% | Defense sectors globally, highest in NATO nations | Long term (≥ 4 years) |
| Source: Mordor Intelligence | |||
High Capital and Powder Costs for Production-Grade Metal AM
Even after price rationalization, turnkey systems capable of flight-hardware tolerances still cost USD 500,000-2 million, while aerospace-grade titanium or nickel powders run USD 150-300 per kg, about 30% above industrial varieties. Clean-room storage, inert-gas handling, and hot isostatic pressing double the sticker price once facilities and post-processing are counted. For suppliers in South America, Southeast Asia, and Africa, scarce financing options magnify the hurdle. The cost burden curbs expansion in regions that otherwise offer competitive labor and proximity to airframe final assembly lines, moderating the growth of the aerospace 3D printing market.
Stringent Aerospace Qualification Timelines
Critical flight parts generally require 18-36 months to meet FAA or EASA standards, dwarfing the six-to-twelve-month pathway typical in automotive applications. Documentation under DO-178C for software-driven process control alone can add a year. Full fatigue curves to 10^7 cycles must be generated for new alloys, calling for dozens of test coupons and specialized rigs that few SMEs own outright. When programs cross borders, say, a European engine supplied to a US airframer, dual authority sign-offs introduce duplicate audits and more schedule risk. Extended timelines translate into higher non-recurring engineering costs, slowing supplier willingness to invest in capacity and dampening the aerospace 3D printing adoption curve.
*Our forecasts treat driver/restraint impacts as directional, not additive. The impact forecasts reflect baseline growth, mix effects, and variable interactions.
Segment Analysis
By Application: Aircraft Dominance Drives Market Leadership
Aircraft applications generated 64.95% of the aerospace 3D printing market revenue in 2025, reflecting deep penetration into cabin brackets, environmental-control ducting, and engine subassemblies. In civil fleets, every kilogram saved cuts fuel burn by roughly 0.03%, so operators welcome components that deliver double-digit weight relief while holding strength margins. The aerospace 3D printing market size for aircraft parts is projected to climb at 18.2% CAGR as single-aisle production rises above 70 aircraft per month and wide-body programs rebound. Retrofit opportunities also abound because printed replacements can match legacy form factors yet weigh considerably less, extending the lifespan of in-service fleets without extensive recertification. Airlines increasingly contract large quantities of printed cabin parts to minimize spares inventory, a practice enabled by distributed digital warehouses that store CAD files rather than physical stock.
UAVs will outpace manned platforms, expanding 26.10% annually through 2031 as defense ministries seek attritable platforms for contested environments. Short development cycles favor AM because tooling investments across several small production batches are uneconomical. Civil UAV adoption for logistics and aerial inspection also benefits; printed airframes allow rapid customization for sensor payloads or cargo bays. Together, these drivers push UAVs to deliver the most incremental revenue across the aerospace 3D printing market between 2026 and 2031.


By Material: Metal Alloys Maintain Technological Leadership
Metal alloys held 60.05% of 2025 revenue, underscoring titanium’s essential role in high-temperature zones such as combustor liners and turbine blades. AM slashes titanium buy-to-fly ratios from 15:1 to nearly 1:1, cutting raw-material waste and part cost, an unmatched advantage in metals that trade above USD 20 per kg. Stringent mechanical demands and mature qualification data sets defend the aerospace 3D printing market share for metal alloys. Nickel-based superalloys like Inconel 718 grow steadily for exhaust nozzles and hypersonic vehicle parts where creep resistance at 1,000 °C is mandatory.
Specialty and refractory metals, including niobium C103, tantalum alloys, and rhenium blends, will post a 24.95% CAGR as next-generation rocket engines and scramjets require temperature ceilings above 1,500 °C. Due to flame-smoke-toxicity compliance, high-performance polymers such as PEEK and PEI retain relevance for non-load-bearing interior parts. Still, metals dominate in any zone exposed to continuous loads or thermal cycles. Composite powders that combine aluminum with ceramic nanophases are on the horizon, yet remain a tiny share of the aerospace 3D printing market size, pending broader fatigue-data validation.
By Printer Technology: Powder-Bed Fusion Leads Market Maturity
Powder bed fusion (PBF) secured 55.35% 2025 revenue because its sub-30 µm layer heights and controlled atmospheres satisfy tight aerospace porosity limits. Multi-laser PBF platforms now reach productivity of 1,000 cm³/hr, allowing serial lots of up to 50,000 parts annually within a single cell. OEMs also value well-established parameter libraries that simplify qualification, reinforcing PBF dominance in the aerospace 3D printing market.
Directed energy deposition (DED) will chart the quickest 23.70% CAGR. Its larger melt pool supports near-net-shape build of meter-scale structures, which is attractive for wing ribs and cryogenic tanks. Deposition heads mounted on robotic arms carry out in-situ repairs, extending the life of costly turbine cases and saving millions in spare-part inventory. Material extrusion and other emerging processes remain relegated to tooling and non-critical items due to coarser resolutions, but contribute to broader adoption by offering entry-level costs for academic and tier-3 players.
By End Product: Engine Components Drive Performance Innovation
Engine components generated 52.05% of 2025 revenue, as evidenced by the LEAP nozzle, Rolls-Royce’s certified printed turbine blades, and SpaceX’s printed Raptor injectors. The aerospace 3D printing market size for engines is forecast to register a 19.05% CAGR, underpinned by the march toward higher bypass ratios and core temperatures where legacy castings fall short. Internal conformal cooling channels AM enables elevated firing temperatures, translating into 2-4% fuel-burn gains.
Structural components, though only 32.10% of revenue today, will accelerate at 22.55% CAGR due to demonstrations of topology-optimized fuselage brackets, seat tracks, and load-bearing wing ribs. Boeing’s adoption of printed titanium brackets on the B787 offers a high-visibility proof of airworthiness. Lower-criticality items-tooling inserts, trim fixtures, and low-pressure ducting-round out the remainder, providing steady if less spectacular growth.
Geography Analysis
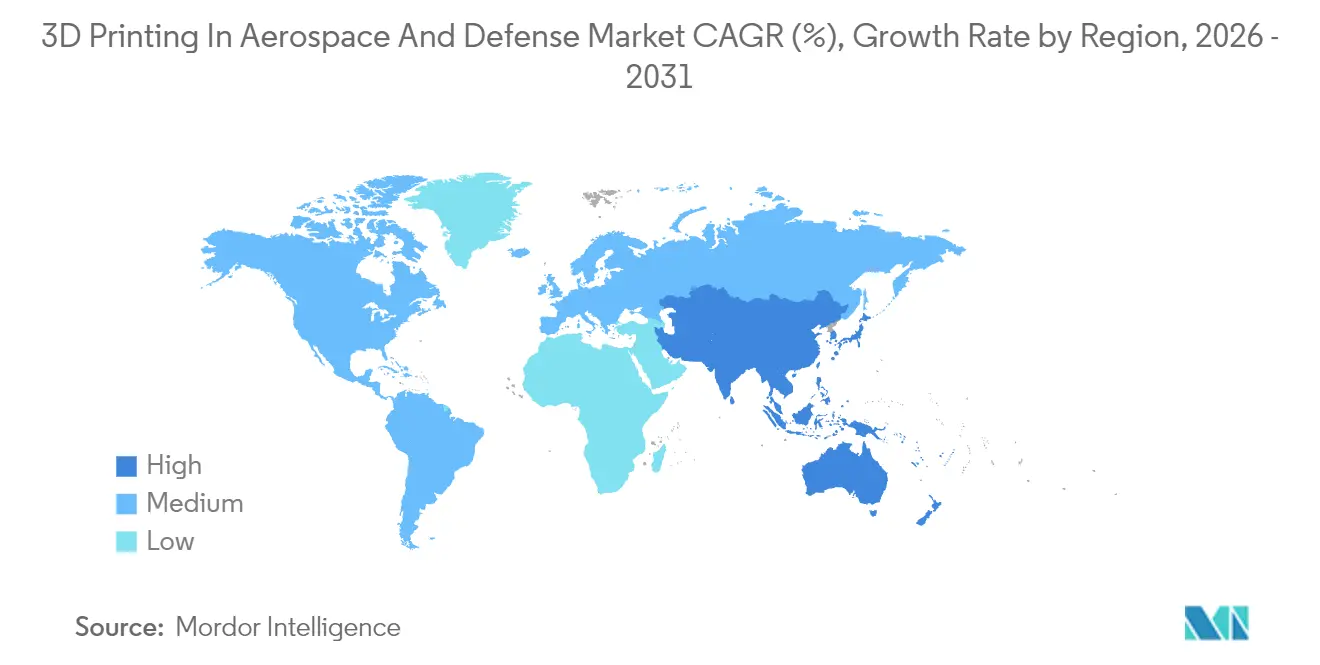
North America controlled 43.10% of global revenue in 2025, buoyed by the presence of Boeing, Lockheed Martin, GE, and an unrivaled pipeline of defense funding. FAA Advisory Circular AC 20-170A now recognizes process simulation instead of some destructive tests, removing a major certification bottleneck. Canada’s Bombardier exploits printed interior parts to keep Learjet and Challenger cabins competitive. Mexico’s Baja California cluster leverages cost-effective labor to run powder-bed fusion lines for bracket production. US Defense AM Forward programs ensure domestic suppliers absorb early development risk, cementing regional leadership in the aerospace 3D printing market.
Europe ranks second, energized by Airbus, Rolls-Royce, Safran, and a vibrant materials-science community centered in Germany and Sweden. Europe's aerospace 3D printing market benefits from the EU Green Deal, which ties environmental targets to aircraft weight, effectively subsidizing AM adoption. EASA’s digital-thread initiatives shorten structural approvals, encouraging Lilium and Vertical Aerospace to print eVTOL airframes. France’s Toulouse cluster rallies around the R&D tax credit, seeding start-ups tackling high-temperature alloys. Meanwhile, Germany’s Fraunhofer institutes pioneer multi-laser calibration protocols that could set global PBF benchmarks.
Asia-Pacific is the fastest-growing geography at 25.95% CAGR, powered by China’s C919 ramp-up, India’s indigenization push, and Japan’s metallurgical depth. The EOS-Godrej aerospace joint venture has printed flight-qualified fuel manifolds for export-grade engines. China’s state plan earmarks AM lines for 70% of its next-generation turbofan components by 2030, establishing a formidable domestic supply chain. Mitsubishi Heavy Industries installs DED heads on five-axis mills, blending additive and subtractive steps for bulkhead repairs. South Korea’s KF-21 fighter features printed titanium bulkheads to shave structural mass. These moves anchor Asia-Pacific as a critical engine of demand in the aerospace 3D printing market.

Competitive Landscape
The aerospace 3D printing market shows moderate concentration. Strategic partnerships dominate: Boeing extended its Stratasys agreement to cabin interiors, and Airbus embeds EOS multi-laser machines directly into A350 lines. Equipment vendors pursue vertical integration; Desktop Metal controls its own powder supply through partnerships, while Velo3D offers design-for-additive software to lock in customers.
M&A spikes underline the maturing ecosystem. Nikon-SLM combines optical-metrology know-how with quad-laser powder beds to chase engine cases, while GE Additive incubates binder-jet technology for cost-sensitive brackets. Software pure-plays such as Materialise land AS9100D certification, integrating print planning into OEM product-lifecycle systems. Emerging outsiders focus on specialization: Relativity Space prints entire rocket airframes; Norsk Titanium uses rapid plasma deposition exclusively for large titanium near-net shapes. The result is a layered competitive field where IP portfolios, qualification data, and service-bureau capacity matter as much as machine throughput, shaping the trajectory of the aerospace 3D printing market.
3D Printing In Aerospace And Defense Industry Leaders
3D Systems Corporation
Ultimaker B.V.
Stratasys Ltd.
Norsk Titanium AS
EOS GmbH
- *Disclaimer: Major Players sorted in no particular order

Recent Industry Developments
- August 2025: 3D Systems secured a USD 7.65 million contract from the US Air Force for the GEN-IIDMP-1000, a large-format metal 3D printer. This marks the next phase of a program initiated in 2023 to enhance flight-relevant AM capabilities, with completion expected by September 2027.
- April 2024: Relativity Space signed a USD 8.7 million agreement with the US Air Force Research Lab to advance real-time flaw detection in AM. This two-year project enhances quality control in large-scale metal 3D printing, aligning with the National Defense Authorization Act's mandates to accelerate aerospace component production.
- March 2024: GE Aerospace invested over USD 650 million in manufacturing and the supply chain, with over USD 150 million dedicated to AM equipment. This includes USD 450 million for new equipment and facility upgrades at 22 sites in 14 states, USD 100 million for the base of US-based suppliers, and another USD 100 million for international sites in North America, Europe, and India.


Global 3D Printing In Aerospace And Defense Market Report Scope
3D printing, also known as additive manufacturing, refers to the process of depositing, joining, or solidifying material under computer control to create a three-dimensional solid object from a digital file. The report covers 3D printing in the aviation (civil and military) and defense sectors. Terrestrial and naval vehicles are excluded from the scope of the study.
The 3D printing in aerospace and defense market is segmented by application, material, and geography. The report is segmented by application into aircraft, unmanned aerial vehicles, and spacecraft. By material, the market is segmented into alloys, special metals, and other materials. The report also covers the market sizes and forecasts for the aerospace 3D printing market in major countries across different regions. The market size is provided for each segment in terms of value (USD).
| Aircraft |
| Unmanned Aerial Vehicles (UAVs) |
| Spacecraft and Launch Vehicles |
| Metal Alloys (Ti, Ni, Al) |
| Specialty and Refractory Metals |
| High-performance Polymers and Composites |
| Powder Bed Fusion |
| Directed Energy Deposition |
| Material Extrusion |
| Others |
| Engine Components |
| Structural Components |
| Others |
| North America | United States | |
| Canada | ||
| Mexico | ||
| Europe | United Kingdom | |
| France | ||
| Germany | ||
| Russia | ||
| Rest of Europe | ||
| Asia-Pacific | China | |
| India | ||
| Japan | ||
| South Korea | ||
| Rest of Asia-Pacific | ||
| South America | Brazil | |
| Rest of South America | ||
| Middle East and Africa | Middle East | Saudi Arabia |
| Israel | ||
| United Arab Emirates | ||
| Rest of Middle East | ||
| Africa | South Africa | |
| Rest of Africa | ||
| By Application | Aircraft | ||
| Unmanned Aerial Vehicles (UAVs) | |||
| Spacecraft and Launch Vehicles | |||
| By Material | Metal Alloys (Ti, Ni, Al) | ||
| Specialty and Refractory Metals | |||
| High-performance Polymers and Composites | |||
| By Printer Technology | Powder Bed Fusion | ||
| Directed Energy Deposition | |||
| Material Extrusion | |||
| Others | |||
| By End Product | Engine Components | ||
| Structural Components | |||
| Others | |||
| By Geography | North America | United States | |
| Canada | |||
| Mexico | |||
| Europe | United Kingdom | ||
| France | |||
| Germany | |||
| Russia | |||
| Rest of Europe | |||
| Asia-Pacific | China | ||
| India | |||
| Japan | |||
| South Korea | |||
| Rest of Asia-Pacific | |||
| South America | Brazil | ||
| Rest of South America | |||
| Middle East and Africa | Middle East | Saudi Arabia | |
| Israel | |||
| United Arab Emirates | |||
| Rest of Middle East | |||
| Africa | South Africa | ||
| Rest of Africa | |||


Key Questions Answered in the Report
How fast is global demand for 3D Printing In Aerospace And Defense Market expected to grow through 2031?
The value pool is projected to expand from USD 5.02 billion in 2026 to USD 12.41 billion by 2031, equal to a 19.83% CAGR.
Which application currently generates the highest additive manufacturing revenue in aerospace?
Aircraft parts lead with 64.95% of 2025 revenue, thanks to widespread use in brackets, ducts, and engine hardware.
What region is likely to post the quickest growth?
Asia-Pacific is projected to record a 25.95% CAGR through 2031, fueled by Chinese, Indian, and Japanese aerospace programs.
Which printing technology holds the largest installed base?
Powder-bed fusion accounts for 55.35% of certified aerospace builds, driven by its fine resolution and mature qualification data.
Why are titanium powders critical to additive manufacturing for aerospace?
Titanium offers the best strength-to-weight ratio for high-temperature zones, but its supply chain remains exposed to geopolitical disruptions and price swings.
Page last updated on:


