
3D Concrete Printing Market Size and Share
Market Overview
| Study Period | 2021 - 2031 |
|---|---|
| Market Size (2026) | USD 1.49 Billion |
| Market Size (2031) | USD 17.27 Billion |
| Growth Rate (2026 - 2031) | 63.23 % |
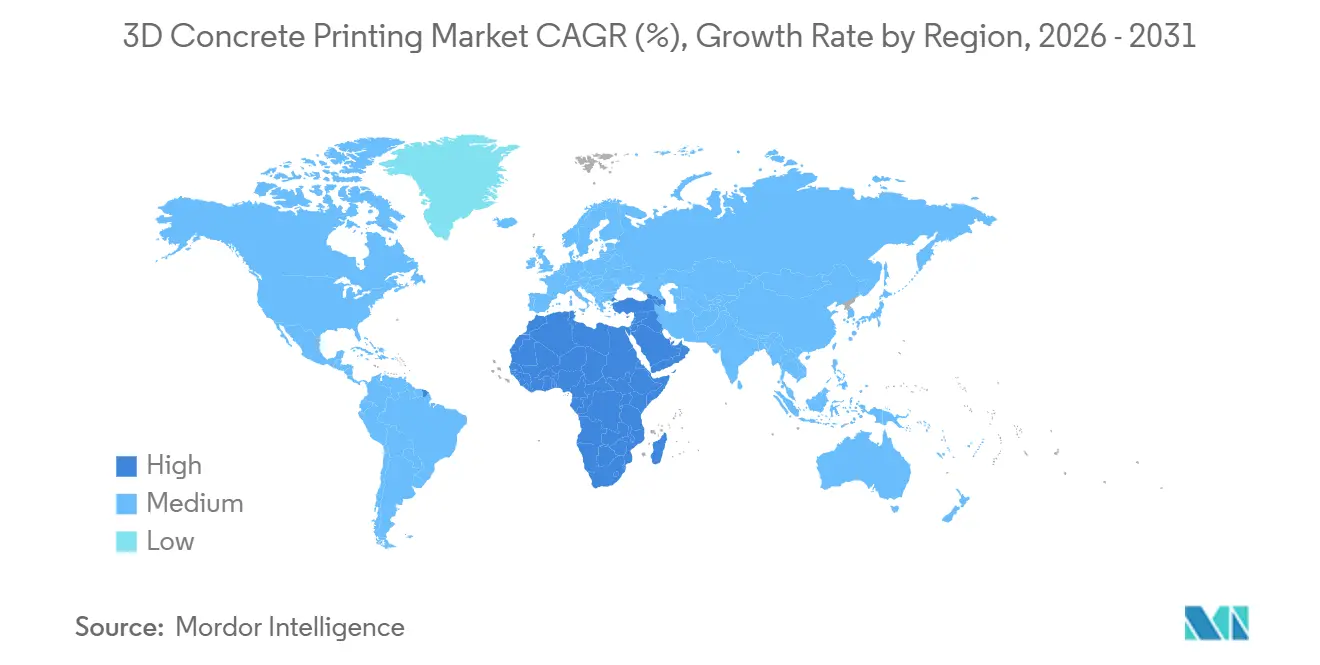
| Fastest Growing Market | Middle East and Africa |
| Largest Market | Asia Pacific |
| Market Concentration | Medium |
Major Players *Disclaimer: Major Players sorted in no particular order Image © Mordor Intelligence. Reuse requires attribution under CC BY 4.0. | |
3D Concrete Printing Market Analysis by Mordor Intelligence
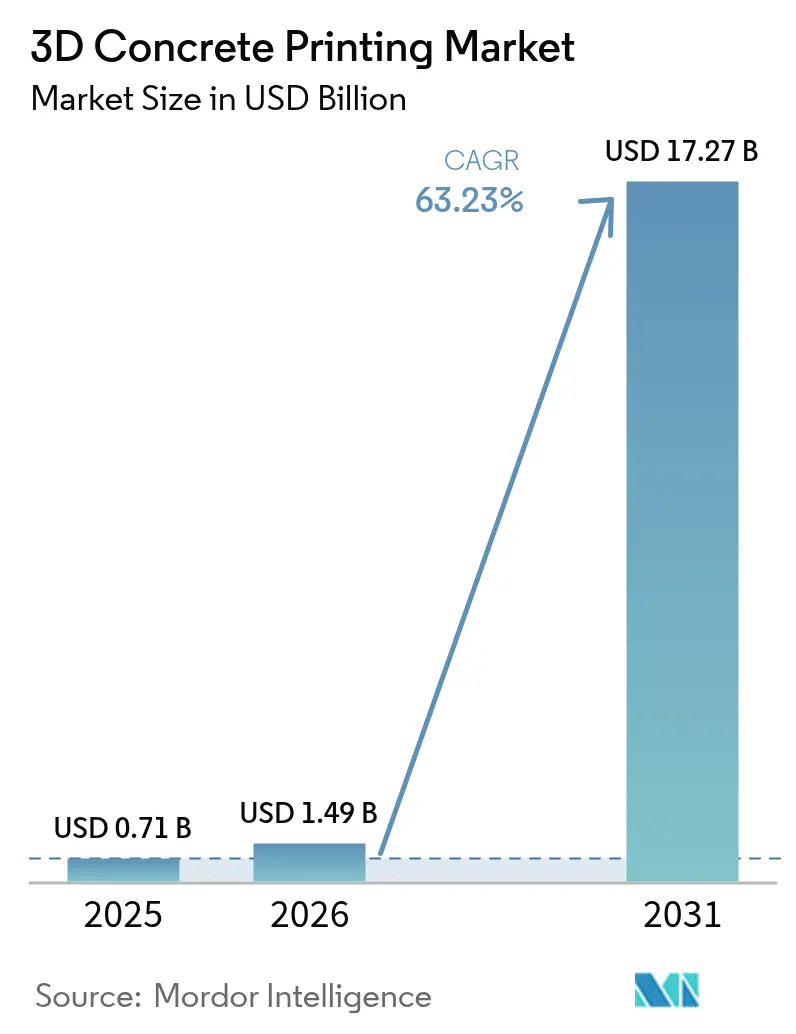
The 3D Concrete Printing Market size is expected to grow from USD 0.71 billion in 2025 to USD 1.49 billion in 2026 and is forecast to reach USD 17.27 billion by 2031 at 63.23% CAGR over 2026-2031. Robust momentum comes from the first mainstream building-code pathways, rapid material-science progress, and urgency to trim project cycle times. The ICC’s AC509 criteria and UL’s 3401 evaluation standard eliminated the need for case-by-case approvals, unlocking commercial financing and insurance coverage. Demonstrations such as the U.S. Army Corps of Engineers’ 46 m² barracks printed in under 40 hours showed labor savings of 75% and negligible waste. Asia-Pacific leads adoption as China’s prefabrication mandates and India’s affordable-housing targets converge with skilled-labor shortages. Meanwhile, architects worldwide are shifting to high-performance mixes that achieve compressive strengths above 100 MPa, enabling thinner shells and cantilevered facades without formwork. Equipment cost remains a drag, yet hybrid factory-printed panels combined with on-site assembly are broadening the addressable customer base.
Key Report Takeaways
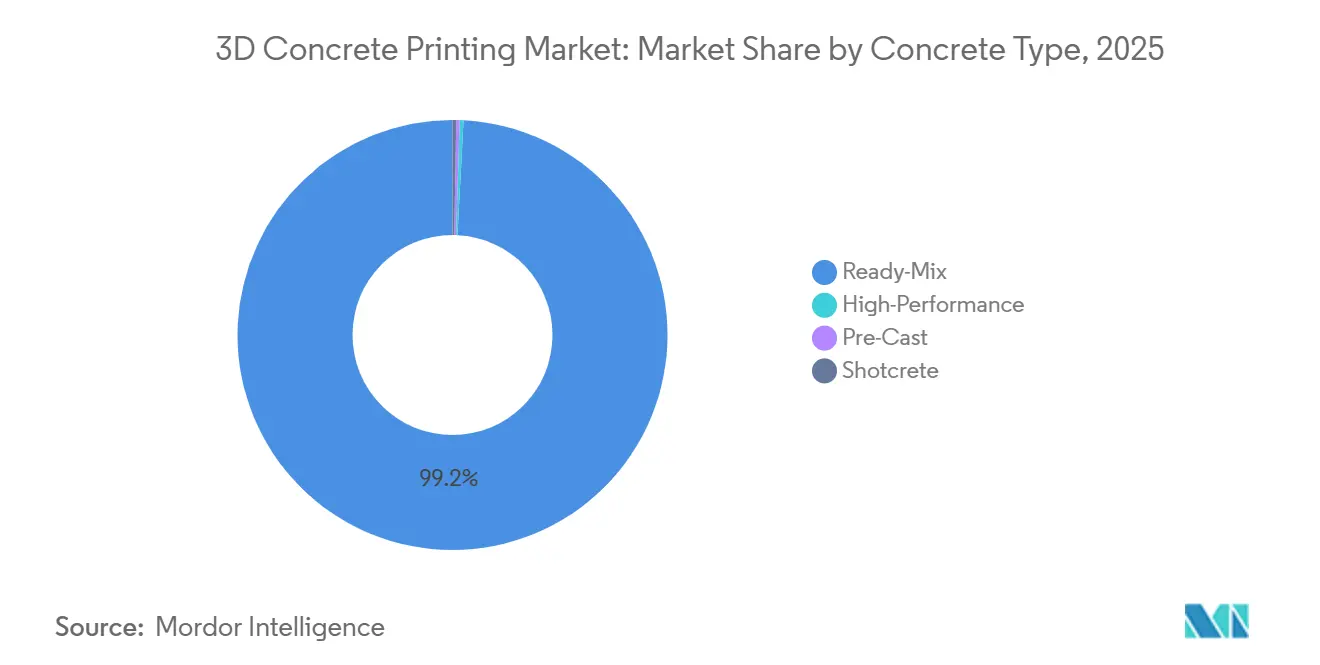
- By concrete type, ready-mix held 99.20% of the 3D concrete printing market share in 2025. High-performance mixes are forecast to expand at a 78.77% CAGR between 2026 and 2031.
- By product type, panels and lintels captured 65.94% of 2025 revenue in the 3D concrete printing market size and are advancing at a 74.78% CAGR through 2031.
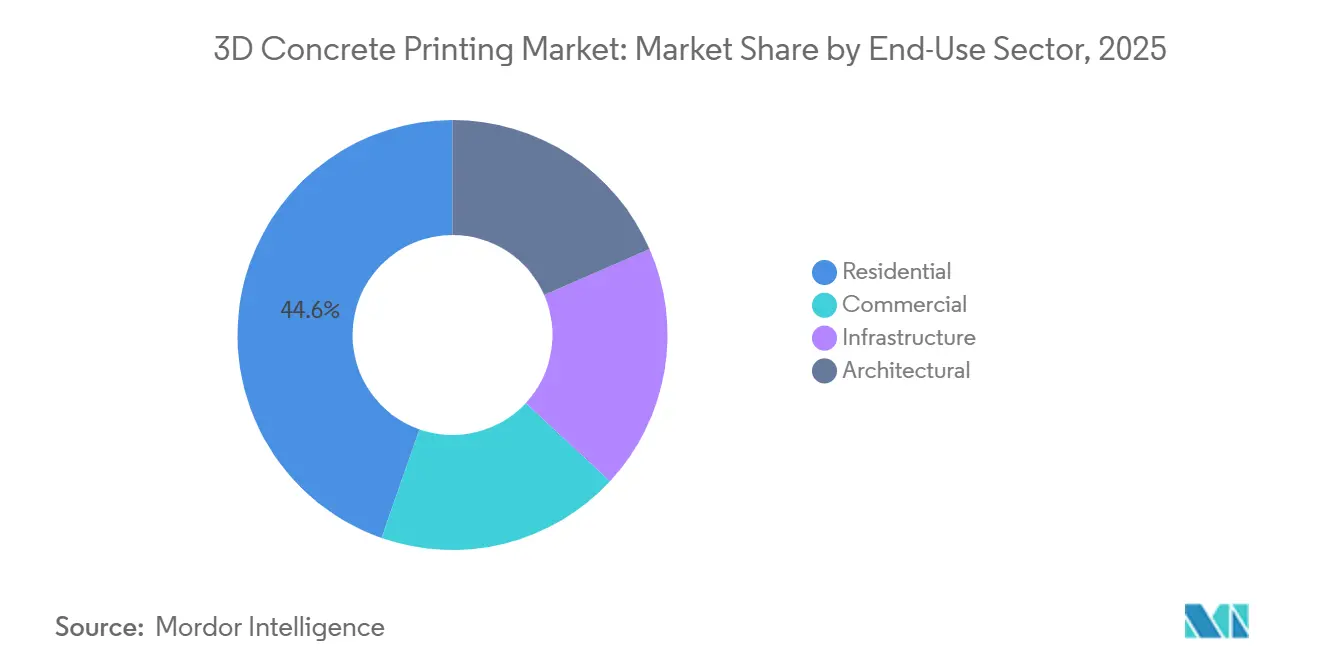
- By end-use, residential accounted for 44.64% of 2025 demand, while architectural applications are growing at a 72.05% CAGR.
- By geography, Asia-Pacific commanded a 55.54% 3D concrete printing market share in 2025. Whereas the Middle-East and Africa are growing at a 77.64% CAGR.
Note: Market size and forecast figures in this report are generated using Mordor Intelligence’s proprietary estimation framework, updated with the latest available data and insights as of 2026.
Market Trends and Insights
Drivers Impact Analysis of 3D Concrete Printing Market*
| Drivers | (~) % Impact on CAGR Forecast | Geographic Relevance | Impact Timeline |
|---|---|---|---|
| Cost- and time-efficient automated construction | +18.5% | Global, with early concentration in North America, APAC urban corridors | Short term (≤ 2 years) |
| Infrastructure boom and affordable-housing demand in Asia-Pacific | +15.2% | APAC core (China, India, ASEAN), spill-over to MEA | Medium term (2-4 years) |
| Sustainability push for low-waste/low-carbon building | +12.8% | Europe, North America, APAC (Japan, South Korea) | Long term (≥ 4 years) |
| Defense and disaster-relief adoption of printed shelters | +8.4% | North America (DoD), Europe (NATO), disaster-prone APAC regions | Medium term (2-4 years) |
| Regulatory breakthroughs (ICC-ES AC509, UL 3401 ESRs) | +6.9% | North America, gradual adoption in Europe and APAC | Short term (≤ 2 years) |
| Source: Mordor Intelligence | |||
Cost- and Time-Efficient Automated Construction
While labor productivity in construction has remained stagnant for decades, additive systems are revolutionizing the industry. These systems not only eliminate the need for formwork but also significantly reduce labor hours and minimize waste. A prime example is ICON’s 100-home project at Wolf Ranch in Texas, which showcases a streamlined approach: a two-day wall printing followed by conventional roofing and MEP fit-out. Military assessments echo these economic benefits, demonstrating that four-person teams can set up robust shelters in just 48 hours for expeditionary bases[1]U.S. Marine Corps Systems Command, “Expeditionary Advanced Base Operations,” marcorpsyscom.marines.mil. Such efficiencies are particularly crucial in markets like Japan, which experienced a workforce decline between 2015 and 2025.
Infrastructure Boom and Affordable-Housing Demand in Asia-Pacific
India's ambitious Pradhan Mantri Awas Yojana targets new urban homes by 2030. However, current capacities reveal a shortfall. In Chennai, Tvasta's printed prototype achieved a reduction in build time. By 2027, China is set to require prefabricated components to make up tier-1 residential projects, leading to a surge in bulk orders for factory-printed slabs. Meanwhile, the Asian Development Bank's robust infrastructure pipeline underscores a consistent demand for printed pedestrian bridges and culverts.
Sustainability Push for Low-Waste/Low-Carbon Building
Concrete is a major contributor to global CO₂ emissions. However, innovative techniques are emerging to mitigate this impact. Additive layering can significantly reduce concrete volume and is compatible with clinker-reduced binders. Heidelberg Materials has developed a printable mix that reduces clinker content, resulting in a lower embodied carbon footprint[2]Heidelberg Materials, “i.tech 3D Sustainability Report 2025,” heidelbergmaterials.com. Starting in 2026, Europe’s Carbon Border Adjustment Mechanism will incentivize the use of domestic low-carbon components. Meanwhile, LC3 technology, a brainchild of ETH Zurich, substitutes a portion of traditional Portland cement with calcined clay and limestone. This not only maintains the essential thixotropy for layer adhesion but also achieves a commendable reduction in embodied carbon.
Defense and Disaster-Relief Adoption of Printed Shelters
In its FY 2024 budget, the U.S. Department of Defense allocated funds for field-deployable printers. NATO's Arctic exercise in 2025 confirmed that command posts could be printed in sub-zero temperatures within a swift timeframe. Meanwhile, pilots conducted by UNHCR in Jordan demonstrated the ability to print shelters quickly, underscoring the urgency of humanitarian needs.
Restraints Impact Analysis of 3D Concrete Printing Market*
| Restraints | (~) % Impact on CAGR Forecast | Geographic Relevance | Impact Timeline |
|---|---|---|---|
| High capital expenditure for printers and ancillaries | -4.2% | Global, most acute in emerging markets with limited access to equipment financing | Short term (≤ 2 years) |
| Non-standardized printable-mix formulations and codes | -3.1% | Global, with fragmentation highest in APAC and Latin America | Medium term (2-4 years) |
| Urban-site logistics limits for large gantry systems | -2.6% | Dense urban centers in APAC, Europe, select North American metros | Long term (≥ 4 years) |
| Source: Mordor Intelligence | |||
High Capital Expenditure for Printers and Ancillaries
Purchasing a COBOD BOD2 gantry, which boasts a 14.6 m span, comes with a significant price tag. However, to fully equip it with essential pumps, mixers, and generators, an additional investment is required. The leasing market for such equipment is limited, and those who do venture into it face a steep interest rate. This is largely due to financiers' lack of depreciation data. Furthermore, in India, duties on imported robotics can accumulate to a hefty percentage, posing a significant challenge in the emerging market.
Non-Standardized Printable-Mix Formulations and Codes
Despite using identical recipes, labs experience a variation in layer adhesion, highlighting differences in mixing and humidity conditions. Consequently, each project allocates a budget for site-specific rheology tests. In Japan and India, printed structures are still deemed non-conventional, necessitating ministerial-level approvals and causing delays in project starts.
*Our forecasts treat driver/restraint impacts as directional, not additive. The impact forecasts reflect baseline growth, mix effects, and variable interactions.
3D Concrete Printing Market Segment Analysis
By Concrete Type:
Ready-Mix Dominance Masks High-Performance SurgeReady-mix secured 99.20% of the 3D concrete printing market in 2025, riding on ubiquitous supply chains and contractor familiarity. Most sites adapt local ready-mix with viscosity-modifying admixtures dosed on site. High-performance concrete, however, is accelerating at a 78.77% CAGR as compressive strengths above 100 MPa enable 50 mm-thick walls that free valuable floor area. ACI studies show that ultra-high-performance formulations cut material volume while meeting identical load ratings. In many low-rise applications, fiber reinforcement has replaced the need for rebar. However, when fiber content exceeds a certain threshold, nozzle clogging becomes an issue, necessitating iterative testing.
The diversification continues: geopolymer mixes activated by sodium silicate offer near-zero embodied carbon but require 60 °C curing, limiting them to factory settings. Pre-cast workflows leverage factory control to print wall panels and floor slabs, minimizing weather delays prevalent in on-site printing. Shotcrete variants are entering tunnel-repair use cases where rapid setting and adhesion matter most. These trends signal a gradual migration from commodity to engineered mixes as second-wave adopters prioritize design freedom and sustainability.



By Product Type:
Panels and Lintels Lead Modular ShiftPanels and lintels delivered 65.94% of 2025 revenue in the 3D concrete printing market and are expanding at a 74.78% CAGR as developers favor hybrid construction. Factory-printed wall panels, featuring embedded conduits, have reduced on-site assembly time to just four hours per unit. Meanwhile, lintels with hollow cores have significantly cut formwork costs.
While floors and roofs have been slower to adopt, they are now gaining momentum. Using suspended-nozzle techniques, they are able to print ceiling layers without the need for elaborate falsework. Helical staircases have carved out a profitable niche, especially after CyBe managed to print a spiral staircase at a cost lower than precast alternatives. Additionally, architectural street furniture—ranging from planters and benches to acoustic baffles—has introduced a premium design segment to the market. Given that inspectors and insurers view factory-printed modules as lower risk, modular workflows are seeing faster approval times, leading to broader adoption beyond just the early adopters.
By End-Use Sector:
Residential Scale Meets Architectural AmbitionResidential projects held 44.64% of 2025 demand as national housing programs in India, China, and Saudi Arabia specified aggressive unit counts and timelines. ICON demonstrated 48-hour wall printing for single-family homes, beating wood-frame workflows on speed even before accounting for waste reduction.
Infrastructure and architectural segments, though smaller in volume, are the fastest-growing. The architectural sub-segment is advancing at a 72.05% CAGR as museums and transit hubs commission doubly-curved facades and acoustically graded panels impossible with standard casts. The Smithsonian’s Hirshhorn renovation tuned reverberation across galleries using variable-porosity printed panels. Dubai’s Museum of the Future employed stainless-steel-reinforced printed concrete to achieve its torus-shaped skin. Infrastructure use cases, such as pedestrian bridges, validated long-term durability; the Netherlands’ 2017 printed bridge still shows no structural degradation.
Geography Analysis
APAC 3D Concrete Printing Market
Asia-Pacific maintained 55.54% of global 3D concrete printing market share in 2025. China's push for a prefabrication mandate by 2027 is fueling a surge in factory orders. Meanwhile, WinSun's successful five-story apartment block in Suzhou has validated the feasibility of mid-rise constructions. With an urban housing deficit, India is turning to 3D printing as a cost-effective solution. Japan, grappling with a dwindling labor force, is hastening the adoption of robotic printing, enabling two-person teams to complete detached homes. In 2024, South Korea allocated a substantial amount for public-housing pilot projects. Additionally, the ASEAN region's ongoing infrastructure projects are bolstering the demand for printed culverts and bus shelters.
North America 3D Concrete Printing Market
North America is capitalizing on its early regulatory advantages. The introduction of AC509 and UL 3401 has eliminated uncertainties in permitting, enabling swift approvals from lenders and insurers. In 2024, a significant funding round for ICON facilitated the expansion of its Vulcan printer, catering to residential, military, and commercial sectors. To tackle the challenges of northern climates, Canada has set up a cold-weather test facility in Ottawa, focusing on freeze-thaw durability. In Tabasco, Mexico, INFONAVIT is making strides by printing homes at an impressive rate, achieving rapid build times.
Europe 3D Concrete Printing Market
Europe's embrace of 3D concrete printing is largely influenced by stringent carbon policies and a precast industry keen on integrating this new technology. Germany's endorsement of PERI's printed walls has set a precedent, guiding other EU nations. Heidelberg Materials is proactively aligning its clinker-reduced mix with the EU's impending carbon tariffs, set to roll out in 2026. France and the Netherlands are at the forefront, championing major infrastructure initiatives like XtreeE's Paris footbridge, designed to endure heavy traffic. While the UK is making strides in standardization through its Construction Innovation Hub, it's evident that its pace lags behind its continental counterparts.
South America 3D Concrete Printing Market
South America's journey in 3D concrete printing is still in its infancy. Brazil is taking a step forward with a pilot project in São Paulo, aiming to produce homes under its social-housing initiative. On the other hand, Argentina grapples with economic challenges; its fluctuating inflation and currency instability have stymied significant capital investments. As a result, most activities are confined to university laboratories, where researchers are delving into experiments with recycled-plastic fibers.
MEA 3D Concrete Printing Market
The Middle-East and Africa post the fastest continental growth at a 77.64% CAGR. Saudi Arabia's ROSHN has ambitious plans, targeting printed units by 2030, with a swift production cycle. Dubai is setting the pace with a mandate that a portion of all new constructions must adopt additive techniques by 2030. They've already showcased this commitment with a printed bus shelter, engineered to endure the region's extreme desert conditions and sandstorms. In South Africa, the CSIR is exploring innovative clay-based printable mixes, aiming to address housing challenges in informal settlements.

Regulatory Landscape
Regulation is shifting from case-by-case approvals toward codified pathways for 3D printed concrete walls and additively manufactured structures. In 2026, ICC published ICC 1150-2026, setting minimum requirements for materials, qualification, inspection, and structural design of 3D printed wall systems and their connections. This gives building officials a clearer basis for permitting load-bearing and non-load-bearing walls. In parallel, ISO/ASTM 52939:2023 sets process and delivery requirements for additively manufactured structures in residential and commercial applications, supporting more consistent qualification across global projects.
Standardization work remains uneven by region, but several initiatives are closing key gaps in test methods and product conformity. ASTM International has ongoing work items focused on sampling/curing practices and the determination of hardened mechanical properties for additively manufactured concrete, while European bodies are progressing amendments to core concrete specifications, including CEN work to extend EN 206 to digital fabrication. Separately, the EU Construction Products Regulation framework is being revised with digital compliance elements such as the Digital Product Passport, with mandatory timing discussed for 2028-2030 for construction products, which increases the value of traceable material and process data for printed components.
Value Chain Analysis
The 3D concrete printing value chain spans (1) digital design and planning (BIM-to-print workflows and path planning), (2) equipment and automation (gantry/robotic printers, pumps, mixers, control systems), (3) materials (cement and SCMs, aggregates, fibers, and chemical admixtures), and (4) execution (contractors, precasters, QA/QC labs, and inspectors). On the materials side, performance depends on specialty admixtures such as superplasticizers, viscosity-modifying agents, and accelerator/retarder packages that balance extrudability, open time, and buildability. These formulations are commonly tuned to local ready-mix supply chains to support continuous print cycles on site.
Bottlenecks concentrate in material consistency and jobsite logistics more than in raw material availability. Projects still invest in managing batch-to-batch variability, humidity and temperature effects, and delivery timing to avoid cold joints during long prints. In response, the chain is shifting toward integrated system offerings and partnerships, where chemical suppliers and printer OEMs co-develop validated recipes and operating windows, including printable-mix solution portfolios from companies such as Sika, and market participation by global cement/concrete players such as CEMEX and regional suppliers such as SCG. Contractors increasingly use hybrid models that combine factory-controlled printed modules with conventional assembly to reduce on-site risk.
Competitive Landscape
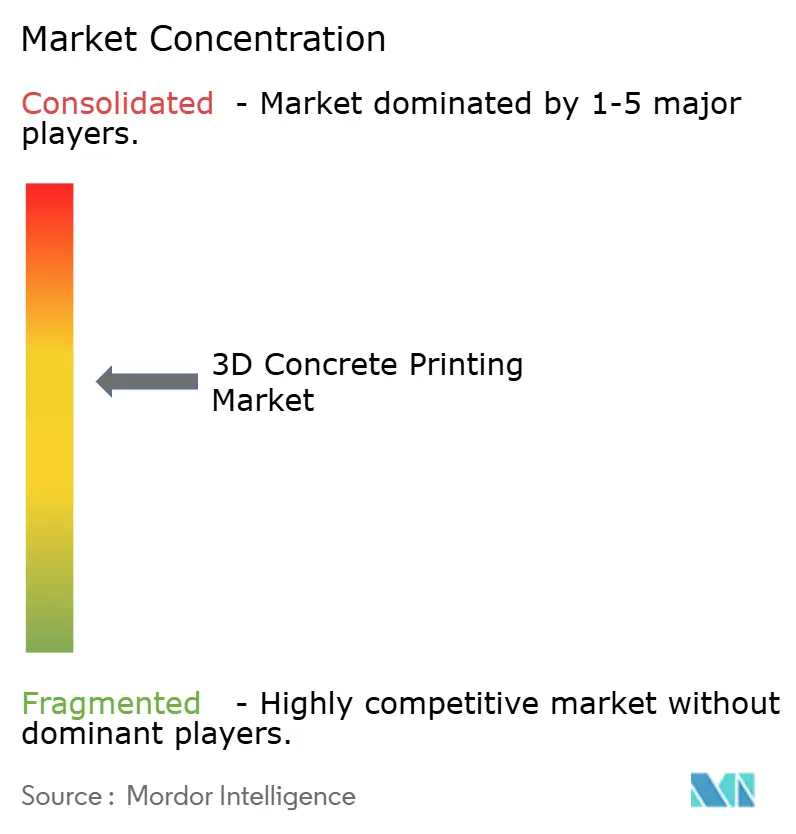
The 3D concrete printing market is moderately consolidated. Construction giants are purchasing printers outright to secure internal capabilities, while mid-tier contractors rely on build-operate-transfer agreements to sidestep capital outlays. Patent activity is heating up. COBOD’s US 11407169 B2 covers multi-footprint gantry rails, cutting mobilization overhead for large sites. Sika’s EP 3898558 A1 extends printable-mix open times to four hours, vital for hot climates. Startups are targeting speed; Mighty Buildings’ light-stone composite cures under UV, printing ten times faster than cementitious mixes. Standards-body participation now forms a strategic moat, as companies that shape test protocols embed preferences for their proprietary chemistries and hardware.
3D Concrete Printing Industry Leaders
COBOD International A/S
ICON Technology Inc.
Apis Cor
Heidelberg Materials AG
HOLCIM
- *Disclaimer: Major Players sorted in no particular order
3D Concrete Printing Market Companies Covered in this Report
- Apis Cor
- Balfour Beatty
- Bemore3D
- Black Buffalo 3D Corporation
- COBOD International A/S
- Constructions-3D
- Contour Crafting Corporation
- CyBe Construction
- Heidelberg Materials AG
- HOLCIM
- Hyperion
- ICON Technology Inc.
- Mighty Buildings Inc.(a LUMUS Inc. Brand)
- MUDBOTS 3D CONCRETE PRINTING LLC
- PERI 3D Construction
- Sika AG
- Skanska
- SQ4D LLC
- Vertico
- WASP Srl - Via Castelletto
- XtreeE
- Yingchuang Building Technique (Shanghai) Co. Ltd (WinSun)

Market Opportunities and Future Outlook
A near-term opportunity is converting 3D concrete printing from pilots into repeatable, financeable construction packages for load-bearing wall systems. This is supported by clearer standards and documented reference builds. ICC 1150-2026 provides a compliance anchor for automated construction of 3D concrete walls, complementing broader process guidance such as ISO/ASTM 52939:2023. Together, these standards help support productized offerings that bundle printer, mix design, QA/QC, and inspection documentation into a permitting-friendly pathway, particularly for developers and insurers that prefer standardized evidence over bespoke engineering judgments.
Commercial-scale projects and new deployment architectures are also expanding the addressable scope beyond single-family housing. In June 2026, Zueblin/STRABAG completed the shell of a 1,700 m2 supermarket printed by a 3D concrete printer in the Stuttgart region, demonstrating large-format non-residential execution. On the equipment side, tower-crane-mounted printing platforms such as Luyten ASCEND (launched June 2026) provide a route to integrate printing into conventional high-rise site logistics, reducing reliance on large ground-based gantries in dense urban settings. Low-carbon material pathways add additional whitespace, including Holcim using TectorPrint with COBOD technology for a 12-unit residential building in Bezannes, France (completed April 2026), as well as academic-industry work on cement-free geopolymer mixes that valorize industrial residues. This aligns printed components with tightening carbon-accounting and product traceability requirements in major construction markets.
Recent Industry Developments in 3D Concrete Printing Market
- June 2026: COBOD International reported that Portuguese contractor Havelar completed a 500 m2 public building for the municipality of Matosinhos in 9 days using a COBOD BOD2 printer. The project adds a municipal-scale reference for schedule compression and supports COBODs positioning of its gantry systems in public-building and institutional use cases beyond housing.
- May 2026: ICON announced it secured more than USD 200 million in new funding to advance its construction automation platform. The raise strengthens ICONs capacity to scale printer fleets, software, and delivery operations, and it increases competitive pressure on equipment vendors and contractors competing for large multi-unit programs.
- October 2024: COBOD introduced the BOD3 printer with a 14.6 m span and a suspended-nozzle mode, enabling printing of floors and roofs on the same setup. Expanding printable element types improves the business case for contractors by increasing utilization of a single mobilization across vertical and horizontal structural components.


3D Concrete Printing Market Report Scope and Research Methodology
Market Definition and Coverage
We define the 3D concrete printing market as revenues generated from construction-grade, automated, layer-by-layer concrete deposition to produce building elements and structures, including the related printing systems and project delivery services that directly enable printed outcomes.
Scope exclusions: This sizing excludes conventional precast manufacturing that does not use automated additive placement, along with generic construction equipment that is not dedicated to 3D concrete deposition.
Segments Covered in This Report
- By Concrete Type
- Ready-Mix
- High-Performance
- Pre-Cast
- Shotcrete
- By Product Type
- Walls
- Floors and Roofs
- Panels and Lintels
- Staircases
- Other Product Types
- By End-Use Sector
- Residential
- Commercial
- Infrastructure
- Architectural
- By Geography
- Asia-Pacific
- China
- India
- Japan
- South Korea
- ASEAN Countries
- Rest of Asia-Pacific
- North America
- United States
- Canada
- Mexico
- Europe
- Germany
- United Kingdom
- France
- Italy
- NORDIC Countries
- Rest of Europe
- South America
- Brazil
- Argentina
- Rest of South America
- Middle-East and Africa
- GCC Countries
- South Africa
- Rest of Middle-East and Africa
- Asia-Pacific
Data Sources, Market Sizing, and Validation
Desk Research
Desk work started with grounding the demand pool in observable construction signals, because printed projects still sit inside standard building activity. We referenced public sources such as US Census construction spending series, Eurostat construction output, UN Comtrade trade flows for relevant machinery categories, and World Bank macro indicators to keep country-level context consistent.
To translate activity into market dollars, we also used non-paywalled sources such as building code and standards publications (where available), patent databases to track technology direction, and project announcements from reputable press and association sites. Company filings, investor presentations, and contract and tender disclosures were then used to sanity-check active capacity, delivery models, and typical pricing logic, supported by paid subscriptions for company financials and a shipment-level import-export database where it helped verify equipment movements. These are illustrative sources only, and many other public references were used to fill gaps, validate assumptions, and clarify definitions.
Primary Interviews and Surveys
Primary work focused on verifying what gets counted as market revenue in real projects and how pricing is structured across printer hardware, material blends, and printing services. We spoke with a mix of printer system providers, construction firms piloting printed elements, material formulators, and engineering stakeholders across major regions, so adoption timing, utilization, and project mix assumptions could be adjusted with practical feedback.
Distribution of primary research fieldwork respondents
| Company type | Respondent position | Region |
|---|---|---|
| Top tier: 38% | CXOs: 13% | APAC: 48% |
| Mid tier: 46% | Functional/Unit leaders: 33% | EMEA: 31% |
| Smaller Players: 16% | Managers: 54% | Americas: 21% |
Market-Sizing & Forecasting
Sizing was built using a top-down approach where construction activity and pipeline signals were reconstructed into a realistic pool of printable projects, and then filtered by adoption and feasibility for printed walls, panels, floors, roofs, and related elements. Once the demand pool was formed, pricing was applied using a mix of observed equipment pricing ranges, service contract structures, and typical material consumption intensity, then split by concrete type and end-use patterns.
To keep totals aligned with observable evidence, we corroborated the result with selective bottom-up checks, including supplier roll-ups for visible deliveries, sampled price x volume calculations from project disclosures, and channel checks on system installations. Variables that carried the most weight included the number of announced or executed printed builds, utilization rates of installed printer systems, the share of projects using on-site versus off-site printing, concrete mix requirements by element type, and country-level permitting and code acceptance signals. Forecasts were produced using scenario analysis, where adoption and utilization moved under base, conservative, and accelerated cases, and the selected trajectory was aligned to expert consensus from interviews and recent project momentum. Where data was thin, gap handling relied on proxy ratios from comparable construction automation deployments and was revised once primary feedback clarified actual commercialization timing.
Data Validation & Update Cycle
Validation used multiple checks so one data series did not drive the final number. Outputs were compared against independent signals such as installed system counts, project announcements, and observed price bands, and then outliers were reviewed and corrected before sign-off.
A second analyst review is completed to test assumptions, currency conversion timing, and growth pacing, followed by re-contact triggers when large variances show up versus new contracts or policy shifts. Reports refresh annually, with interim updates when material events occur, and a final pre-delivery pass is done so clients receive the latest view rather than a stale snapshot.
Mordor Intelligence's 3d Concrete Printing Market Size Compared Against Other Published Estimates
Published market sizes for 3D concrete printing often vary because sources do not count the same revenue streams, and they also use different adoption and utilization assumptions for how often printers are actually deployed on projects.
The main gap comes from whether "construction 3D printing" is treated as a broad bucket that absorbs adjacent building automation and non-concrete printing, and then scaled with aggressive project ramp rates, whereas Mordor Intelligence counts only 3D concrete printing revenues mapped to concrete type, printed product types, and end-use sectors, and then stress-tests utilization with interview-based reality checks.
Benchmark comparison
| Source | Market Size | Gaps in Research Methodology |
|---|---|---|
| Mordor Intelligence | USD 1.49 B (2026) | |
| Industry Publisher A | USD 0.70 B (2025) | Uses an earlier base year and tends to price the market mainly from project announcements, which can undercount service revenues and installed-system ramp when pilots shift into repeat builds. |
| Research Portal B | USD 0.48 B (2024) | Often starts from a narrower set of disclosed deployments and applies a broad CAGR without fully reconciling utilization, currency timing, and what portion of materials and services are attributable to printed elements. |
The spread is mostly explained by differences in what gets included as revenue and by how quickly adoption is assumed to move from pilots to steady construction work. By tying totals back to printed element demand, utilization, and pricing logic that can be checked in the real world, the estimate stays traceable and easier to replicate year over year.


Key Questions Answered in the Report
What is the current global demand for 3D concrete printing and its expected growth by 2031?
Worldwide consumption is USD 1.49 billion in 2026 and is projected to reach USD 17.27 billion by 2031, reflecting a 63.23% CAGR.
How fast can 3D concrete printers complete a single-family home today?
Demonstrations such as ICON’s 100-home Wolf Ranch project show wall systems printed in 48 hours, cutting total construction labor by 60%.
Which concrete mix trends will shape adoption over the next five years?
High-performance and LC3 clinker-reduced mixes are scaling quickly, offering compressive strengths above 100 MPa and embodied-carbon cuts of 40%.
How do recent regulations affect permitting timelines in the United States?
ICC’s AC509 criteria and UL 3401 standards allow standard plan checks, trimming permitting lead times by up to 12 months and cutting legal fees.
Why are panels and lintels dominating current product-type revenues?
Factory-printed panels and lintels eliminate costly formwork, integrate conduits and insulation, and shorten on-site assembly to a few hours per unit.
Which region is projected to grow the fastest through 2031?
The Middle-East and Africa region records a 77.64% CAGR driven by Saudi Arabia’s 30,000-unit ROSHN initiative and Dubai’s 25% additive-construction mandate.
Page last updated on:


 Your data is secure and never sold or shared.


