Tamaño y participación del mercado de semillas de Tailandia
Visión General del Mercado
| Período de Estudio | 2018 - 2031 |
|---|---|
| Período de Datos Pronosticados | 2026 - 2031 |
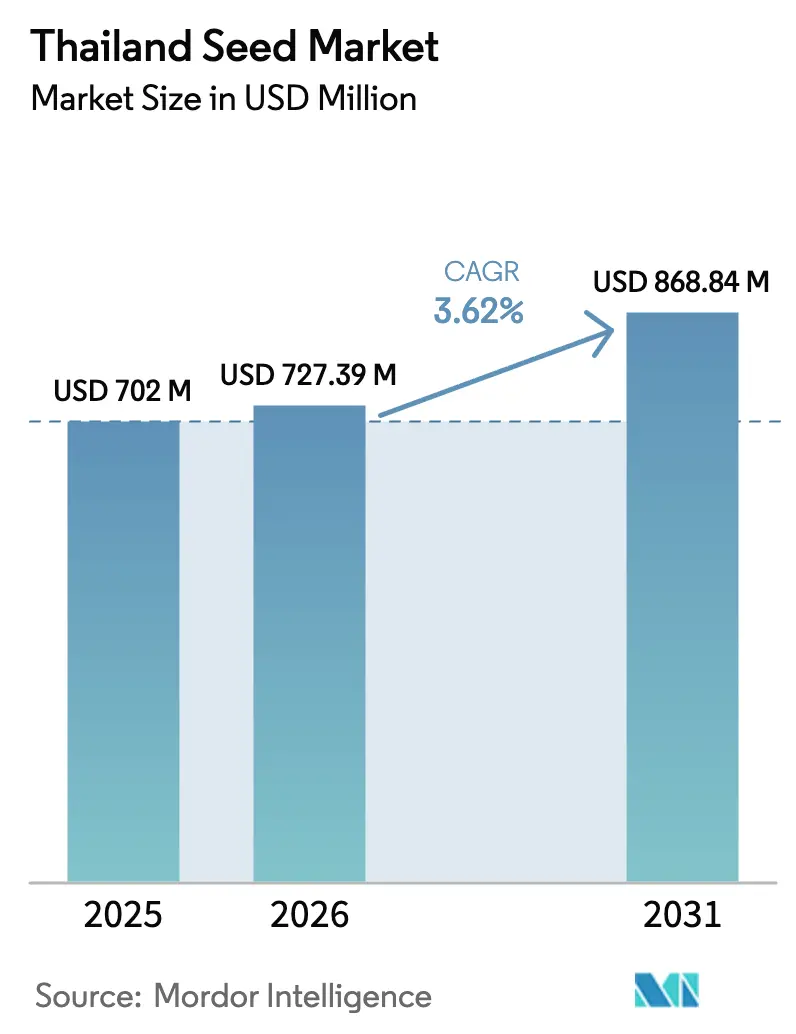
| Tamaño del mercado en el año base (2025) | 702 Millones de dólares |
| Tamaño del Mercado (2026) | 727.39 Millones de dólares |
| Tamaño del Mercado (2031) | 868.84 Millones de dólares |
| Tasa de crecimiento (2026 - 2031) | 3.62% CAGR |
| Concentración del Mercado | Bajo |
Jugadores principales *Nota aclaratoria: los principales jugadores no se ordenaron de un modo en especial Imagen © Mordor Intelligence. El uso requiere atribución según CC BY 4.0. | |
Análisis del mercado de semillas de Tailandia por Mordor Intelligence
El tamaño del mercado de semillas de Tailandia en 2026 se estima en USD 727,39 millones, creciendo desde el valor de 2025 de USD 702 millones, con proyecciones para 2031 que muestran USD 868,84 millones, a una tasa de crecimiento anual compuesta (CAGR) del 3,62% durante el período 2026-2031. Los subsidios gubernamentales continuos para el arroz híbrido, la rápida construcción de invernaderos en el Corredor Económico del Este (EEC) y la creciente demanda de semillas certificadas bajo los estándares de Buenas Prácticas Agrícolas de Tailandia (Thai GAP) impulsan el crecimiento, a pesar de una base en maduración. La volatilidad cambiaria y la escasez de agua restringen la intensidad de la siembra; sin embargo, el cultivo protegido, la distribución a través del comercio electrónico agrícola y la multiplicación por contrato en el extranjero continúan abriendo nuevas fuentes de ingresos tanto para proveedores nacionales como internacionales. Estas fuerzas ilustran cómo el apoyo de las políticas públicas y la adopción tecnológica reconfiguran conjuntamente los modelos de producción, otorgando al mercado de semillas de Tailandia un amplio margen para híbridos especializados, genética específica para invernaderos y variedades orientadas a la exportación.
Conclusiones clave del informe
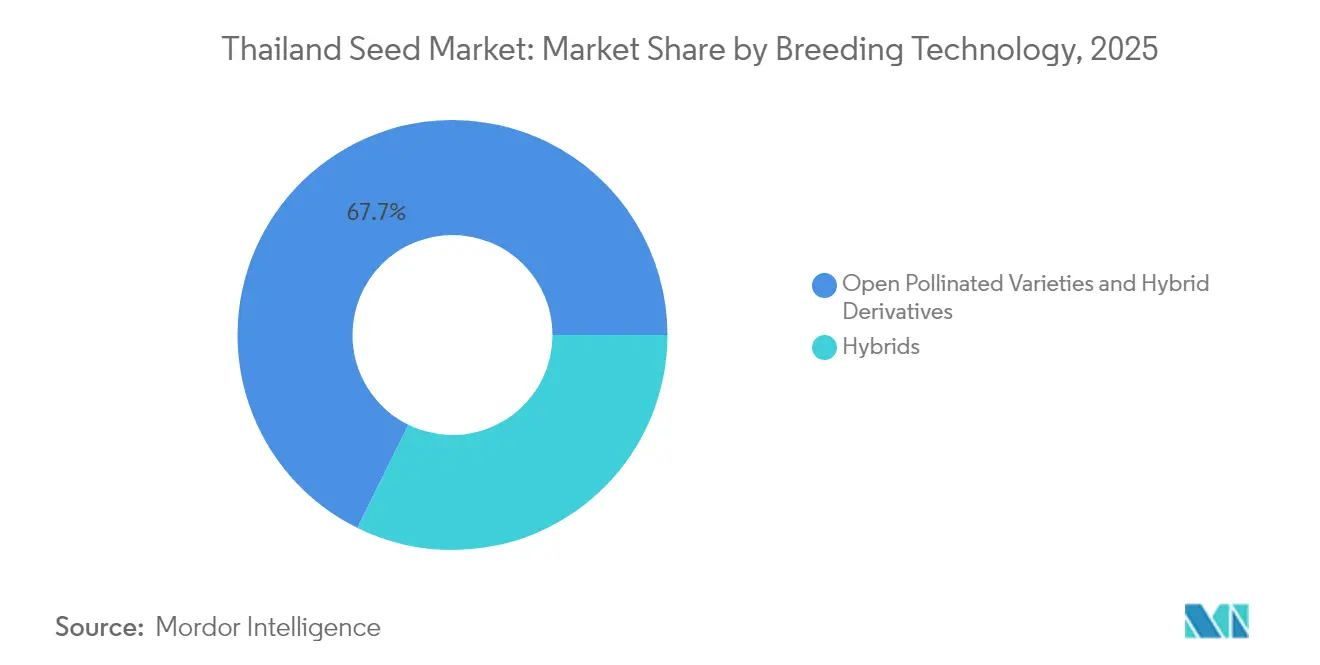
- Por tecnología de reproducción, las variedades de polinización abierta y los derivados de híbridos representaron el 67,72% de la participación del mercado de semillas de Tailandia en 2025, mientras que los híbridos avanzan a una CAGR del 5,18% hasta 2031.
- Por mecanismo de cultivo, el campo abierto representó el 99,86% del tamaño del mercado de semillas de Tailandia en 2025, y el cultivo protegido se expande a una CAGR del 6,55% hasta 2031.
- Por tipo de cultivo, los cultivos en hilera controlaron el 92,55% de la participación en ingresos en 2025, mientras que las hortalizas exhibieron la CAGR proyectada más alta del 3,74% hasta 2031.
Nota: Las cifras de tamaño del mercado y previsión de este informe se generan utilizando el marco de estimación propietario de Mordor Intelligence, actualizado con los últimos datos e información disponibles a partir de 2026.
Tendencias e información del mercado de semillas de Tailandia
Análisis del impacto de los impulsores*
| Impulsor | (~) % de impacto en el pronóstico de CAGR | Relevancia geográfica | Horizonte temporal del impacto |
|---|---|---|---|
| Continuación de los subsidios gubernamentales para semillas de arroz híbrido | +0.8% | Cinturones de cultivo de arroz a nivel nacional | Mediano plazo (2-4 años) |
| Rápida expansión de invernaderos protegidos en el EEC (Corredor Económico del Este) | +1.2% | Chonburi, Rayong y Chachoengsao | Corto plazo (≤ 2 años) |
| Iniciativas de reemplazo de semillas bajo los estándares Thai GAP | +0.6% | Centros de agricultura comercial | Largo plazo (≥ 4 años) |
| Penetración de híbridos de girasol alto oleico para el procesamiento de bocadillos | +0.4% | Clústeres del centro y norte | Mediano plazo (2-4 años) |
| Demanda de multiplicación por contrato en el extranjero desde Japón | +0.3% | Zonas de producción especializada | Corto plazo (≤ 2 años) |
| Plataformas de comercio electrónico agrícola que combinan semillas de hortalizas en micropaquetes | +0.5% | Áreas urbanas y periurbanas | Corto plazo (≤ 2 años) |
| Fuente: Mordor Intelligence | |||
Continuación de los subsidios gubernamentales para semillas de arroz híbrido
El Ministerio de Agricultura y Cooperativas extiende los incentivos para semillas de arroz híbrido dentro de su estrategia de nueve puntos destinada a triplicar los ingresos de los agricultores para 2027.[1]Fuente: PRD, "Programa de incentivos para el arroz híbrido," prd.go.th El subsidio reduce el riesgo de adopción para los pequeños agricultores del país, garantizando una demanda anual estable de híbridos certificados. Las empresas semilleras se benefician de un flujo predecible que justifica la inversión en reproducción, mientras que los servicios auxiliares, como la capacitación en extensión agrícola, mejoran el rendimiento de los híbridos en el campo. El mercado de semillas de Tailandia asegura así un pilar de ingresos confiable, anclado en las prioridades nacionales de seguridad alimentaria. No obstante, el impacto real depende de mejoras paralelas en irrigación y mecanización que liberen el potencial máximo de rendimiento de la nueva genética.
Rápida expansión de invernaderos protegidos en el EEC
Las aprobaciones de la Autoridad del Parque Industrial de Tailandia aceleran la construcción de invernaderos cerca del puerto de Laem Chabang, concentrando la demanda de semillas de hortalizas para entornos con clima controlado. Los inversionistas apuntan a un suministro durante todo el año para los canales de exportación, impulsando a los mejoradores a lanzar cultivares adaptados a alta humedad y fertirrigación intensiva. El auge localizado amplifica las economías de escala para los distribuidores y fomenta la multiplicación en el país de variedades de especialidad. A su vez, el mercado de semillas de Tailandia gana un subsegmento premium caracterizado por márgenes más altos y ciclos de vida de producto más cortos, que recompensan la innovación rápida.
Iniciativas de reemplazo de semillas bajo los estándares Thai GAP
La Oficina Nacional de Normas de Productos Agrícolas y Alimentarios hace cumplir el aprovisionamiento documentado de semillas dentro de las auditorías Thai GAP, transformando las compras de semillas de discrecionales a legalmente obligatorias para los productores certificados.[2]Fuente: ACFS, "Marco de cumplimiento Thai GAP," acfs.go.th La norma institucionaliza ciclos de compra repetidos y refuerza la ventaja de marca de los proveedores con protocolos de calidad verificables. Las granjas comerciales que exportan a Japón y a la Unión Europea consideran ahora los lotes de semillas certificadas como insumos innegociables, dando a las empresas más grandes ventaja sobre los participantes informales del mercado. Los pequeños agricultores enfrentan mayores costos de cumplimiento, lo que puede ralentizar la adopción universal, pero también estimula soluciones de micropaquetes a través de plataformas digitales.
Penetración de híbridos de girasol alto oleico para el procesamiento de bocadillos
El crecimiento en los bocadillos envasados incrementa la demanda de aceite alto oleico con vida útil extendida, impulsando a los procesadores a contratar con productores para híbridos de girasol premium.[3]Fuente: Servicio Agrícola Exterior del USDA, "Informe anual de oleaginosas 2024," usda.gov Los agricultores obtienen primas de precio que compensan los mayores desembolsos en semillas, mientras los mejoradores amplían las carteras de oleaginosas orientadas hacia características de estabilidad oxidativa. Esta alineación entre la genética en la fase inicial y los estándares de procesamiento en la fase final infunde al mercado de semillas de Tailandia un nicho de valor agregado menos sensible a las fluctuaciones de precios de los productos básicos a granel.
Análisis del impacto de las restricciones*
| Restricción | (~) % de impacto en el pronóstico de CAGR | Relevancia geográfica | Horizonte temporal del impacto |
|---|---|---|---|
| Circulación creciente de semillas de hortalizas falsificadas | -0.7% | Provincias fronterizas y mercados informales | Corto plazo (≤ 2 años) |
| Reticencia de los pequeños agricultores hacia los rasgos transgénicos en medio de debates sobre etiquetado | -0.4% | Comunidades agrícolas tradicionales | Largo plazo (≥ 4 años) |
| Volatilidad del baht que afecta las líneas parentales importadas | -0.6% | Importadores a nivel nacional | Corto plazo (≤ 2 años) |
| Cambio inducido por la escasez de agua que aleja del doble cultivo | -0.9% | Provincias del norte y noreste | Mediano plazo (2-4 años) |
| Fuente: Mordor Intelligence | |||
Circulación creciente de semillas de hortalizas falsificadas
La Real Aduana de Tailandia registró 1.100 expedientes de propiedad intelectual hasta agosto de 2024; sin embargo, los canales informales aún inundan los mercados con paquetes falsos que erosionan la confianza de los agricultores. Las pérdidas de rendimiento debidas a variedades mal etiquetadas reducen la disposición a invertir en genética premium, especialmente en cultivos de invernadero de alto valor. Los productores auténticos incurren en costos adicionales de holograma y trazabilidad mediante cadena de bloques, lo que reduce los márgenes. En respuesta, las grandes empresas colaboran con organismos de control y despliegan verificación mediante códigos QR para proteger el valor de marca en el mercado de semillas de Tailandia.
Reticencia de los pequeños agricultores hacia los rasgos transgénicos en medio de debates sobre etiquetado
Los debates en curso sobre el etiquetado de organismos genéticamente modificados (OGM), liderados por la Administración de Alimentos y Medicamentos (FDA), sostienen el escepticismo de los consumidores. Los productores temen el rechazo de los compradores y, por tanto, evitan las semillas transgénicas, lo que limita la vía comercial para los cultivos modificados genéticamente. Mientras los híbridos prosperan bajo los subsidios, las innovaciones transgénicas permanecen confinadas en parcelas de investigación. Los mejoradores desvían los presupuestos de investigación y desarrollo (I+D) hacia características no transgénicas, como la tolerancia a la sequía, retrasando avances tecnológicos más amplios en el mercado de semillas de Tailandia.
*Nuestras previsiones consideran los impactos de impulsores y restricciones como direccionales, no aditivos. Las previsiones de impacto reflejan el crecimiento base, los efectos de mezcla y las interacciones entre variables.
Análisis de segmentos
Por tecnología de reproducción: los híbridos impulsan la adopción premium
Los híbridos se aceleraron a una CAGR del 5,18% hasta 2031, aunque las líneas de polinización abierta y derivadas aún representaron el 67,72% de la participación del mercado de semillas de Tailandia en 2025. El tamaño del mercado de semillas de Tailandia para los híbridos está listo para expandirse a medida que los subsidios gubernamentales reducen las barreras de entrada para los pequeños agricultores y los procesadores organizados demandan producciones trazables y uniformes. Los híbridos no transgénicos dominan debido a preocupaciones de bioseguridad, aunque su ventaja de rendimiento sobre las variedades tradicionales sigue siendo convincente. El maíz y el girasol lideran en penetración de híbridos, mientras que la adopción en el arroz avanza más lentamente debido a que las preferencias culturales favorecen los cultivares locales glutinosos. Las alianzas de investigación con instituciones públicas acortan los ciclos de mejoramiento genético y amplían las carteras de resistencia a enfermedades.
El líder local Chia Tai comercializa 485 variedades en 42 especies, lo que subraya la amplitud de cartera como factor de éxito en entornos de demanda fragmentada. Los acuerdos de licencia con empresas emergentes multinacionales de edición génica podrían elevar aún más la diversidad de características si los marcos regulatorios evolucionan. En términos generales, la agilidad de los mejoradores para equilibrar costo, rendimiento y cumplimiento normativo dictará la velocidad de crecimiento de los híbridos dentro del mercado de semillas de Tailandia.


Por mecanismo de cultivo: los sistemas protegidos transforman la producción
La agricultura en campo abierto retuvo el 99,86% de la superficie cultivada en 2025; sin embargo, el cultivo protegido registró una CAGR pronosticada del 6,55%, lo que señala un giro estructural hacia operaciones en invernadero y casa de malla. El tamaño del mercado de semillas de Tailandia para la genética específica de invernaderos es pequeño, pero creciente, impulsado por inversionistas que buscan mayores rendimientos por metro cuadrado y cosechas estables durante todo el año. Las unidades con clima controlado admiten hortalizas premium, como el tomate cherry, el pimiento morrón y la lechuga, que alcanzan precios lucrativos en los canales de exportación y en el comercio minorista interno. Las empresas semilleras responden con cultivares tolerantes a la luz reducida y adaptan la arquitectura radicular para los sistemas hidropónicos.
Las plataformas respaldadas por el gobierno, como AGROWTH, canalizan subsidios hacia empresas emergentes de tecnología agrícola que desarrollan invernaderos modulares y soluciones de fertirrigación basadas en sensores. Estas innovaciones acortan las curvas de aprendizaje para los nuevos participantes e incrementan la base direccionable para semillas de alto valor. Mientras tanto, los agricultores en campo abierto adoptan variedades resistentes a la sequía para mitigar la volatilidad climática. Con el tiempo, es probable que la adopción del cultivo protegido se acelere principalmente en los cinturones periurbanos, donde los precios del suelo justifican la inversión de capital.
Por tipo de cultivo: las hortalizas se aceleran a pesar del dominio de los cultivos en hilera
Los cultivos en hilera, especialmente el arroz, el maíz y la yuca, representaron el 92,55% de los ingresos de 2025. Sin embargo, las hortalizas se expanden a una CAGR del 3,74% gracias a la creciente expansión de invernaderos y al aumento del consumo doméstico de productos frescos. El tamaño del mercado de semillas de Tailandia para tomates, pepinos y hortalizas de hoja atrae a mejoradores multinacionales ansiosos por capturar márgenes premium. Los grandes procesadores que abastecen segmentos de congelación rápida y bocadillos contratan superficies de cultivo, lo que permite a los agricultores absorber semillas híbridas de mayor costo.
La instalación de secado de semillas de maíz dulce de Advanta y KPAGRO en Lopburi subraya la especialización del país orientada a la exportación en cultivos de nicho que exigen un control de calidad preciso. En paralelo, las provincias de las tierras altas prueban brásicas de clima templado destinadas a los consumidores de las megalópolis asiáticas. Dentro de los cultivos en hilera, el mercado de semillas de Tailandia premia ahora las líneas de arroz de maduración corta alineadas con la siembra de una sola temporada y los híbridos de maíz tolerantes a la sequía que compensan el déficit hídrico. Las oleaginosas se benefician del procesamiento para bocadillos y piensos, mientras que las legumbres ganan superficies incrementales en los programas de rotación de cultivos.

Análisis geográfico
Las llanuras centrales concentran la demanda de semillas de arroz, aprovechando la amplia irrigación pero enfrentando la volatilidad del baht en las líneas parentales importadas. Las tierras altas del norte se especializan en hortalizas de clima templado y girasoles bajo contrato para aceite alto oleico, mientras que las provincias noreste reducen el doble cultivo debido al estrés hídrico, cambiando a yuca y legumbres que requieren menores tasas de semilla. Las zonas costeras del sur exploran semillas de frutas tropicales destinadas a plantas de procesamiento para exportación.
El Corredor Económico del Este representa la región de más rápido crecimiento en el mercado de semillas de Tailandia, debido a su logística integrada, la proximidad al puerto de aguas profundas de Laem Chabang y los generosos incentivos a la inversión. Los clústeres de invernaderos aquí demandan genética especializada y nutren una vibrante escena de empresas emergentes de tecnología agrícola financiada a través de vehículos de capital de riesgo, como la asignación de USD 30 millones de Betagro Ventures. Las provincias fronterizas del norte registran un comercio transfronterizo significativo en paquetes pequeños de semillas, lo que complica la aplicación de medidas contra las falsificaciones.
La multiplicación por contrato para clientes japoneses abarca los valles del centro y el oeste, donde los controles fitosanitarios y las distancias de aislamiento cumplen con los estrictos requisitos de importación. El Ministerio de Agricultura despliega la fuerza de tarea Phaya Nakarat para limitar las entradas ilegales de semillas, protegiendo a los mejoradores locales de la competencia desleal. Esta heterogeneidad regional obliga a las empresas a adaptar la cartera, los precios y la mecánica de distribución a las realidades de los micromercados dentro del mercado de semillas de Tailandia más amplio.
Panorama competitivo
Los principales proveedores, Groupe Limagrain, Charoen Pokphand y otros actores líderes, mantenían una participación menor del ingreso combinado en 2024, lo que hace que el mercado de semillas de Tailandia sea fragmentado. Las multinacionales aprovechan las características propietarias y las cadenas de investigación globales; sin embargo, las empresas locales sobresalen en la adaptación específica por región y en la distribución de base. El nuevo laboratorio de inspección y control de calidad de Bayer en Phitsanulok eleva los estándares de germinación y pureza, reforzando la credibilidad de la marca entre los productores orientados a la exportación.
Limagrain capitaliza en la profundidad de los híbridos de hortalizas, mientras que Syngenta avanza en el control biológico de plagas a través de una colaboración con Provivi que llevará soluciones de feromonas para el gusano cogollero del otoño en 2026. Charoen Pokphand integra el rastreo mediante cadena de bloques en las operaciones de maíz de Birmania en la fase inicial para asegurar la procedencia y podría replicar una tecnología similar en los canales de semillas tailandesas. East-West Seed sigue siendo un referente en programas de extensión dirigidos a pequeños agricultores y en tamaños de envase, lo que le otorga alcance más allá de las grandes granjas comerciales.
Las tendencias de inversión destacan el papel del capital de riesgo para cerrar las brechas de innovación. Betagro Ventures busca financiar herramientas digitales de datos agrícolas, insumos de microbioma y fenotipado de próxima generación para mantener la frescura del pipeline. Mientras tanto, los aceleradores AGROWTH financiados por el Estado distribuyen subsidios e instalaciones de prueba a empresas jóvenes, elevando gradualmente el techo tecnológico en todo el mercado de semillas de Tailandia. El posicionamiento competitivo depende así de una combinación ágil de capacidad en I+D, sofisticación regulatoria y distribución omnicanal.
Líderes de la industria de semillas de Tailandia
Syngenta Group
Advanta Seeds (UPL Ltd.)
Groupe Limagrain
Known-You Seed Co. Ltd.
Charoen Pokphand Group
- *Nota aclaratoria: los principales jugadores no se ordenaron de un modo en especial


Desarrollos recientes de la industria
- Febrero de 2025: Tailandia lanzó el Proyecto de Arroz Climáticamente Inteligente para criar variedades resilientes al clima adecuadas para la agricultura de una sola temporada.
- Febrero de 2025: En Lopburi, Tailandia, Advanta Seeds y KPAGRO inauguraron una instalación de vanguardia dedicada al secado de semillas de maíz dulce. Este avance mejora la eficiencia del procesamiento y refuerza las capacidades de suministro global. Marcando un hito significativo, subraya el estatus emergente de Tailandia como un centro fundamental para la producción de semillas de maíz tropical, un testimonio de la alianza estratégica de 19 años de ambas empresas.


Alcance del informe del mercado de semillas de Tailandia
Híbridos, Variedades de polinización abierta y derivados de híbridos están cubiertos como segmentos por tecnología de reproducción. Campo abierto, Cultivo protegido están cubiertos como segmentos por mecanismo de cultivo. Cultivos en hilera, Hortalizas están cubiertos como segmentos por tipo de cultivo.| Híbridos | Híbridos no transgénicos |
| Variedades de polinización abierta y derivados de híbridos |
| Campo abierto |
| Cultivo protegido |
| Cultivos en hilera | Cultivos de fibra | Algodón |
| Otros cultivos de fibra | ||
| Cultivos forrajeros | Maíz forrajero | |
| Sorgo forrajero | ||
| Otros cultivos forrajeros | ||
| Granos y cereales | Maíz | |
| Arroz | ||
| Sorgo | ||
| Trigo | ||
| Otros granos y cereales | ||
| Oleaginosas | Soja | |
| Girasol | ||
| Otras oleaginosas | ||
| Legumbres | ||
| Hortalizas | Brásicas | Repollo |
| Coliflor y brócoli | ||
| Otras brásicas | ||
| Cucurbitáceas | Pepino y pepinillo | |
| Calabaza y calabacín | ||
| Otras cucurbitáceas | ||
| Raíces y bulbos | Ajo | |
| Cebolla | ||
| Patata | ||
| Otras raíces y bulbos | ||
| Solanáceas | Chile | |
| Berenjena | ||
| Tomate | ||
| Otras solanáceas | ||
| Hortalizas sin clasificar | Espárrago | |
| Lechuga | ||
| Guisantes | ||
| Otras hortalizas sin clasificar | ||
| Tecnología de reproducción | Híbridos | Híbridos no transgénicos | |
| Variedades de polinización abierta y derivados de híbridos | |||
| Mecanismo de cultivo | Campo abierto | ||
| Cultivo protegido | |||
| Tipo de cultivo | Cultivos en hilera | Cultivos de fibra | Algodón |
| Otros cultivos de fibra | |||
| Cultivos forrajeros | Maíz forrajero | ||
| Sorgo forrajero | |||
| Otros cultivos forrajeros | |||
| Granos y cereales | Maíz | ||
| Arroz | |||
| Sorgo | |||
| Trigo | |||
| Otros granos y cereales | |||
| Oleaginosas | Soja | ||
| Girasol | |||
| Otras oleaginosas | |||
| Legumbres | |||
| Hortalizas | Brásicas | Repollo | |
| Coliflor y brócoli | |||
| Otras brásicas | |||
| Cucurbitáceas | Pepino y pepinillo | ||
| Calabaza y calabacín | |||
| Otras cucurbitáceas | |||
| Raíces y bulbos | Ajo | ||
| Cebolla | |||
| Patata | |||
| Otras raíces y bulbos | |||
| Solanáceas | Chile | ||
| Berenjena | |||
| Tomate | |||
| Otras solanáceas | |||
| Hortalizas sin clasificar | Espárrago | ||
| Lechuga | |||
| Guisantes | |||
| Otras hortalizas sin clasificar | |||


Definición de mercado
- Semilla comercial - Para los fines de este estudio, solo se han incluido en el alcance las semillas comerciales. Las semillas guardadas en finca, que no tienen etiquetado comercial, quedan excluidas del alcance, aunque un porcentaje menor de semillas guardadas en finca se intercambia comercialmente entre agricultores. El alcance también excluye los cultivos reproducidos vegetativamente y partes de plantas que pueden venderse comercialmente en el mercado.
- Superficie de cultivo - Al calcular la superficie cultivada bajo diferentes cultivos, se ha considerado la Superficie Bruta Cultivada. También conocida como Superficie Cosechada, según la Organización de las Naciones Unidas para la Alimentación y la Agricultura (FAO), esta incluye la superficie total cultivada bajo un cultivo particular a lo largo de las temporadas.
- Tasa de reemplazo de semillas - La tasa de reemplazo de semillas es el porcentaje de superficie sembrada sobre la superficie total del cultivo plantado en la temporada mediante semillas certificadas o de calidad, distintas de las semillas guardadas en finca.
- Cultivo protegido - El informe define el cultivo protegido como el proceso de cultivar plantas en un entorno controlado. Esto incluye invernaderos, viveros de vidrio, sistemas hidropónicos, aeropónicos o cualquier otro sistema de cultivo que proteja el cultivo contra cualquier estrés abiótico. Sin embargo, el cultivo en campo abierto con cobertura plástica (mulching) queda excluido de esta definición y se incluye bajo campo abierto.
| Palabra clave | Definición |
|---|---|
| Cultivos en hilera | Estos son generalmente los cultivos de campo que incluyen las diferentes categorías de cultivos, como granos y cereales, oleaginosas, cultivos de fibra como el algodón, legumbres y cultivos forrajeros. |
| Solanáceas | Son la familia de plantas con flores que incluye el tomate, el chile, la berenjena y otros cultivos. |
| Cucurbitáceas | Representa la familia de las cucurbitáceas, que consta de aproximadamente 965 especies en alrededor de 95 géneros. Los principales cultivos considerados para este estudio incluyen el pepino y el pepinillo, la calabaza y el calabacín, y otros cultivos. |
| Brásicas | Es un género de plantas de la familia del repollo y la mostaza. Incluye cultivos como zanahorias, repollo, coliflor y brócoli. |
| Raíces y bulbos | El segmento de raíces y bulbos incluye cebolla, ajo, patata y otros cultivos. |
| Hortalizas sin clasificar | Este segmento en el informe incluye los cultivos que no pertenecen a ninguna de las categorías mencionadas anteriormente. Estos incluyen cultivos como la okra, el espárrago, la lechuga, los guisantes, las espinacas y otros. |
| Semilla híbrida | Es la primera generación de semilla producida al controlar la polinización cruzada y al combinar dos o más variedades o especies. |
| Semilla transgénica | Es una semilla que ha sido modificada genéticamente para contener ciertos rasgos de entrada y/o salida deseables. |
| Semilla no transgénica | La semilla producida mediante polinización cruzada sin ninguna modificación genética. |
| Variedades de polinización abierta y derivados de híbridos | Las variedades de polinización abierta producen semillas fieles al tipo, ya que se polinizan de forma cruzada únicamente con otras plantas de la misma variedad. |
| Otras solanáceas | Los cultivos considerados bajo otras solanáceas incluyen los pimientos morrones y otros tipos de pimientos según la localidad de los países respectivos. |
| Otras brassicáceas | Los cultivos considerados bajo otras brásicas incluyen rábanos, nabos, coles de Bruselas y col rizada. |
| Otras raíces y bulbos | Los cultivos considerados bajo otras raíces y bulbos incluyen el camote y la yuca. |
| Otras cucurbitáceas | Los cultivos considerados bajo otras cucurbitáceas incluyen las calabazas (calabaza de botella, calabaza amarga, calabaza cresta de gallo, calabaza serpiente y otras). |
| Otros granos y cereales | Los cultivos considerados bajo otros granos y cereales incluyen cebada, trigo sarraceno, semilla canaria, triticale, avena, mijo y centeno. |
| Otros cultivos de fibra | Los cultivos considerados bajo otras fibras incluyen cáñamo, yute, fibras de agave, lino, kenaf, ramio, abacá, sisal y kapok. |
| Otras oleaginosas | Los cultivos considerados bajo otras oleaginosas incluyen cacahuete, semilla de cáñamo, semilla de mostaza, semillas de ricino, semillas de cártamo, semillas de sésamo y semillas de lino. |
| Otros cultivos forrajeros | Los cultivos considerados bajo otros forrajes incluyen la hierba napier, la hierba de avena, el trébol blanco, el ray-grass y la timotea. Los demás cultivos forrajeros se consideraron en función de la localidad de los países respectivos. |
| Legumbres | Los guandules, las lentejas, las habas y judías de caballo, las vezas, los garbanzos, los frijoles caritas, los altramuces y los frijoles bambara son los cultivos considerados bajo legumbres. |
| Otras hortalizas sin clasificar | Los cultivos considerados bajo otras hortalizas sin clasificar incluyen alcachofas, hojas de yuca, puerros, achicoria y judías verdes. |


Metodología de Investigación
Mordor Intelligence sigue una metodología de cuatro pasos en todos nuestros informes.
- Paso 1: IDENTIFICAR LAS VARIABLES CLAVE: Con el fin de construir una metodología de pronóstico robusta, las variables y factores identificados en el Paso 1 se contrastan con los datos históricos del mercado disponibles. Mediante un proceso iterativo, se establecen las variables necesarias para el pronóstico del mercado y el modelo se construye sobre la base de estas variables.
- Paso 2: CONSTRUIR UN MODELO DE MERCADO: Las estimaciones del tamaño del mercado para los años de pronóstico se expresan en términos nominales. La inflación no forma parte de la fijación de precios, y el precio de venta promedio (PVP) se mantiene constante durante todo el período de pronóstico.
- Paso 3: VALIDAR Y FINALIZAR: En este importante paso, todos los datos del mercado, las variables y las conclusiones de los analistas se validan a través de una extensa red de expertos en investigación primaria del mercado estudiado. Los encuestados se seleccionan en distintos niveles y funciones para generar una imagen holística del mercado estudiado.
- Paso 4: RESULTADOS DE LA INVESTIGACIÓN: Informes sindicados, consultoría personalizada, bases de datos y plataformas de suscripción


