Tamaño y participación del mercado de semillas de Myanmar
Visión General del Mercado
| Período de Estudio | 2018 - 2031 |
|---|---|
| Período de Datos Pronosticados | 2026 - 2031 |
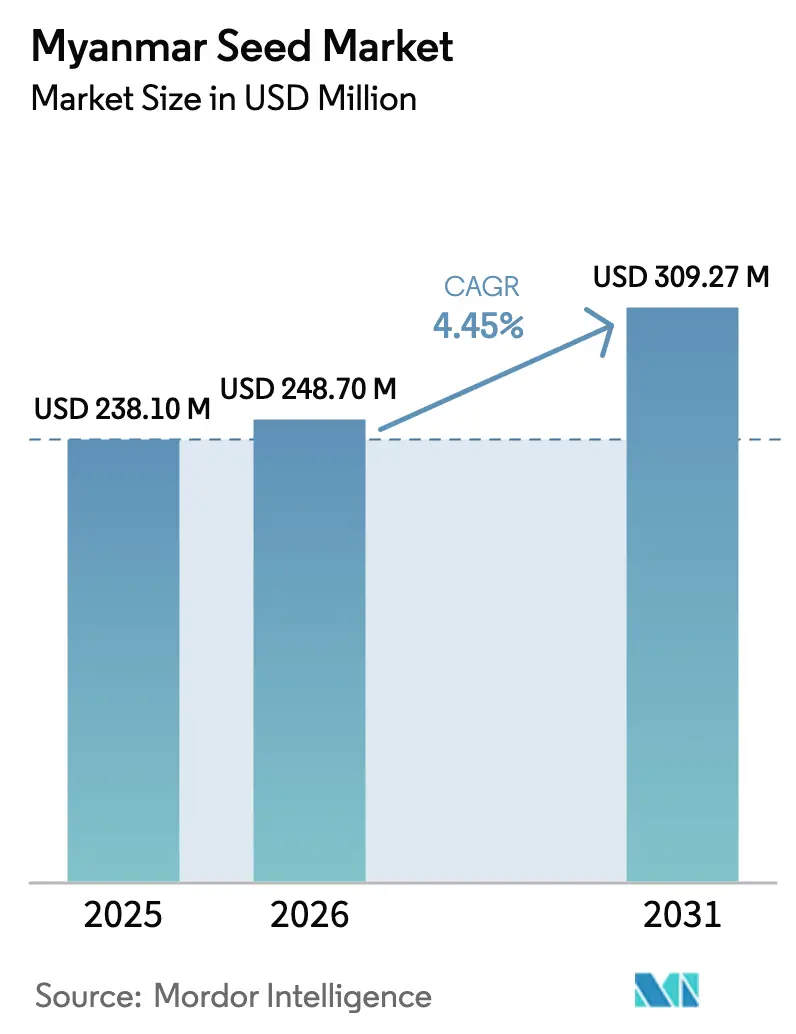
| Tamaño del mercado en el año base (2025) | 238.10 Millones de dólares |
| Tamaño del Mercado (2026) | 248.7 Millones de dólares |
| Tamaño del Mercado (2031) | 309.27 Millones de dólares |
| Tasa de crecimiento (2026 - 2031) | 4.45% CAGR |
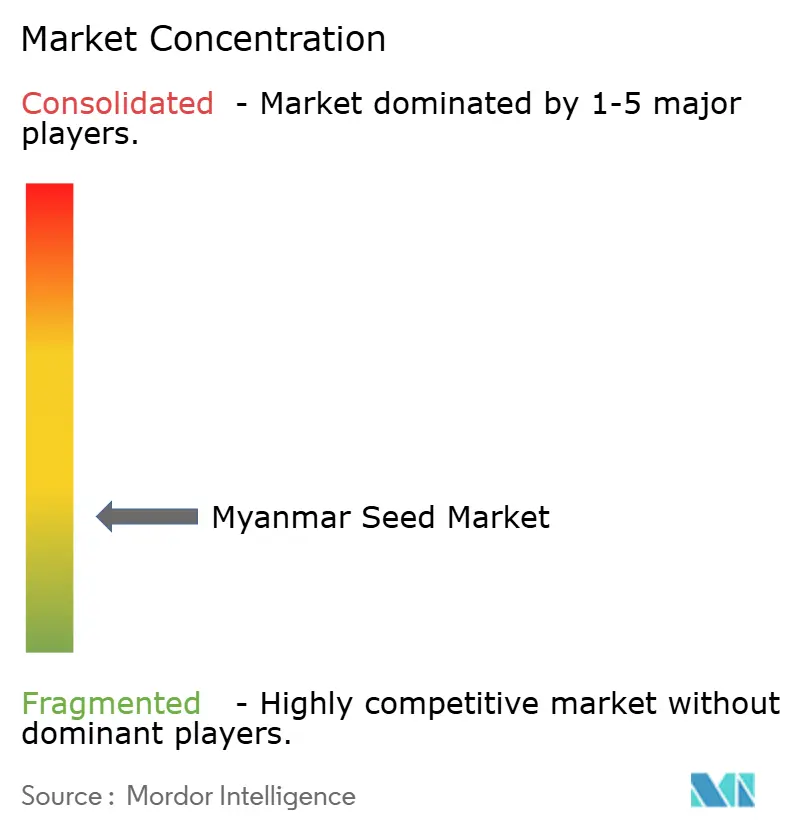
| Concentración del Mercado | Bajo |
Jugadores principales *Nota aclaratoria: los principales jugadores no se ordenaron de un modo en especial Imagen © Mordor Intelligence. El uso requiere atribución según CC BY 4.0. | |
Análisis del mercado de semillas de Myanmar por Mordor Intelligence
El tamaño del mercado de semillas de Myanmar en 2026 se estima en USD 248,7 millones, creciendo desde el valor de 2025 de USD 238,10 millones, con proyecciones para 2031 que muestran USD 309,27 millones, creciendo a una CAGR del 4,45% durante 2026-2031. La creciente preferencia de los agricultores por el maíz híbrido y el arroz, los subsidios gubernamentales en curso que exoneran los derechos de importación y la demanda sostenida de variedades resistentes al clima sustentan esta expansión a pesar de la persistente turbulencia política y económica. Las semillas híbridas ya ocupan el segmento mayoritario, aunque el sólido crecimiento de la demanda de semillas para cultivo protegido indica un cambio estructural hacia la horticultura de alto valor. La reconfiguración de la cadena de suministro, incluida la trazabilidad habilitada por blockchain y los portales digitales de comercio de semillas, ayuda a los operadores formales a llegar a los agricultores incluso cuando muchos de ellos continúan dependiendo de canales informales. El mercado de semillas de Myanmar también está condicionado por el pendiente Marco Nacional de Bioseguridad, que podría redefinir las vías regulatorias para los rasgos transgénicos una vez promulgado.
Conclusiones clave del informe
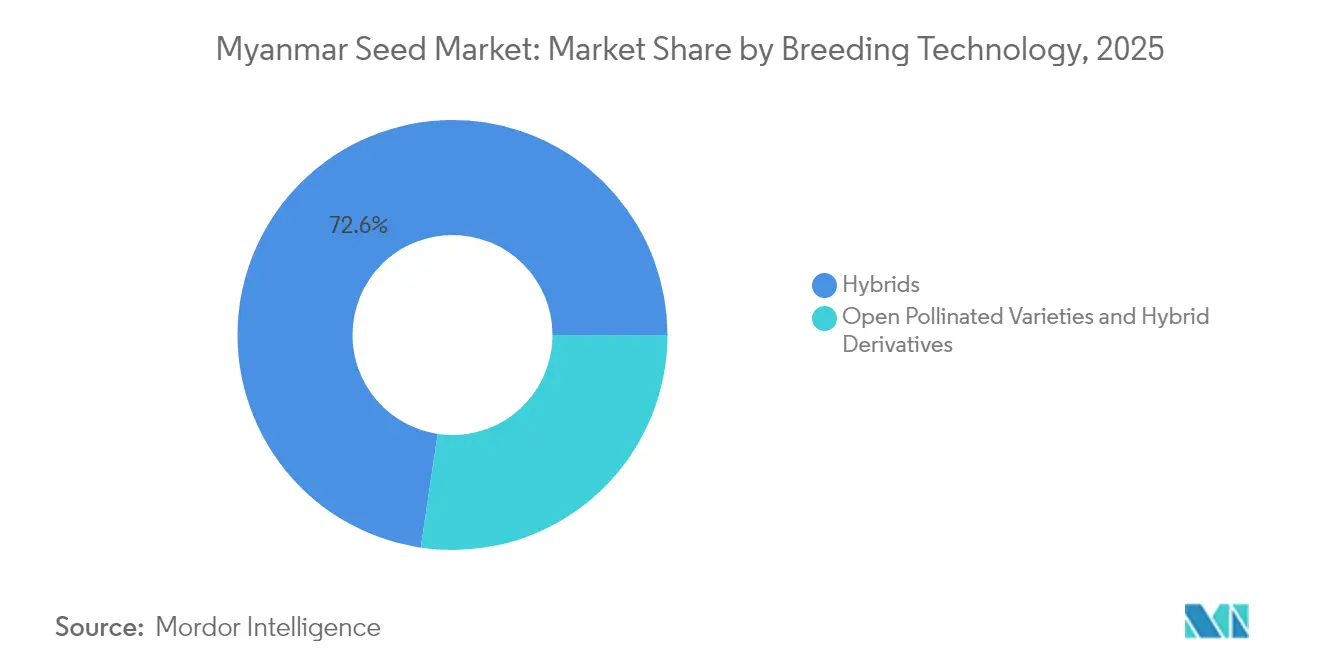
- Por tecnología de reproducción, los híbridos representaron una participación del 72,64% en el mercado de semillas de Myanmar en 2025 y también se proyecta que avancen a una CAGR del 4,55% hasta 2031.
- Por mecanismo de cultivo, la agricultura en campo abierto controló el 99,85% del tamaño del mercado de semillas de Myanmar en 2025, mientras que se prevé que las semillas para cultivo protegido se expandan a una CAGR del 8,55% hasta 2031.
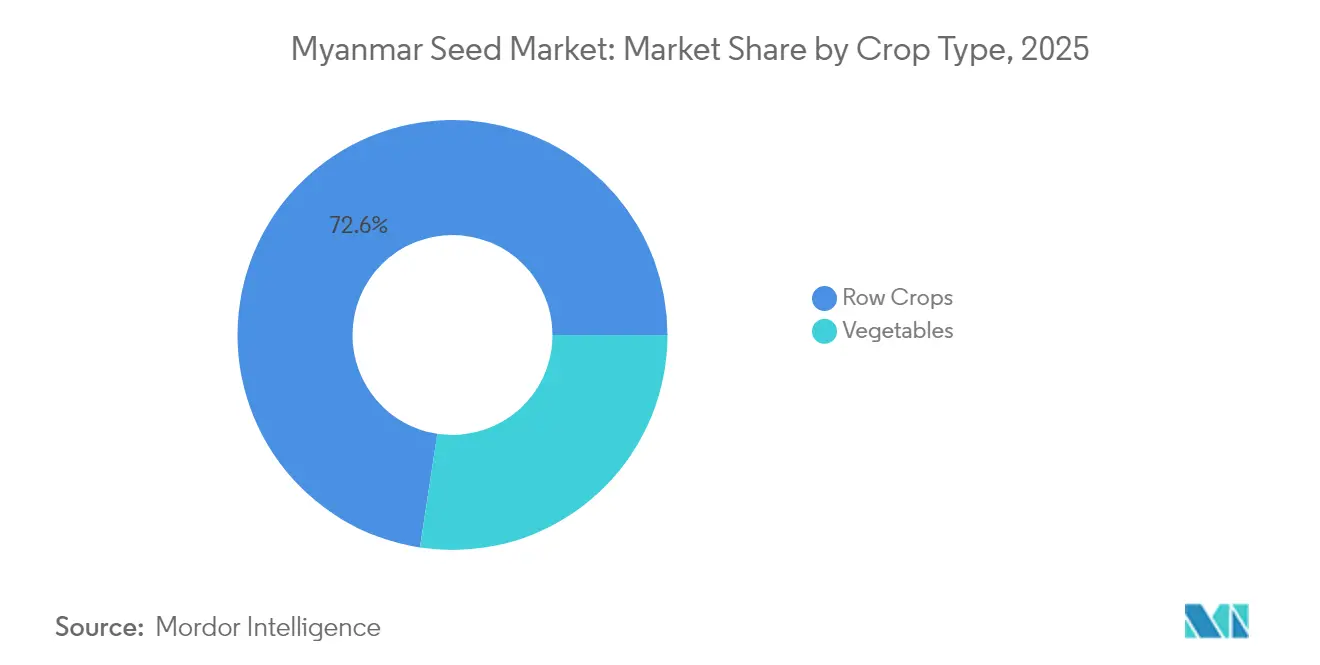
- Por tipo de cultivo, los cultivos en hilera representaron el 72,58% del mercado de semillas de Myanmar en 2025, mientras que las semillas de hortalizas se prevé que crezcan más rápido a una CAGR del 4,57% hasta 2031.
- El mercado de semillas de Myanmar está fragmentado, con las cinco principales empresas —Groupe Limagrain, Rijk Zwaan, Charoen Pokphand Group, Enza Zaden y Known You Seed— que en conjunto poseen aproximadamente el 10% de la participación de mercado.
Nota: Las cifras de tamaño del mercado y previsión de este informe se generan utilizando el marco de estimación propietario de Mordor Intelligence, actualizado con los últimos datos e información disponibles a partir de 2026.
Tendencias e información del mercado de semillas de Myanmar
Análisis del impacto de los impulsores*
| Impulsor | (~) % de impacto en el pronóstico de CAGR | Relevancia geográfica | Horizonte temporal del impacto |
|---|---|---|---|
| Adopción creciente de semillas híbridas de maíz y arroz | +1.2% | Nacional, concentrada en la Zona Seca Central y las regiones del Delta | Mediano plazo (2-4 años) |
| Expansión de la demanda de semillas de hortalizas de alto valor | +0.8% | Periferia urbana y regiones orientadas a la exportación | Corto plazo (≤ 2 años) |
| Subsidios gubernamentales e importaciones de semillas con arancel cero | +0.7% | Nacional, con mayor impacto en las zonas rurales | Largo plazo (≥ 4 años) |
| Requerimientos de variedades resistentes al clima | +1.0% | La Zona Seca Central y las zonas costeras son vulnerables a los impactos climáticos | Largo plazo (≥ 4 años) |
| Programas de recompra mediante agricultura por contrato | +0.5% | Zonas de agricultura comercial, cadenas de suministro integradas | Mediano plazo (2-4 años) |
| Plataformas digitales de comercio de semillas | +0.3% | Áreas urbanas y semiurbanas con conectividad a internet | Corto plazo (≤ 2 años) |
| Fuente: Mordor Intelligence | |||
Adopción creciente de semillas híbridas de maíz y arroz
La transición de Myanmar hacia variedades de semillas híbridas se acelera a medida que los agricultores reconocen las ventajas en rendimiento a pesar de los mayores costos de insumos, con la adopción de híbridos particularmente concentrada en zonas de agricultura comercial donde la mecanización permite prácticas de cultivo eficientes. Las iniciativas de mejoramiento genómico del Departamento de Investigación Agrícola, respaldadas por el programa SATREPS de Japón, han desarrollado variedades de arroz específicas para Myanmar que demuestran un rendimiento superior en condiciones locales. La ampliación del crédito y los servicios de extensión agrícola siguen siendo fundamentales para sostener el impulso hacia los híbridos en el mercado de semillas de Myanmar.
Expansión de la demanda de semillas de hortalizas de alto valor
Los cambios en la dieta urbana y los nichos de exportación regional están impulsando un rápido crecimiento en las semillas premium de tomate, chile y berenjena. El respaldo gubernamental a la plataforma Myanmar Rice Online, que alberga actualmente 726 almacenes registrados, agiliza la logística poscosecha para la horticultura. Los proyectos piloto de cultivo protegido aprovechan invernaderos alimentados por energía solar para suministrar productos fuera de temporada, generando primas de precio que justifican el mayor desembolso en semillas. Las concesiones comerciales de la Asociación de Naciones del Sudeste Asiático (ASEAN) ofrecen ventajas arancelarias, y la proximidad a Tailandia y China acorta los tiempos de tránsito. Sin embargo, la realización de las exportaciones depende de la estabilidad política que preserve los despachos transfronterizos y la confianza de los inversores.
Subsidios gubernamentales e importaciones de semillas con arancel cero
Las importaciones con arancel cero atraen a criadores globales, ampliando los catálogos disponibles para los pequeños agricultores. Los subsidios oficiales que cubren hasta el 30% de los costos de semillas certificadas amortiguan los riesgos de adopción en temporadas de volatilidad[1]Fuente: Eiichi Kusano, "La cadena de frío para productos agroalimentarios en la ASEAN," Instituto de Investigación Económica para la ASEAN y Asia Oriental, eria.org. La puntuación de ventaja comparativa revelada de Myanmar de 211,44 en semillas señala una capacidad de exportación latente, pero el requisito de repatriación que recientemente bloqueó a 28 exportadores ilustra la inconsistencia de las políticas. Las fluctuaciones del tipo de cambio también incrementan las necesidades de capital de trabajo para los importadores. A largo plazo, la aplicación coherente y los procedimientos fronterizos ágiles determinarán la eficacia con que dichos incentivos se traduzcan en una expansión sostenida del mercado de semillas de Myanmar.
Requerimientos de variedades resistentes al clima
Las sequías prolongadas y los monzones erráticos en la Zona Seca Central agudizan el enfoque en la genética tolerante a la sequía. Las bombas alimentadas por energía solar restablecieron el riego en 1.000 hectáreas en Magway, permitiendo a los agricultores adoptar híbridos de ciclo corto que maduran antes de los picos de calor de fin de temporada[2]Fuente: China Suntree, "Suntree contribuye al desarrollo agrícola en Myanmar," chinasuntree.com. Los proyectos piloto de seguros de índice climático lanzados en 2023 proporcionan herramientas de mitigación de riesgos que fomentan la adopción de semillas resistentes al clima de mayor valor al reducir la exposición de los agricultores a las pérdidas relacionadas con el clima. La convergencia de tecnologías de adaptación climática, productos de seguros y genética mejorada crea oportunidades de mercado para las empresas semilleras que puedan ofrecer soluciones integradas que aborden tanto los objetivos de rendimiento como los de gestión de riesgos.
Análisis del impacto de las restricciones*
| Restricción | (~) % de impacto en el pronóstico de CAGR | Relevancia geográfica | Horizonte temporal del impacto |
|---|---|---|---|
| Inestabilidad política y disrupción de la cadena de suministro | -1.5% | Nacional, con impacto severo en las regiones fronterizas | Corto plazo (≤ 2 años) |
| Aumento de los costos de semillas importadas impulsado por la inflación | -0.8% | Nacional, con impacto desproporcionado en los pequeños agricultores | Mediano plazo (2-4 años) |
| Predominio de los canales informales de semilla guardada | -0.9% | Zonas rurales, comunidades agrícolas tradicionales | Largo plazo (≥ 4 años) |
| Altos costos de financiamiento de almacenamiento para empresas semilleras de agricultores | -0.6% | Zonas rurales con infraestructura bancaria limitada | Mediano plazo (2-4 años) |
| Fuente: Mordor Intelligence | |||
Inestabilidad política y disrupción de la cadena de suministro
La turbulencia posterior al golpe de Estado obstaculiza los movimientos de semillas, ya que los bloqueos de carreteras, los puntos de control y los conflictos esporádicos inhabilitan los corredores de transporte. Uno de cada cuatro agricultores se sintió inseguro al trasladar productos en 2022, lo que obligó a los distribuidores a redirigir sus rutas por vías de mayor costo. Las empresas internacionales sopesan los riesgos de seguridad frente al potencial del mercado, reduciendo los inventarios o estableciendo alianzas más estrechas con agentes locales que puedan desenvolverse en regiones volátiles. Los flujos de importación a través de Muse y Myawaddy siguen siendo vulnerables a cierres fronterizos repentinos, lo que alarga los plazos de entrega e incrementa los costos de entrega en destino en el mercado de semillas de Myanmar.
Aumento de los costos de semillas importadas impulsado por la inflación
La depreciación monetaria y los insumos de embalaje dependientes de importaciones elevan los precios minoristas de las semillas entre un 20% y un 30% interanual. Los pequeños agricultores responden reutilizando semillas, lo que ralentiza la difusión de los híbridos, especialmente en los municipios menos comercializados. La presión sobre el capital de trabajo de los distribuidores implica ventanas de crédito más cortas para los minoristas rurales. A menos que la inflación se modere, los agricultores conscientes del valor podrían revertir aún más hacia los canales informales, perjudicando las perspectivas de crecimiento formal del mercado de semillas de Myanmar.
*Nuestras previsiones consideran los impactos de impulsores y restricciones como direccionales, no aditivos. Las previsiones de impacto reflejan el crecimiento base, los efectos de mezcla y las interacciones entre variables.
Análisis de segmentos
Por tecnología de reproducción: los híbridos impulsan la transformación del mercado
Los híbridos generaron una participación dominante del 72,64% en el mercado de semillas de Myanmar en 2025 y están en camino de registrar una CAGR del 4,55% hasta 2031. Este dominio refleja primas de rendimiento tangibles que superan los elevados costos de insumos, especialmente para el maíz y el arroz cultivados en clústeres mecanizados. Los híbridos no transgénicos representan el principal impulsor de crecimiento, ya que el marco regulatorio de Myanmar sigue sin estar desarrollado para las variedades transgénicas, con un solo evento de OGM aprobado —el algodón Bt Ngwe Chi 6—, lo que indica perspectivas limitadas a corto plazo para la expansión de la biotecnología.
La colaboración continua entre el Departamento de Investigación Agrícola y el IRRI en el marco del programa OneRice acelera el flujo de la cartera de híbridos. Las granjas de demostración en el Delta validan el rendimiento, aumentando la confianza de los agricultores. La asequibilidad de las semillas híbridas depende de la estabilidad del tipo de cambio y del despacho aduanero oportuno en la frontera. A medida que la agricultura comercial se consolida, la demanda se inclinará hacia los híbridos de cruce simple que ofrecen la uniformidad buscada por los compradores bajo contrato.


Por mecanismo de cultivo: el cultivo protegido emerge a pesar de las limitaciones de infraestructura
El cultivo en campo abierto mantiene un dominio abrumador con una participación de mercado del 99,85% en 2025, lo que refleja la extensa base de tierras agrícolas de Myanmar y la limitada inversión en infraestructura para la agricultura en entornos controlados. El cultivo protegido representa el segmento de más rápido crecimiento con una CAGR del 8,55% hasta 2031, impulsado por las oportunidades del mercado de exportación y los precios premium para hortalizas fuera de temporada.
Las instalaciones alimentadas por energía solar en Magway demuestran su viabilidad al reducir significativamente los gastos energéticos y estabilizar los rendimientos en condiciones climáticas erráticas. La ampliación de la capacidad de la cadena de frío a escala nacional respalda la integridad poscosecha. No obstante, la intensidad de capital restringe la adopción a agricultores progresistas en zonas periurbanas. El acceso a préstamos concesionales y asesoría técnica sigue siendo esencial para escalar el cultivo protegido más allá de los grupos piloto.
Por tipo de cultivo: las hortalizas desafían el dominio de los cultivos en hilera
Los cultivos en hilera ostentan una participación de mercado del 72,58% en 2025, lo que refleja la tradición agrícola de Myanmar en la producción de arroz, maíz y oleaginosas, que constituye la base de la seguridad alimentaria nacional y los ingresos por exportaciones. Los granos y cereales, en particular el arroz, dominan este segmento dado el posicionamiento de Myanmar como exportador tradicional de arroz, con la producción de cereales concentrada en el cultivo de arroz en cáscara. Las oleaginosas, incluidas el girasol, la canola y la soja, se benefician del desarrollo de la industria procesadora y el acceso a los mercados de exportación, mientras que los cultivos de fibra, encabezados por el algodón, mantienen su importancia en las regiones de fabricación textil. Las leguminosas representan una oportunidad emergente dentro de los cultivos en hilera, a medida que aumenta la demanda de proteínas y se amplían las prácticas de rotación de cultivos.
Las semillas de hortalizas, aunque de menor volumen, son las de más rápido crecimiento con una CAGR del 4,57%, impulsadas por las dietas urbanas y los canales de exportación de la Asociación de Naciones del Sudeste Asiático (ASEAN). Las solanáceas y las cucurbitáceas lideran el volumen, con lotes de tomate trazables que obtienen primas de precio en los mercados mayoristas de Bangkok. Los proyectos de invernadero están optimizando híbridos resistentes a enfermedades que prolongan la vida útil en estantería. Aunque las hortalizas aún están por detrás de los cultivos en hilera, su impulso refleja objetivos de diversificación que pueden proteger a los agricultores de las fluctuaciones en los precios de los productos básicos.
Análisis geográfico
La geografía del mercado de semillas de Myanmar refleja las diversas zonas agroecológicas del país y los distintos niveles de comercialización agrícola, siendo el Delta del Ayeyarwady y la Zona Seca Central los principales centros de demanda de variedades comerciales de semillas. La agricultura dominada por el arroz en la región del Delta genera una demanda sustancial de semillas de arroz híbrido, mientras que la vulnerabilidad de la Zona Seca Central a la sequía y el estrés térmico impulsa la adopción de variedades resistentes al clima en múltiples tipos de cultivo. Las regiones del norte, incluido el Estado de Shan, se benefician de las relaciones comerciales transfronterizas y las operaciones de agricultura comercial, como lo evidencia la implementación del sistema de trazabilidad de maíz de CP Group en 570.000 acres, que demuestra el desarrollo de la agricultura comercial a gran escala.
Las zonas costeras enfrentan una creciente intrusión de salinidad y riesgos de ciclones que generan demanda de variedades tolerantes al estrés, mientras que las regiones montañosas mantienen sistemas agrícolas tradicionales con penetración limitada de semillas comerciales. Las mejoras viales a lo largo de la Carretera Trilateral India-Myanmar-Tailandia podrían reducir los tiempos de entrega, aunque los plazos de finalización siguen siendo inciertos debido a retrasos en la financiación. La cobertura de los servicios de extensión agrícola es desigual; en promedio, un técnico atiende a 534 familias agricultoras, aunque los distritos del Delta están mejor atendidos que los montañosos de Kachin. Las aplicaciones digitales de asesoría agrícola cubren algunas brechas, particularmente donde la cobertura 4G es superior. La diferenciación del riesgo climático moldea la demanda regional: sésamo tolerante a la sequía en Magway, arroz tolerante a inundaciones en Rakáin y sorgo resistente a la sal en la franja costera. Dicha microsegmentación obliga a las empresas semilleras a diversificar sus carteras para asegurar relevancia a nivel nacional en el mercado de semillas de Myanmar.
Panorama competitivo
El mercado de semillas de Myanmar está fragmentado, con los cinco principales operadores formales captando alrededor del 10% de la participación en valor. Las multinacionales como Syngenta, Bayer y Corteva distribuyen a través de agentes locales para mitigar el riesgo operativo. El peso regional CP Group aprovecha su escala en el Sudeste Asiático para financiar la I+D y el mercadeo, mientras que el modelo centrado en el agricultor de East-West Seed entrega híbridos de hortalizas en presentaciones pequeñas, adecuadas para propiedades fragmentadas.
El campeón nacional Myanmar Awba Group cuenta con 1.500 agrónomos que atienden a 3,2 millones de familias agricultoras, integrando protección de cultivos, financiamiento y aplicaciones digitales. Este paquete de servicios fortalece la fidelidad a la marca y posiciona a la empresa para capitalizar el cambio del mercado de semillas de Myanmar hacia soluciones de valor agregado. Los participantes extranjeros tienen en mira la protección de patentes tras la implementación en mayo de 2024 de la Ley de Patentes de Myanmar, que por primera vez protege las invenciones relacionadas con plantas.
La adopción de tecnología diferencia a los competidores: la analítica satelital de CP Group reduce el riesgo de falsificaciones, los proyectos piloto de Climate FieldView de Bayer ofrecen prescripción de semillas a tasa variable, y el mercado Golden Paddy de Myanmar Awba Group conecta a 300.000 usuarios. Las empresas que combinan genética con agronomía y servicios de datos están bien posicionadas para capturar la participación futura en el mercado de semillas de Myanmar, a medida que los agricultores demanden paquetes holísticos de productividad.
Líderes de la industria de semillas de Myanmar
Groupe Limagrain
Known You Seed Co. LTD
Rijk Zwaan Zaadteelt en Zaadhandel BV
Enza Zaden Beheer B.V.
Charoen Pokphand Co. Ltd. (CP Group)
- *Nota aclaratoria: los principales jugadores no se ordenaron de un modo en especial

Desarrollos recientes de la industria
- Marzo de 2025: Bayer expandió su Iniciativa Global para Pequeños Agricultores, que tiene como objetivo llegar a 100 millones de pequeños agricultores en todo el mundo para 2030. El programa se centra en el desarrollo de variedades de semillas resistentes al clima y en la entrega de soluciones agrícolas integradas mediante colaboraciones con organizaciones locales. Se espera que estos esfuerzos beneficien a los mercados de semillas del Sudeste Asiático, incluido Myanmar, al mejorar el acceso a tecnologías de semillas mejoradas y apoyo agronómico para los pequeños agricultores.
- Diciembre de 2024: CP Group lanzó un sistema integral de trazabilidad del maíz en Myanmar que abarca 570.000 acres en el sur del Estado de Shan, utilizando imágenes satelitales y tecnología blockchain para garantizar la calidad de las semillas y la integridad de la cadena de suministro a lo largo del ciclo de producción.
- Mayo de 2024: La Ley de Patentes de Myanmar N.° 7/2019 entró en vigor, brindando protección de propiedad intelectual para las innovaciones en semillas y los desarrollos en mejoramiento vegetal, con solicitudes de patente siguiendo la publicación del Reglamento de Patentes y las estructuras de tarifas.


Alcance del informe del mercado de semillas de Myanmar
Los híbridos, las variedades de polinización abierta y los derivados de híbridos se incluyen como segmentos por tecnología de reproducción. El campo abierto y el cultivo protegido se incluyen como segmentos por mecanismo de cultivo. Los cultivos en hilera y las hortalizas se incluyen como segmentos por tipo de cultivo.| Híbridos | Híbridos no transgénicos | |
| Híbridos transgénicos | Híbridos resistentes a insectos | |
| Variedades de polinización abierta y derivados de híbridos | ||
| Campo abierto |
| Cultivo protegido |
| Cultivos en hilera | Cultivos de fibra | Algodón |
| Otros cultivos de fibra | ||
| Cultivos forrajeros | Alfalfa | |
| Maíz forrajero | ||
| Sorgo forrajero | ||
| Otros cultivos forrajeros | ||
| Granos y cereales | Maíz | |
| Arroz | ||
| Sorgo | ||
| Trigo | ||
| Otros granos y cereales | ||
| Oleaginosas | Canola, colza y mostaza | |
| Soja | ||
| Girasol | ||
| Otras oleaginosas | ||
| Leguminosas | ||
| Hortalizas | Brasicáceas | Repollo |
| Zanahoria | ||
| Coliflor y brócoli | ||
| Otras brasicáceas | ||
| Cucurbitáceas | Pepino y pepinillo | |
| Calabaza y zapallo | ||
| Otras cucurbitáceas | ||
| Raíces y bulbos | Ajo | |
| Cebolla | ||
| Papa | ||
| Otras raíces y bulbos | ||
| Solanáceas | Chile | |
| Berenjena | ||
| Tomate | ||
| Otras solanáceas | ||
| Hortalizas sin clasificar | Espárrago | |
| Okra | ||
| Guisantes | ||
| Otras hortalizas sin clasificar | ||
| Tecnología de reproducción | Híbridos | Híbridos no transgénicos | |
| Híbridos transgénicos | Híbridos resistentes a insectos | ||
| Variedades de polinización abierta y derivados de híbridos | |||
| Mecanismo de cultivo | Campo abierto | ||
| Cultivo protegido | |||
| Tipo de cultivo | Cultivos en hilera | Cultivos de fibra | Algodón |
| Otros cultivos de fibra | |||
| Cultivos forrajeros | Alfalfa | ||
| Maíz forrajero | |||
| Sorgo forrajero | |||
| Otros cultivos forrajeros | |||
| Granos y cereales | Maíz | ||
| Arroz | |||
| Sorgo | |||
| Trigo | |||
| Otros granos y cereales | |||
| Oleaginosas | Canola, colza y mostaza | ||
| Soja | |||
| Girasol | |||
| Otras oleaginosas | |||
| Leguminosas | |||
| Hortalizas | Brasicáceas | Repollo | |
| Zanahoria | |||
| Coliflor y brócoli | |||
| Otras brasicáceas | |||
| Cucurbitáceas | Pepino y pepinillo | ||
| Calabaza y zapallo | |||
| Otras cucurbitáceas | |||
| Raíces y bulbos | Ajo | ||
| Cebolla | |||
| Papa | |||
| Otras raíces y bulbos | |||
| Solanáceas | Chile | ||
| Berenjena | |||
| Tomate | |||
| Otras solanáceas | |||
| Hortalizas sin clasificar | Espárrago | ||
| Okra | |||
| Guisantes | |||
| Otras hortalizas sin clasificar | |||


Definición de mercado
- Semilla comercial - Para los fines de este estudio, solo se han incluido en el alcance las semillas comerciales. Las semillas guardadas en finca, que no están etiquetadas comercialmente, quedan excluidas del alcance, aunque un pequeño porcentaje de semillas guardadas en finca se intercambia comercialmente entre agricultores. El alcance también excluye los cultivos reproducidos vegetativamente y las partes de plantas que pueden comercializarse en el mercado.
- Área cosechada por cultivo - Al calcular el área sembrada bajo los diferentes cultivos, se ha considerado el Área Bruta Cultivada. También conocida como Área Cosechada, según la Organización de las Naciones Unidas para la Alimentación y la Agricultura (FAO), esta incluye el área total cultivada bajo un determinado cultivo a lo largo de las temporadas.
- Tasa de reemplazo de semillas - La tasa de reemplazo de semillas es el porcentaje de área sembrada sobre el área total del cultivo plantado en la temporada mediante el uso de semillas certificadas o de calidad distintas a la semilla guardada en finca.
- Cultivo protegido - El informe define el cultivo protegido como el proceso de cultivo de plantas en un entorno controlado. Esto incluye invernaderos, casas de vidrio, hidroponía, aeroponía o cualquier otro sistema de cultivo que proteja al cultivo contra cualquier estrés abiótico. Sin embargo, el cultivo en campo abierto utilizando acolchado plástico queda excluido de esta definición y se incluye bajo campo abierto.
| Palabra clave | Definición |
|---|---|
| Cultivos en hilera | Estos son generalmente los cultivos de campo que incluyen las diferentes categorías de cultivo, como granos y cereales, oleaginosas, cultivos de fibra como el algodón, leguminosas y cultivos forrajeros. |
| Solanáceas | Esta es la familia de plantas con flores que incluye el tomate, el chile, las berenjenas y otros cultivos. |
| Cucurbitáceas | Representa la familia de las cucurbitáceas, que consta de aproximadamente 965 especies en alrededor de 95 géneros. Los cultivos principales considerados en este estudio incluyen pepino y pepinillo, calabaza y zapallo, y otros cultivos. |
| Brasicáceas | Es un género de plantas de la familia del repollo y la mostaza. Incluye cultivos como zanahorias, repollo, coliflor y brócoli. |
| Raíces y bulbos | El segmento de raíces y bulbos incluye cebolla, ajo, papa y otros cultivos. |
| Hortalizas sin clasificar | Este segmento del informe incluye los cultivos que no pertenecen a ninguna de las categorías mencionadas anteriormente. Estos incluyen cultivos como okra, espárrago, lechuga, guisantes, espinaca y otros. |
| Semilla híbrida | Es la primera generación de semilla producida controlando la polinización cruzada y combinando dos o más variedades o especies. |
| Semilla transgénica | Es una semilla que ha sido modificada genéticamente para contener ciertos rasgos deseables de entrada y/o salida. |
| Semilla no transgénica | La semilla producida mediante polinización cruzada sin ninguna modificación genética. |
| Variedades de polinización abierta y derivados de híbridos | Las variedades de polinización abierta producen semillas fieles al tipo, ya que se polinizan de forma cruzada únicamente con otras plantas de la misma variedad. |
| Otras solanáceas | Los cultivos considerados bajo otras solanáceas incluyen pimientos morrón y otros pimientos diferentes según la localidad de los respectivos países. |
| Otras brasicáceas | Los cultivos considerados bajo otras brasicáceas incluyen rábanos, nabos, coles de Bruselas y col rizada. |
| Otras raíces y bulbos | Los cultivos considerados bajo otras raíces y bulbos incluyen batatas y yuca. |
| Otras cucurbitáceas | Los cultivos considerados bajo otras cucurbitáceas incluyen calabazas (calabaza de botella, calabaza amarga, calabaza de cresta, calabaza serpiente y otras). |
| Otros granos y cereales | Los cultivos considerados bajo otros granos y cereales incluyen cebada, trigo sarraceno, alpiste, triticale, avena, mijo y centeno. |
| Otros cultivos de fibra | Los cultivos considerados bajo otras fibras incluyen cáñamo, yute, fibras de agave, lino, kenaf, ramio, abacá, sisal y kapok. |
| Otras oleaginosas | Los cultivos considerados bajo otras oleaginosas incluyen maní, semilla de cáñamo, semilla de mostaza, semillas de ricino, semillas de cártamo, semillas de sésamo y semillas de lino. |
| Otros cultivos forrajeros | Los cultivos considerados bajo otros forrajes incluyen pasto napier, pasto de avena, trébol blanco, raigrás y timoteo. Los otros cultivos forrajeros fueron considerados según la localidad de los respectivos países. |
| Leguminosas | Las leguminosas, las lentejas, las habas y los frijoles, las arvejillas, los garbanzos, las caupí, los altramuces y los frijoles bambara son los cultivos considerados bajo leguminosas. |
| Otras hortalizas sin clasificar | Los cultivos considerados bajo otras hortalizas sin clasificar incluyen alcachofas, hojas de yuca, puerros, achicoria y judías verdes. |


Metodología de Investigación
Mordor Intelligence sigue una metodología de cuatro pasos en todos nuestros informes.
- Paso 1: IDENTIFICAR LAS VARIABLES CLAVE: Con el fin de desarrollar una metodología de pronóstico sólida, las variables y los factores identificados en el Paso 1 se contrastan con los datos históricos del mercado disponibles. Mediante un proceso iterativo, se establecen las variables necesarias para el pronóstico del mercado y el modelo se construye sobre la base de dichas variables.
- Paso 2: CONSTRUIR UN MODELO DE MERCADO: Las estimaciones del tamaño del mercado para los años de pronóstico se expresan en términos nominales. La inflación no forma parte de la fijación de precios, y el precio de venta promedio (PVP) se mantiene constante a lo largo del período de pronóstico.
- Paso 3: VALIDAR Y FINALIZAR: En este importante paso, todos los datos del mercado, las variables y las valoraciones de los analistas se validan a través de una extensa red de expertos en investigación primaria del mercado estudiado. Los encuestados se seleccionan en distintos niveles y funciones para generar una visión integral del mercado estudiado.
- Paso 4: RESULTADOS DE LA INVESTIGACIÓN: Informes sindicados, encargos de consultoría personalizada, bases de datos y plataformas de suscripción


