Tamaño y Participación del Mercado de Aceites de Motor Automotriz de Asia Pacífico
Visión General del Mercado
| Período de Estudio | 2020 - 2031 |
|---|---|
| Período de Datos Pronosticados | 2026 - 2031 |
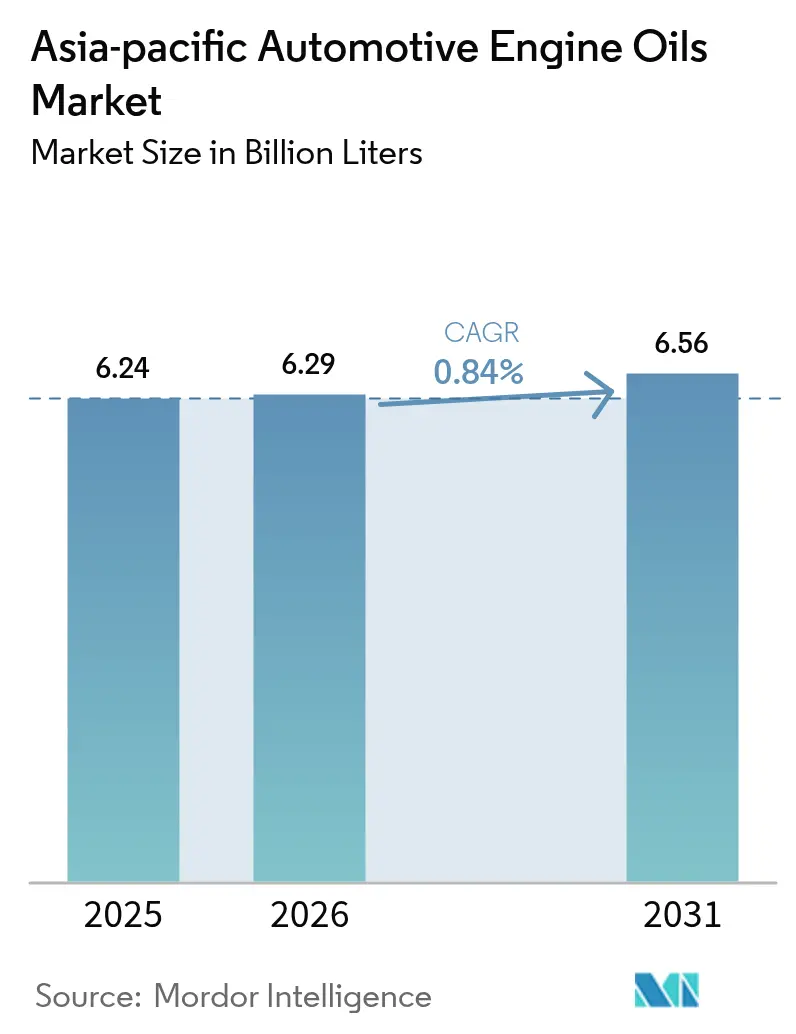
| Tamaño del mercado en el año base (2025) | 6.24 Mil millones de litros |
| Volumen del Mercado (2026) | 6.29 Mil millones de litros |
| Volumen del Mercado (2031) | 6.56 Mil millones de litros |
| Tasa de crecimiento (2026 - 2031) | 0.84% CAGR |
| Concentración del Mercado | Medio |
Jugadores principales *Nota aclaratoria: los principales jugadores no se ordenaron de un modo en especial Imagen © Mordor Intelligence. El uso requiere atribución según CC BY 4.0. | |
Análisis del Mercado de Aceites de Motor Automotriz de Asia Pacífico por Mordor Intelligence
Se espera que el tamaño del Mercado de Aceites de Motor Automotriz de Asia Pacífico crezca de 6,24 mil millones de litros en 2025 a 6,29 mil millones de litros en 2026, y se prevé que alcance 6,56 mil millones de litros en 2031 con una CAGR del 0,84% durante 2026-2031. El crecimiento moderado de la región se deriva de patrones de movilidad divergentes, en los que una flota de vehículos con motor de combustión interna (MCI) aún en expansión en las economías emergentes de la ASEAN compensa la creciente participación de vehículos electrificados en los países maduros. Los proveedores están, por tanto, desplazando su enfoque estratégico de la escala de volumen hacia la optimización del valor, haciendo hincapié en formulaciones sintéticas premium, relaciones de llenado de fábrica aprobadas por el fabricante de equipos originales (OEM) y distribución orientada al servicio. El endurecimiento de las normas de eficiencia de combustible acelera la adopción de grados de baja viscosidad, mientras que las flotas de transporte por aplicación incrementan el consumo de lubricante por vehículo, a pesar de moderar el crecimiento general del parque automotor. La mayor competencia, especialmente en China, está acelerando la diferenciación tecnológica a medida que las empresas pivotan hacia fluidos de alto rendimiento para trenes de potencia híbridos y eléctricos.
Conclusiones Clave del Informe
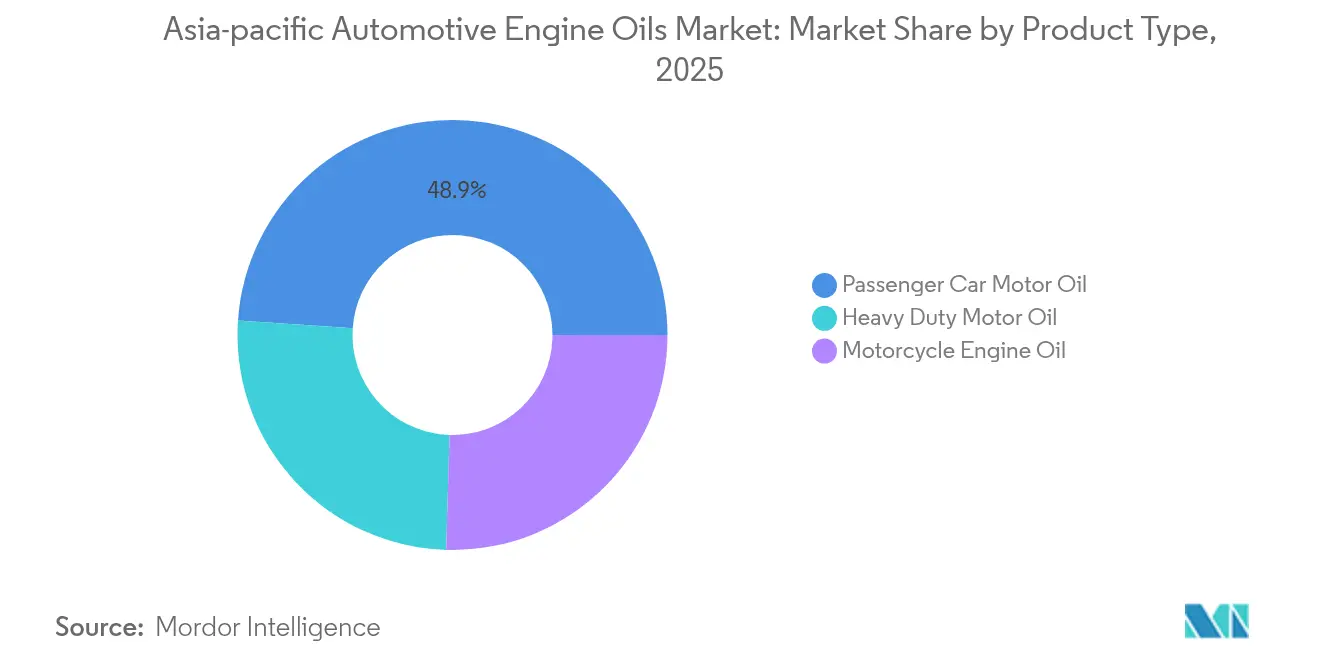
- Por tipo de producto, el Aceite de Motor para Automóviles de Pasajeros representó el 48,92% de la participación del mercado de Aceites de Motor Automotriz de Asia Pacífico en 2025, mientras que se proyecta que el Aceite de Motor para Motocicletas crezca a una CAGR del 0,93% hasta 2031.
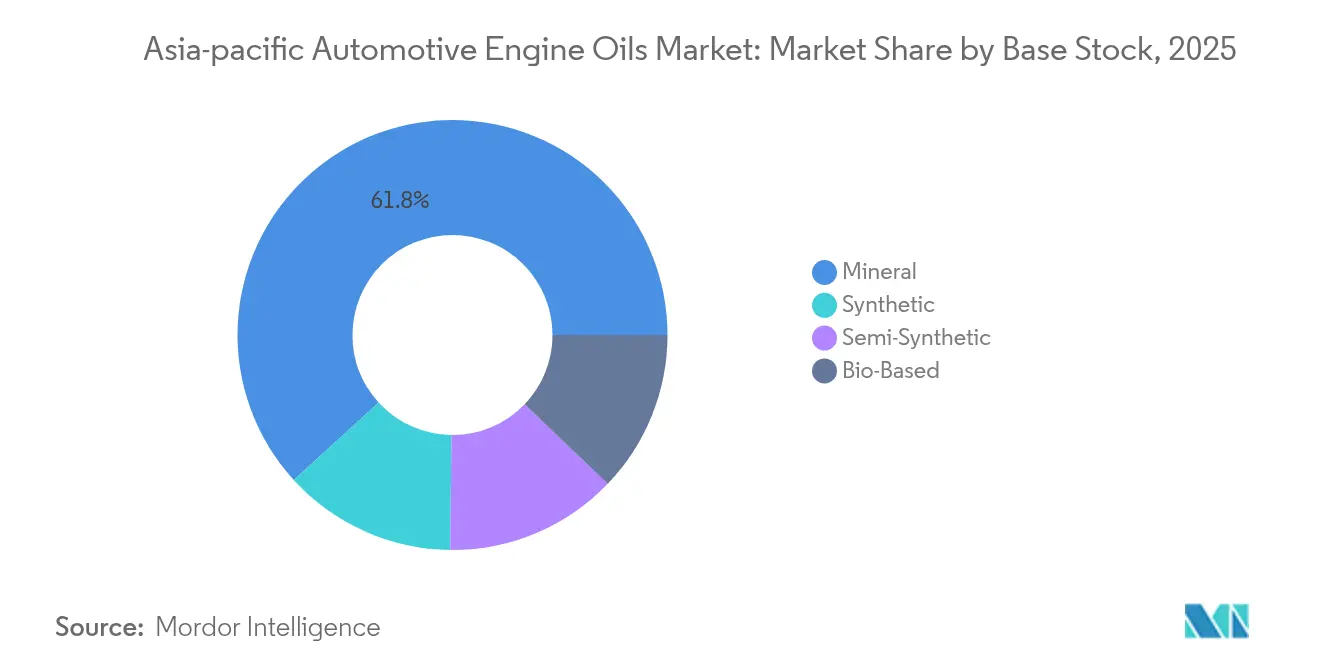
- Por base de aceite, los aceites minerales representaron el 61,78% del tamaño del mercado de Aceites de Motor Automotriz de Asia Pacífico en 2025; se espera que los sintéticos registren el mayor crecimiento previsto con una CAGR del 1,08%.
- Por geografía, China lideró con una participación en los ingresos del 34,78% en 2025, mientras que se prevé que Vietnam registre el crecimiento más rápido con una CAGR del 3,12% hasta 2031.
Nota: Las cifras de tamaño del mercado y previsión de este informe se generan utilizando el marco de estimación propietario de Mordor Intelligence, actualizado con los últimos datos e información disponibles a partir de 2026.
Tendencias e Información del Mercado de Aceites de Motor Automotriz de Asia Pacífico
Análisis del Impacto de los Impulsores*
| Impulsor | (~) % de Impacto en el Pronóstico de CAGR | Relevancia Geográfica | Horizonte Temporal del Impacto |
|---|---|---|---|
| El parque de MCI aún se expande en la ASEAN emergente | +0.3% | Indonesia, Tailandia, Vietnam, Malasia | Mediano plazo (2-4 años) |
| Acuerdos de llenado de fábrica con OEM y grandes empresas de lubricantes | +0.25% | China, Japón, Corea del Sur | Largo plazo (≥ 4 años) |
| Endurecimiento de las normas de eficiencia de combustible de Asia Pacífico | +0.2% | Japón, Corea del Sur, China, India | Mediano plazo (2-4 años) |
| Auge del transporte por aplicación en horas-motor | +0.15% | ASEAN, China, centros urbanos de India | Corto plazo (≤ 2 años) |
| Híbridos de extensión de autonomía con dos ruedas electrificados | +0.1% | Taiwán, Japón, Sudeste Asiático | Largo plazo (≥ 4 años) |
| Fuente: Mordor Intelligence | |||
El parque de MCI aún se expande en la ASEAN emergente
El rápido crecimiento de la flota vehicular en Vietnam, Indonesia, Tailandia y Malasia continúa impulsando una demanda positiva de lubricantes convencionales, incluso a medida que avanza la electrificación. La hoja de ruta automotriz de Vietnam apunta a 1 millón de ventas anuales de vehículos para 2030, lo que implica un crecimiento de dos dígitos y mayores volúmenes de llenado de fábrica para los ensambladores locales[1]Vietnam Investment Review, "Vietnam apunta a un millón de automóviles anuales para 2030," vir.com.vn. La flota de 125,31 millones de motocicletas de Indonesia sostiene igualmente un alto consumo de Aceite de Motor para Motocicletas, ya que el desplazamiento cotidiano sigue siendo predominantemente en dos ruedas. Las normas de localización que exigen un contenido doméstico del 55-60% para 2030 estimulan las plantas de mezcla regionales, que reducen los costos logísticos y permiten formulaciones personalizadas para los ciclos de trabajo en climas tropicales. En todos estos mercados, el mercado de aceites de motor automotriz de Asia Pacífico se beneficia de la demanda posventa vinculada a los intervalos de mantenimiento de motores pequeños, comunes en el tráfico urbano congestionado. Los proveedores que aprovechan este potencial al alza despliegan programas de formación para distribuidores y cadenas de servicio de marca para asegurar compras recurrentes.
Las alianzas de llenado de fábrica con OEM impulsan el crecimiento del segmento premium
Los fabricantes de automóviles integran cada vez más las marcas de lubricantes en sus propuestas de garantía, canalizando las compras hacia proveedores aprobados. Los recientes acuerdos entre Shell y varios fabricantes japoneses demuestran cómo el codesarrollo de mezclas 0W-20 y 5W-30, adaptadas para motores híbridos, respalda intervalos de drenaje extendidos de hasta 10.000 km. La colaboración de TotalEnergies con Kia también vincula las recomendaciones de lubricación a la telemetría del OEM, que insta a las visitas de servicio, aumentando así la fidelización del cliente. Estos programas desplazan el ámbito competitivo de los estantes minoristas hacia los centros de diseño, recompensando a los formuladores con química de aditivos que equilibra la eficiencia de combustible, el arranque a baja temperatura y la durabilidad del convertidor catalítico. A medida que aumentan las ventas de híbridos, los volúmenes de llenado de fábrica actúan como puertas de acceso a rentables mercados posventa en concesionarios, reforzando el valor de marca y acelerando la trayectoria de premiumización del mercado de aceites de motor automotriz de Asia Pacífico.
El endurecimiento de las normas de eficiencia de combustible acelera la adopción de grados de baja viscosidad
Los mandatos de eficiencia de combustible de primer nivel de Japón, los objetivos de Estándares Corporativos de Economía de Combustible Promedio (CAFE) de India y el sistema de doble crédito de China están impulsando una rápida transición desde los grados heredados 20W-50 hacia formulaciones 0W-20 y 5W-20. Para cumplir estas normas, los OEM reducen el tamaño de los motores y elevan las presiones del turbocompresor, demandando lubricantes con mayor estabilidad de cizallamiento a alta temperatura. Las bases sintéticas del Grupo III responden a esa necesidad, llevando a refinadores como Shell a reconvertir la planta de Wesseling para la producción de bases premium. Esta alineación regulatoria agudiza la propuesta de valor del mercado de aceites de motor automotriz de Asia Pacífico, incentivando la inversión en I+D (investigación y desarrollo) en dispersantes detergentes que protegen los sistemas de recirculación de gases de escape contra las altas cargas de hollín. Los proveedores que dominan las químicas de baja viscosidad obtienen una ventaja de primer movedor a medida que los motores de inyección directa más pequeños proliferan en los segmentos de automóviles compactos.
La expansión del transporte por aplicación intensifica la demanda de lubricantes comerciales
Las flotas de transporte por aplicación urbano en Yakarta, Bangkok, Bombay y Manila frecuentemente acumulan de cuatro a cinco veces el kilometraje de los automóviles privados, lo que resulta en un consumo de lubricante desproporcionado. Los gestores de flotas se centran en reducir el tiempo de inactividad, priorizando los sintéticos de alto rendimiento que duplican los intervalos de drenaje mientras mantienen la limpieza del pistón bajo ciclos de arranque y parada. Este perfil de uso incrementa el consumo por vehículo, compensando en parte el crecimiento más lento en la propiedad de automóviles privados. Los proveedores de lubricantes incorporan cada vez más el monitoreo de vida útil del aceite basado en telemetría para asegurar contratos de servicio a largo plazo. Para el mercado de aceites de motor automotriz de Asia Pacífico, estos vehículos de uso intensivo anclan bolsas de demanda incluso en ciudades donde las políticas de electrificación son más agresivas.
Análisis del Impacto de las Restricciones*
| Restricción | (~) % de Impacto en el Pronóstico de CAGR | Relevancia Geográfica | Horizonte Temporal del Impacto |
|---|---|---|---|
| Penetración de vehículos eléctricos en automóviles de pasajeros de China | -0.4% | China, efecto secundario en la ASEAN | Mediano plazo (2-4 años) |
| Especificaciones de intervalos de drenaje más largos del OEM | -0.25% | Liderado por Japón y Corea del Sur | Largo plazo (≥ 4 años) |
| Impulso gubernamental hacia los biolubricantes | -0.15% | India, Indonesia, Malasia | Largo plazo (≥ 4 años) |
| Fuente: Mordor Intelligence | |||
La penetración de vehículos eléctricos restringe el crecimiento de la demanda tradicional
El acelerado giro de China hacia los automóviles eléctricos de batería elimina por completo los requisitos de lubricación del motor e influye en las hojas de ruta de políticas de la ASEAN. La participación de los vehículos eléctricos en la región alcanzó el 13% en 2024 y está en camino de alcanzar 8,5 millones de unidades para 2035[2]Instituto de Investigación Económica para la ASEAN y Asia Oriental, "Perspectivas de los Vehículos Eléctricos 2024," eria.or.id. Aunque los híbridos moderan el declive al conservar motores pequeños, el volumen total de lubricante por vehículo se contrae, obligando a los proveedores a diversificarse hacia fluidos de gestión térmica para vehículos eléctricos y aceites de transmisión. Los modelos de distribución también deben adaptarse a medida que los ecosistemas de carga reconfiguran la economía de las estaciones de servicio, comprimiendo los flujos de ingresos convencionales de los cambios de aceite en todo el mercado de aceites de motor automotriz de Asia Pacífico.
Los intervalos de drenaje extendidos reducen los requisitos de frecuencia de servicio
Las formulaciones avanzadas de aditivos permiten ahora intervalos de 10.000-15.000 km para automóviles de pasajeros y programas basados en ciclos de trabajo para motores comerciales. Cummins y Hyundai publican directrices de drenaje optimizadas que reducen las visitas al taller en un 30-40%, lo que disminuye directamente los litros consumidos por vehículo. Aunque los sintéticos alcanzan precios unitarios más altos, el impacto neto en el volumen sigue siendo negativo, lo que supone un desafío para los distribuidores tradicionales de alta rotación. Los productores responden ofreciendo análisis de estado del aceite y paneles de mantenimiento predictivo para integrarse en las cadenas de valor de las flotas, en lugar de depender únicamente del rendimiento por volumen.
*Nuestras previsiones consideran los impactos de impulsores y restricciones como direccionales, no aditivos. Las previsiones de impacto reflejan el crecimiento base, los efectos de mezcla y las interacciones entre variables.
Análisis de Segmentos
Por Tipo de Producto: el Aceite de Motor para Automóviles de Pasajeros lidera aunque el Aceite de Motor para Motocicletas supera en crecimiento
El Aceite de Motor para Automóviles de Pasajeros generó la mayor porción del mercado de aceites de motor automotriz de Asia Pacífico en 2025 con un 48,92%, beneficiándose del aún dominante parque de vehículos de pasajeros de la región. El Aceite de Motor para Motocicletas, sin embargo, es el de crecimiento más rápido, con una CAGR del 0,93% hasta 2031, impulsado por el predominio de los vehículos de dos ruedas en las megalópolis de la ASEAN y la aparición de scooters híbridos de extensión de autonomía. El aceite de motor para uso pesado se mantiene estable, reflejando la constante inversión en infraestructura y la expansión del flete regional.
El crecimiento del Aceite de Motor para Motocicletas también se alinea con la experimentación de los OEM en motores híbridos de pequeña cilindrada que funcionan a régimen constante para tareas de generación, demandando lubricantes térmicamente robustos. Los proveedores atentos a este nicho desarrollan grados 10W-30 estables al cizallamiento que son compatibles con los sistemas de embrague en baño de aceite comúnmente encontrados en los diseños de motocicletas asiáticas. A medida que aumenta la congestión urbana, el uso de scooters de transporte compartido crece, y las cadenas de servicio que comercializan cambios de aceite rápidos en quioscos de carretera profundizan la fidelización del consumidor. En general, los portafolios de productos diversificados permiten a los proveedores amortiguar la desaceleración de los volúmenes de Aceite de Motor para Automóviles de Pasajeros mientras se aprovechan del segmento de Aceite de Motor para Motocicletas de crecimiento más rápido del mercado de aceites de motor automotriz de Asia Pacífico.
Nota: Las participaciones de todos los segmentos individuales están disponibles con la compra del informe


Por Base de Aceite: la mayoría mineral apoya el impulso sintético
Los aceites minerales aún representan el 61,78% de la participación del mercado de Aceites de Motor Automotriz de Asia Pacífico debido a la sensibilidad al precio en los segmentos de mercado masivo y las cadenas de suministro consolidadas. Sin embargo, los sintéticos registran la CAGR más sólida del 1,08% gracias a la penetración de vehículos premium, la regulación de eficiencia de combustible y los mandatos de servicio extendido. Las mezclas semisintéticas cubren la brecha intermedia, ofreciendo un rendimiento superior a precios accesibles.
Los compromisos de capital de las grandes empresas subrayan el cambio: la actualización de la refinería de Wesseling de Shell hacia la producción de bases del Grupo III y la ampliación de la capacidad de aditivos de Ruifeng garantizan la disponibilidad regional de bases de alta calidad. El precio promedio del aceite base 150N doméstico de China de 8.651 CNY por tonelada en el primer semestre de 2024 (USD 1.211 por tonelada) influye en la economía del lubricante terminado en toda la región. La cobertura de bases de aceite y la flexibilidad de formulación se convierten así en palancas vitales para la rentabilidad en la competencia por el tamaño del mercado de aceites de motor automotriz de Asia Pacífico.
Nota: Las participaciones de todos los segmentos individuales están disponibles con la compra del informe
Análisis Geográfico
China ancla la demanda con una participación del 34,78%, reflejando su gran parque vehicular y activos integrados de refinación; sin embargo, el crecimiento se modera en medio de un pronunciado giro hacia los vehículos eléctricos y la saturación del mercado. La producción alcanzó 7,39 millones de toneladas en 2024, y los gigantes estatales CNPC y Sinopec aprovechan su escala para defender aproximadamente la mitad de las ventas del país. El énfasis regulatorio en la baja viscosidad y los estándares de calidad acelera la adopción de sintéticos y la diferenciación de mezclas premium.
En contraste, se proyecta que Vietnam registre la CAGR más rápida del 3,12% hasta 2031, a medida que los programas gubernamentales apuntan a 1 millón de ventas anuales de vehículos y un contenido doméstico del 70%, fomentando así nuevos volúmenes de llenado de fábrica y oportunidades en el mercado posventa. Más de 377 fabricantes de componentes, 169 de ellos con inversión extranjera, sustentan un creciente ecosistema de piezas que favorece las plantas de mezcla locales. Los mandatos emergentes de producción de vehículos híbridos y eléctricos también posicionan a Vietnam como un escenario de crecimiento de doble tecnología para el mercado de aceites de motor automotriz de Asia Pacífico.
Los países vecinos de la ASEAN, como Indonesia, Tailandia y Malasia, contribuyen con volúmenes incrementales considerables a través de una flota vehicular combinada de más de 200 millones de unidades, dominada por motocicletas. Las políticas que mezclan incentivos para vehículos eléctricos con objetivos de exportación de MCI generan una estructura de demanda combinada que sostiene el consumo de aceite mineral mientras empuja los sintéticos al alza. Mientras tanto, Japón y Corea del Sur marcan la pauta tecnológica, exportando estrictas normas de viscosidad y expectativas de drenaje extendido a la región en general a través de la presencia de sus OEM. En conjunto, estas variadas trayectorias crean un mosaico en el que los actores ágiles adaptan sus líneas de productos, precios y modelos de servicio a las realidades de movilidad local en todo el mercado de aceites de motor automotriz de Asia Pacífico.
Panorama Competitivo
El mercado de Aceites de Motor Automotriz de Asia Pacífico está moderadamente consolidado. Los giros estratégicos giran cada vez más en torno a portafolios de fluidos para vehículos electrificados y servicios digitales para flotas. La expansión de bases del Grupo III de Shell y la I+D (investigación y desarrollo) en fluidos para vehículos eléctricos ejemplifican cómo los actores consolidados readaptan sus activos para las necesidades de lubricación híbrida y de baterías eléctricas. El apetito por fusiones y adquisiciones (M&A) se centra en fabricantes de aditivos y mezcladores regionales que abastecen los canales de llenado de fábrica de OEM en clústeres de alto crecimiento como Vietnam e Indonesia. Simultáneamente, el gasto de capital en líneas piloto de biolubricantes refleja una cobertura ante movimientos de política que favorecen el contenido renovable. En este entorno, la diferenciación sostenida depende de integrar la innovación química con ecosistemas de servicio que aseguren volúmenes de negocio recurrente en todo el mercado de aceites de motor automotriz de Asia Pacífico.
Líderes de la Industria de Aceites de Motor Automotriz de Asia Pacífico
Exxon Mobil Corporation
Shell plc
BP p.l.c.
CNPC
China Petrochemical Corporation
- *Nota aclaratoria: los principales jugadores no se ordenaron de un modo en especial


Desarrollos Recientes de la Industria
- Agosto de 2025: Shell India lanzó su renovado aceite de motor automotriz premium, Shell Helix Ultra, adaptado para alinearse con el vanguardista Estándar API SQ 2025. La empresa también introdujo un llamativo nuevo diseño de envase para su línea de lubricantes Shell Helix, destacando una estética contemporánea.
- Septiembre de 2024: PETRONAS Lubricants International (PLI) presentó PETRONAS Nexta, una nueva línea de aceites de motor. Adaptados para el mercado de lubricantes de Tailandia, estos aceites prometen un rendimiento premium sin el precio premium. Desarrollado pensando en los conductores conscientes del costo, PETRONAS Nexta es un producto del Centro Global de Investigación y Tecnología de la empresa ubicado en Turín, Italia.


Alcance del Informe del Mercado de Aceites de Motor Automotriz de Asia Pacífico
| Aceite de Motor para Automóviles de Pasajeros (PCMO) | 0W-XX |
| 5W-XX | |
| 10W-XX | |
| 15W-XX | |
| Monogrados | |
| Otros Grados | |
| Aceite de Motor para Uso Pesado (HDMO) | 0W-XX |
| 5W-XX | |
| 10W-XX | |
| 15W-XX | |
| Monogrados | |
| Otros Grados | |
| Aceite de Motor para Motocicletas (MCO) | 0W-XX |
| 5W-XX | |
| 10W-XX | |
| 15W-XX | |
| Monogrados | |
| Otros Grados |
| Mineral |
| Sintético |
| Semisintético |
| De Base Biológica |
| China |
| India |
| Pakistán |
| Bangladés |
| Japón |
| Corea del Sur |
| Taiwán |
| Australia |
| Malasia |
| Indonesia |
| Tailandia |
| Vietnam |
| Resto de Asia Pacífico |
| Por Tipo de Resina | Aceite de Motor para Automóviles de Pasajeros (PCMO) | 0W-XX |
| 5W-XX | ||
| 10W-XX | ||
| 15W-XX | ||
| Monogrados | ||
| Otros Grados | ||
| Aceite de Motor para Uso Pesado (HDMO) | 0W-XX | |
| 5W-XX | ||
| 10W-XX | ||
| 15W-XX | ||
| Monogrados | ||
| Otros Grados | ||
| Aceite de Motor para Motocicletas (MCO) | 0W-XX | |
| 5W-XX | ||
| 10W-XX | ||
| 15W-XX | ||
| Monogrados | ||
| Otros Grados | ||
| Por Base de Aceite | Mineral | |
| Sintético | ||
| Semisintético | ||
| De Base Biológica | ||
| Por Geografía | China | |
| India | ||
| Pakistán | ||
| Bangladés | ||
| Japón | ||
| Corea del Sur | ||
| Taiwán | ||
| Australia | ||
| Malasia | ||
| Indonesia | ||
| Tailandia | ||
| Vietnam | ||
| Resto de Asia Pacífico | ||


Preguntas Clave Respondidas en el Informe
¿Cuál es el tamaño actual y las perspectivas de crecimiento del mercado de aceites de motor automotriz de Asia Pacífico?
El mercado se sitúa en 6,29 mil millones de litros en 2026 y se proyecta que alcance 6,56 mil millones de litros en 2031, registrando una CAGR del 0,84%.
¿Qué categoría de producto lidera la demanda en Asia Pacífico?
El Aceite de Motor para Automóviles de Pasajeros sigue siendo dominante con una participación del 48,92%, aunque el Aceite de Motor para Motocicletas es el de expansión más rápida.
¿Cómo está afectando la adopción de vehículos eléctricos a los proveedores de lubricantes?
El aumento de la penetración de vehículos eléctricos reduce los volúmenes tradicionales de aceite de motor, pero abre oportunidades en fluidos de gestión térmica específicos para vehículos eléctricos y lubricantes para la línea de transmisión.
¿Por qué son estratégicos para las empresas de lubricantes los acuerdos de llenado de fábrica con OEM?
Los contratos de llenado de fábrica garantizan volúmenes asegurados, integran las marcas de lubricantes en los programas de servicio del vehículo y aceleran la adopción sintética premium.
¿Qué países están impulsando la próxima fase de expansión de la demanda?
Vietnam, Indonesia, Tailandia y Malasia muestran el crecimiento incremental más sólido debido a la expansión del parque vehicular y las políticas industriales de apoyo.
Última actualización de la página el:


