
Market Overview
| Study Period | 2020 - 2031 |
|---|---|
| Forecast Data Period | 2026 - 2031 |
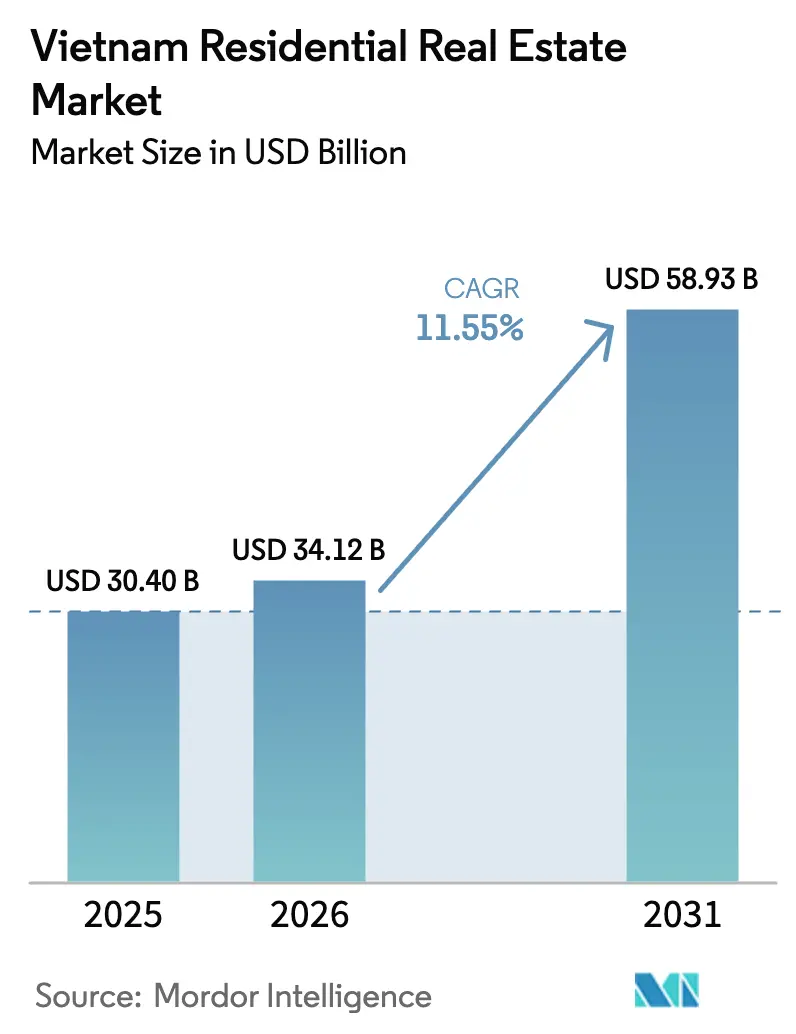
| Base Year Market Size (2025) | USD 30.40 Billion |
| Market Size (2026) | USD 34.12 Billion |
| Market Size (2031) | USD 58.93 Billion |
| Growth Rate (2026 - 2031) | 11.55% CAGR |
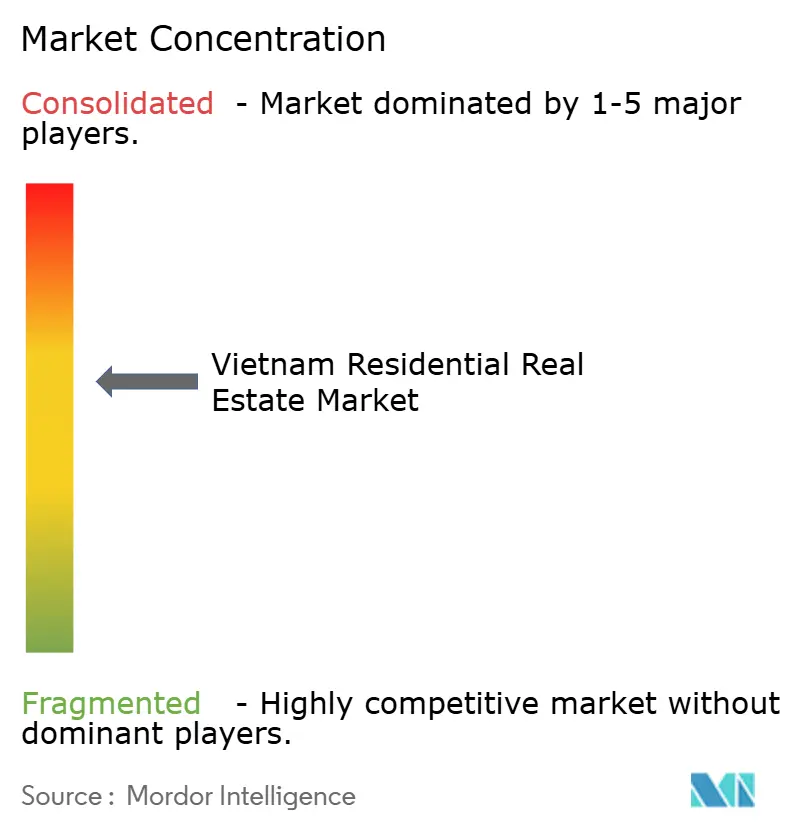
| Market Concentration | Medium |
Major Players *Disclaimer: Major Players sorted in no particular order Image © Mordor Intelligence. Reuse requires attribution under CC BY 4.0. | |
Vietnam Residential Real Estate Market Analysis by Mordor Intelligence
The Vietnam residential real estate market size stood at USD 34.12 billion in 2026 and is projected to reach USD 58.93 billion by 2031, advancing at an 11.55% CAGR over the forecast period. Rapid urbanization, favorable demographics, and large-scale transport upgrades continue to funnel demand into the Vietnam residential real estate market, while regulatory reforms improve capital inflows and shorten approval cycles. Growing purchasing power among a middle class that is expected to exceed 36 million people by 2030 is lifting mid-market absorption, even as social-housing incentives expand the affordable bracket. Transit-oriented projects tied to Ho Chi Minh City Metro Line 1 and the eight-line Hanoi network are elevating land prices along new corridors, spurring master-planned communities that mix apartments, villas, and commercial space. Intensifying competition is pushing developers toward joint ventures, PropTech adoption, and differentiated products ranging from green-certified apartments to build-to-rent portfolios, helping the Vietnam residential real estate market preserve double-digit growth momentum.
Key Report Takeaways
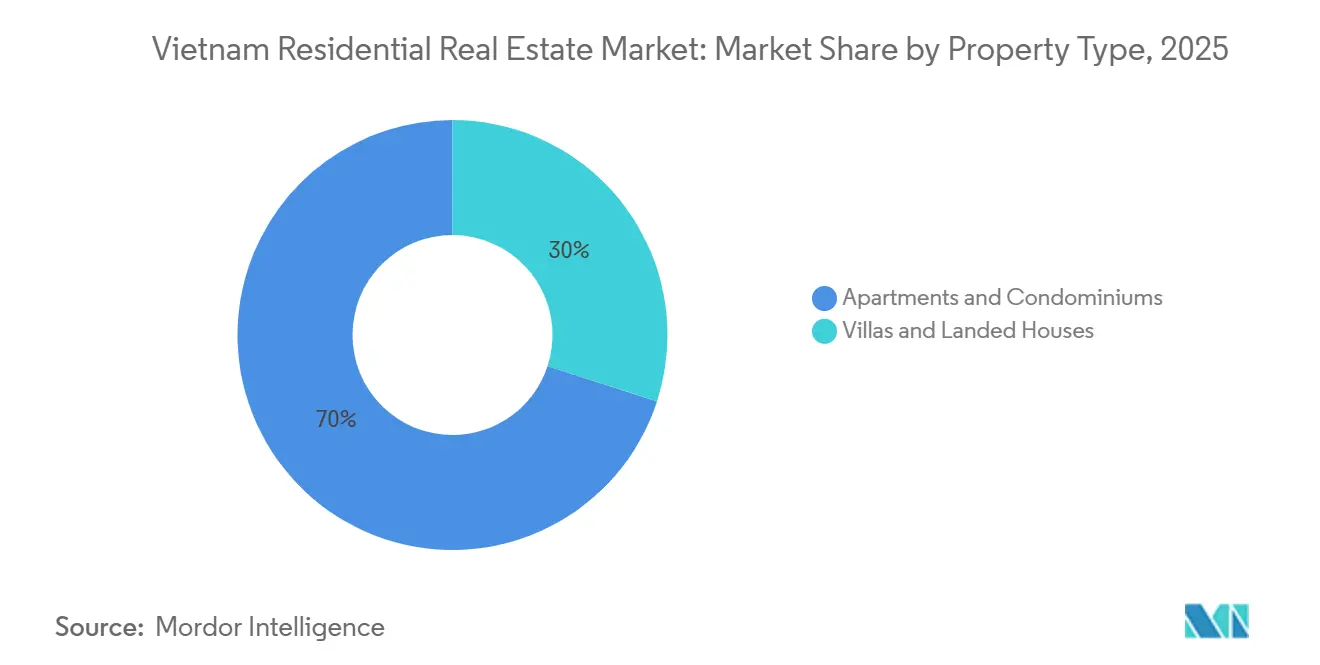
- By property type, apartments and condominiums led with 70% of Vietnam's residential real estate market share in 2025, while villas and landed houses are forecast to expand at a 12.17% CAGR through 2031.
- By price band, mid-market units captured 48% of the Vietnam residential real estate market size in 2025; the affordable segment is poised to grow at a 13.28% CAGR from 2026 to 2031 on the back of subsidized mortgages.
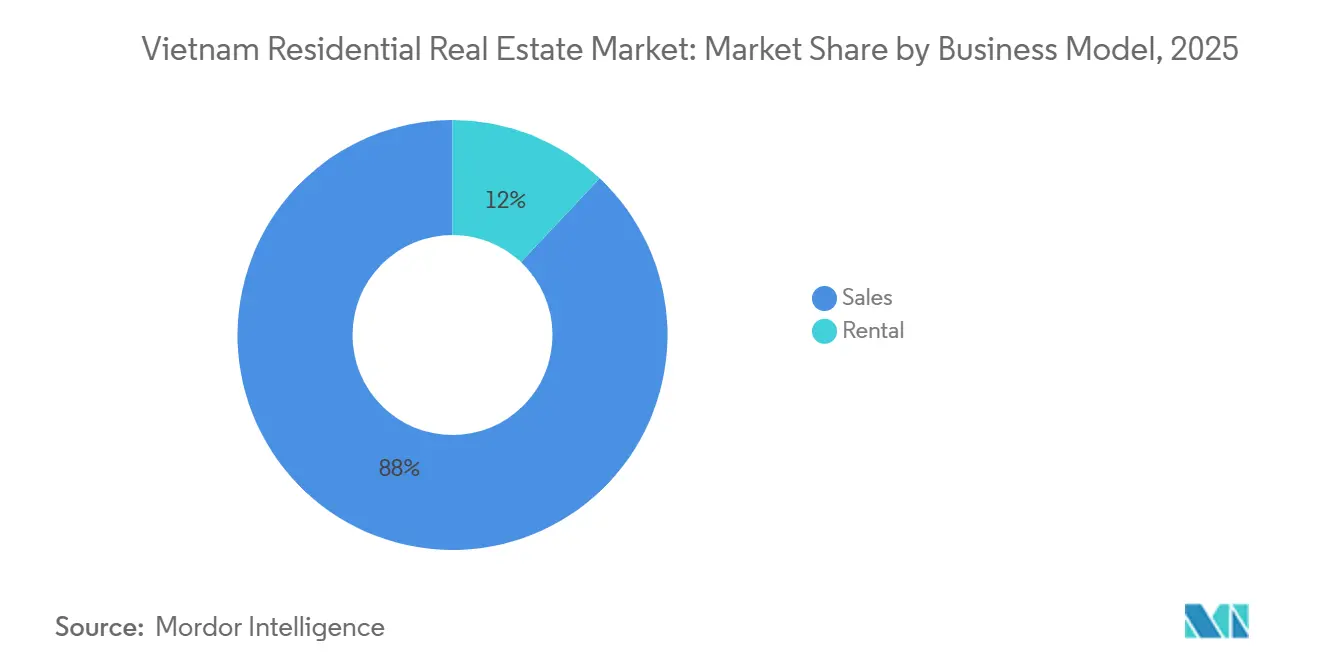
- By business model, sales accounted for 88% of transactions in 2025, whereas rentals are projected to rise at a 12.59% CAGR through 2031, supported by expatriate inflows and institutional build-to-rent activity.
- By mode of sale, primary launches represented 57% of turnover in 2025; secondary resales are accelerating at a 13.86% CAGR as digital land-title platforms reduce transfer friction.
- By geography, Ho Chi Minh City retained 48% of Vietnam's residential real estate market share in 2025, while Hai Phong is the fastest-growing city at a 13.86% CAGR on the strength of industrial-zone investment.
Note: Market size and forecast figures in this report are generated using Mordor Intelligence’s proprietary estimation framework, updated with the latest available data and insights as of January 2026.
Vietnam Residential Real Estate Market Trends and Insights
Drivers Impact Analysis*
| Drivers | (~) % Impact on CAGR Forecast | Geographic Relevance | Impact Timeline |
|---|---|---|---|
| Rising Urban Middle Class and Household Formation in Tier-1 and Emerging Tier-2 Cities | +3.2% | National, with concentration in HCMC, Hanoi, Hai Phong, Danang | Long term (≥ 4 years) |
| Surging FDI-led Industrial Corridors Creating Housing Demand Near IZs | +2.8% | Northern provinces (Hai Phong, Bac Ninh, Quang Ninh), Southern industrial belt (Binh Duong, Dong Nai, Long An) | Medium term (2-4 years) |
| Rapid Expansion of MRT and Ring-Road Projects Unlocking Peripheral Land Banks | +2.4% | HCMC (Metro Lines 1-6), Hanoi (Lines 2-8), Danang coastal corridor | Medium term (2-4 years) |
| Relaxed Foreign Ownership Caps in 2023 Amendments to Housing Law | +1.9% | HCMC, Hanoi, Danang coastal districts | Short term (≤ 2 years) |
| Growing Remittances (USD 14 Bn+) Channelled into Residential Assets | +1.6% | HCMC (USD 9.6B), Hanoi, Mekong Delta provinces, Central Coast | Long term (≥ 4 years) |
| Digital Mortgage Platforms Reducing Time-to-Loan below 5 Days | +1.3% | National, with early adoption in HCMC, Hanoi, Danang | Short term (≤ 2 years) |
| Source: Mordor Intelligence | |||
Rising Urban Middle Class and Household Formation in Tier-1 and Emerging Tier-2 Cities
Vietnam's demographic dividend is translating into sustained residential absorption as the urban middle class expands and household sizes contract. The 2024 census confirmed an urbanization rate of 38.2% with annual urban population growth of 3.06%, while McKinsey forecasts 36 million middle-class consumers by 2030, up from approximately 13 million in 2020. This cohort is increasingly able to afford mid-market apartments priced between USD 1,300 and USD 3,000 per square meter, a segment that captured 57% of Hanoi's new supply in 2024. Tier-2 cities such as Hai Phong, Can Tho, and Bien Hoa are experiencing spillover demand as tier-1 price appreciation pushes first-time buyers toward more affordable markets; Hai Phong's apartment prices averaged VND 45 million per square meter in Q4 2023, 23.5% lower than Hanoi, yet the city is attracting major developers like Vinhomes and Masterise Homes with projects exceeding USD 2 billion in aggregate investment. The shift from multi-generational households to nuclear families is accelerating unit demand even as per-capita income rises, creating a structural tailwind that is less sensitive to cyclical interest-rate fluctuations than in mature markets.
Surging FDI-led Industrial Corridors Creating Housing Demand Near IZs
Foreign direct investment into Vietnam's industrial zones reached USD 5.63 billion in the first 11 months of 2024, an 89.1% year-on-year increase, with a significant share flowing into northern provinces and the southern industrial belt. This capital influx is generating derived demand for worker housing, mid-level manager apartments, and expatriate villas within commuting distance of manufacturing clusters. Hai Phong's industrial zones alone attracted USD 3.5 billion in 2023, a 140% year-on-year surge, prompting developers to launch social-housing projects such as Vinhomes Happy Home Trang Cat, a 4,300-unit development with a total investment of VND 5.8 trillion (approximately USD 238 million) that began handovers in January 2024. Binh Duong and Dong Nai provinces are similarly experiencing residential construction booms adjacent to electronics, textile, and automotive plants; CapitaLand's Sycamore master development in Binh Duong, a joint venture with UOA spanning 18.9 hectares and targeting over 3,500 units with a gross development value exceeding SGD 1 billion, exemplifies how foreign developers are co-locating residential, retail, and recreational amenities near industrial employment centers. The industrial-residential nexus is creating a distinct sub-market characterized by shorter sales cycles, higher rental yields, and lower vacancy rates than traditional urban cores.
Rapid Expansion of MRT and Ring-Road Projects Unlocking Peripheral Land Banks
Infrastructure investment is redrawing Vietnam's residential geography, with metro and expressway projects transforming previously inaccessible suburban land into developable parcels. Ho Chi Minh City Metro Line 1, which opened in December 2024, connects Ben Thanh in District 1 to Suoi Tien in District 9 over 19.7 kilometers, with 14 stations enabling transit-oriented development along its corridor. Land values within 500 meters of Metro Line 1 stations appreciated by an estimated 20-30% between project announcement and opening, according to local valuation surveys, and developers are clustering mixed-use projects around Thu Duc, Binh Thanh, and District 2 stations. Hanoi is advancing 8 metro lines, with Line 2 (Nam Thang Long–Tran Hung Dao) and Line 3 (Nhon–Hanoi Station) under construction, while the North-South Expressway, a USD 15 billion national project, is unlocking land banks in provinces such as Ninh Binh, Thanh Hoa, and Nghe An for residential and industrial development. Danang's coastal ring road and the planned International Financial Center on 6.17 hectares are positioning the city as a secondary residential hub for both domestic buyers and foreign retirees. The infrastructure-led land unlocking is particularly significant for affordable and mid-market segments, where suburban locations offer lower per-unit costs and larger plot sizes, enabling developers to achieve target margins even with constrained selling prices.
Relaxed Foreign Ownership Caps in 2023 Amendments to Housing Law
The 2023 Housing Law and Real Estate Law amendments, effective from August 2023, streamlined foreign ownership procedures and extended ownership tenures, catalyzing a wave of cross-border investment into Vietnam's condominium market. Foreign individuals may now own apartments for up to 50 years, with the 30% foreign-ownership cap per condominium project remaining in place, but administrative barriers are reduced through digitized registration and acceptance of overseas identity documents. The Land Law 2024, effective January 1, 2025, further expanded rights for overseas Vietnamese, granting them land-use rights equivalent to domestic citizens and enabling them to obtain red books for undocumented land held before specified historical cutoff dates. Remittances into Vietnam totaled USD 16 billion in 2024, with Ho Chi Minh City alone receiving USD 9.6 billion, and an estimated 22% of these inflows are channeled into residential real estate purchases. Danang has become a focal point for foreign buyers, with 17 commercial housing projects permitting foreign ownership, including 8 on the Son Tra peninsula and 6 in Hai Chau district, where coastal views and resort-style amenities command premium pricing. The regulatory easing is particularly impactful in the luxury segment, where foreign buyers accounted for an estimated 15-20% of transactions in HCMC's high-end projects during 2024, according to local brokerage reports[1]https://moc.gov.vn/vn/Pages/Trangchu.aspx.
Restraints Impact Analysis*
| Restraints | (~) % Impact on CAGR Forecast | Geographic Relevance | Impact Timeline |
|---|---|---|---|
| Periodic Credit Caps on Real-Estate Lending by SBV | -2.1% | National, with disproportionate impact on HCMC and Hanoi where credit-dependent buyers dominate | Short term (≤ 2 years) |
| Fragmented Land-Title System and Prolonged Red-Tape for Land-Use-Right Certificates | -1.8% | National, with acute bottlenecks in rural-urban transition zones and provinces with incomplete cadastral digitization | Medium term (2-4 years) |
| High Construction-Input Inflation (Steel, Cement) vs. Flat Selling Prices | -1.5% | National, with acute pressure in mid-market and affordable segments where price elasticity is high | Short term (≤ 2 years) |
| Vulnerability to Overseas Interest-Rate Cycles Impacting USD-Denominated Debt | -1.2% | National, with concentration in projects financed by foreign capital or USD-denominated bonds | Medium term (2-4 years) |
| Source: Mordor Intelligence | |||
Periodic Credit Caps on Real-Estate Lending by SBV
The State Bank of Vietnam's macroprudential stance on real estate credit introduces cyclical volatility into residential demand, as periodic tightening constrains buyer access to mortgages and developer access to construction finance. The SBV set a real estate credit growth target of 15% for 2024 and 16% for 2025, raising the cap twice during 2024 in August and November to accommodate demand, yet real estate credit as a share of total outstanding credit reached 23% by September 2025, the highest level in recent years, prompting regulatory scrutiny. Circular 14/2025, issued in early 2025, increased capital risk weights for commercial real estate lending while lowering weights for social housing, steering credit toward affordable segments but reducing liquidity for mid-market and luxury projects. Real estate credit outstanding stood at VND 3.15 quadrillion in September 2024, up 9.15% year-on-year, with approximately 60% allocated to consumer mortgages and 40% to developers, yet the growth rate lagged the overall credit expansion of 11.12% year-to-date as of November 2024, indicating selective tightening. The credit caps disproportionately affect HCMC and Hanoi, where buyers rely heavily on mortgage leverage; HCMC's average apartment price of USD 3,672 per square meter in Q4 2024 implies a total unit cost exceeding USD 250,000 for a 70-square-meter apartment, requiring substantial down payments when loan-to-value ratios are capped at 70-80%. The periodic nature of SBV adjustments creates uncertainty for developers planning multi-year project pipelines, as sales absorption rates can swing sharply with credit availability, complicating revenue forecasting and land-acquisition decisions.
Fragmented Land-Title System and Prolonged Red-Tape for Land-Use-Right Certificates
Vietnam's land administration remains a structural constraint on transaction velocity and developer confidence, despite recent digitization efforts. The issuance of Certificates of Land Use Rights (commonly known as red books) has historically involved multi-agency coordination, incomplete synchronization between national and provincial databases, and manual verification of land-use history, resulting in processing times that can extend months for complex parcels. Decree 101/2024/ND-CP, effective August 1, 2024, introduced statutory time limits of 20 working days for initial registration and 3 working days for certificate issuance, and decentralized authority to commune-level People's Committees for first-time issuances. However, implementation remains uneven; Dong Nai province's Land Registration Office processed 112,000 new records and 116,000 transition records between July 1 and September 20, 2025, achieving a 99.6% correct and early resolution rate, yet identified bottlenecks including incomplete synchronization among the National Public Service Portal, provincial land management software, and slow taxpayer payments. Phu Xuyen commune in Hanoi piloted mobile red-book issuance teams in August 2025, supporting over 440 households across multiple sub-areas, but many applicants lacked legal documents proving land-use origin, requiring additional research and higher-authority approvals. The fragmentation is particularly acute for secondary-market transactions and land consolidation for large-scale projects, where multiple parcels with differing historical documentation must be aggregated, delaying project timelines and increasing carrying costs for developers[2]https://www.vietnam.vn/.
*Our forecasts treat driver/restraint impacts as directional, not additive. The impact forecasts reflect baseline growth, mix effects, and variable interactions.
Segment Analysis
By Property Type: Villas Gain Share as Affluence Rises
Apartments and condominiums commanded 70% Vietnam residential real estate market share in 2025, cementing their dominance in dense urban cores. Yet villas and landed houses are on track to grow at a 12.17% CAGR through 2031, outperforming the broader market as household incomes climb and suburban transport links improve. Hanoi added 3,900 landed units in 2024, with average prices hitting USD 11,934 per square meter in Q4 2024, more than doubling year-on-year. Suburban districts such as Long Bien and Hoang Mai, where land costs are lower, accounted for 98% of that volume. HCMC remains undersupplied, trading only 61 landed units in Q2 2025 at USD 12,277 per square meter, but pipeline releases in District 7 and Binh Chanh hint at a rebound.
The apartment segment still anchors new supply because vertical projects optimize expensive downtown parcels and appeal to mid-income buyers. HCMC launched 2,800 high-end units in Q2 2025, and strong absorption of 2,642 units underscores resilient demand once regulatory bottlenecks ease. Foreign capital is scaling these vertical plays; CapitaLand’s Lumi Hanoi will deliver 4,000 apartments across nine towers, signaling confidence in mass-market liquidity. Even with villa momentum, dense formats retain pricing power close to metro corridors, keeping the Vietnam residential real estate market balanced between high-rise efficiency and low-rise exclusivity[3]https://www.cbre.com.vn/en/research-reports/Hanoi-Residential-Market-Q4-2024.


By Price Band: Affordable Momentum on Policy Support
Mid-market homes held a 48% share of the Vietnam residential real estate market size in 2025, but the affordable tier priced below USD 1,300 per square meter is forecast to expand at a 13.28% CAGR to 2031. June 2025 mortgage programs offering 6.1% rates spurred bookings among first-time buyers, quickly absorbing inventory in Vinhomes’ Happy Home Trang Cat. Capital-risk weighting tweaks under Circular 14/2025 encourage banks to channel funds into social housing, improving liquidity for developers and buyers alike.
Luxury remains niche, concentrated in prime HCMC and Hanoi precincts where some towers exceed USD 10,000 per square meter and attract foreign buyers taking advantage of the 2023 Housing Law. Yet the Vietnam residential real estate market relies on affordable and mid-market volumes for stability. Suburban Hanoi supplied 75% of new apartments in 2024, a sign that developers are aligning ticket prices with local salary bands while future metro extensions promise commute convenience.
By Business Model: Rentals Draw Institutional Capital
Sales transactions represented 88% of overall activity in 2025, reflecting Vietnam’s ingrained ownership culture. Digital mortgage portals like NCB’s RLOS now provide five-minute approvals, slashing deal cycles and bolstering developer cash flow. Remittances channeled into down payments further buoy primary absorption.
Even so, the rental segment is projected to deliver a 12.59% CAGR through 2031, luring institutional investors. CapitaLand is embedding rental blocks within its industrial-adjacent projects, offering shuttle buses and co-working lounges to expatriate managers. Yields in prime HCMC average 5%, comparable with regional peers and attractive amid volatile equities. The emergence of professional landlords diversifies exit options, enhancing overall liquidity in the Vietnam residential real estate market.
By Mode of Sale: Secondary Liquidity Improves
Primary launches accounted for 57% of turnover in 2025, thanks to a steady pipeline of master-planned communities. Regulatory approvals for 34 formerly stalled HCMC projects in 2024-2025 unlocked more than 10,000 units for delivery, restoring buyer confidence. Deferred payment plans and zero-interest installments sweeten the proposition for budget-constrained households.
Secondary transactions are gathering pace, expected to grow at a 13.86% CAGR through 2031. Electronic land-title certificates mandated under Decree 101/2024 give digital proof equivalent to the traditional red book, cutting verification times. PropTech firms such as Meey Group integrate price histories, virtual tours, and CRM tools, standardizing the resale process and attracting millennials keen on established neighborhoods. This shift deepens the Vietnam residential real estate market's depth and resilience.
Geography Analysis
Ho Chi Minh City dominated with 48% market share in 2025 and continues to set benchmarks for pricing and supply velocity. High-end apartment launches reached 2,800 units in Q2 2025, and sales rocketed 124% quarter-on-quarter as Metro Line 1 enhanced connectivity and 34 legacy projects re-entered the pipeline. Average apartment prices advanced 34% year-on-year to USD 3,672 per square meter, and a future inventory of 36,427 units is skewed toward Thu Duc, where larger parcels allow township-scale amenities that appeal to young families. The landed segment remains chronically tight, nudging affluent households toward villas in District 7 and beyond, even at USD 12,277 per square meter.
Hai Phong is the Vietnam residential real estate market’s fastest grower, set to compound at 13.86% between 2026 and 2031. Industrial-zone inflows of USD 3.5 billion in 2023 triggered robust residential demand, and the USD 2.4 billion Vu Yen Island scheme alone will add more than 7,000 villas. Average apartment prices hover at USD 1,840 per square meter, undercutting Hanoi by 23.5% and luring first-time buyers as well as expatriate managers who value proximity to port logistics and Cat Bi airport. Municipal projections indicate 25,000 new units by 2026, 56% centered in Thuy Nguyen district, where a new bridge links growth corridors to downtown.
Hanoi, Danang, and second-tier provinces fill the rest of the landscape. Hanoi’s 28,700 apartments launched in 2024 tripled the prior year’s volume, pushing primary prices to USD 2,917 per square meter. Suburban districts now supply three-quarters of new stock, leveraging forthcoming metro lines and ring roads. Danang is carving out a niche for mixed-use coastal living, with the USD 460 million Thuan Phuoc New Urban Area slated to add 5,000 homes by 2028. Elsewhere, Binh Duong, Dong Nai, and Long An ride on industrial spillovers, illustrated by CapitaLand’s 3,500-unit Sycamore township framed around factory corridors. These diverse geographies collectively broaden the Vietnam residential real estate market’s opportunity map while mitigating concentration risk.
Regulatory Landscape
Vietnam's residential real estate market operates under a fast-evolving housing and land framework anchored by the Law on Housing 2023, the Law on Real Estate Business 2023, and the Land Law 2024 (effective January 1, 2025). The Ministry of Construction (MoC) has continued to consolidate implementing guidance, including consolidated documents issued in March 2026 that unify prior circulars and decrees detailing the Law on Housing, aimed at reducing procedural fragmentation across provinces.
In 2026, several decrees further shaped market compliance and data transparency. Decree 357/2025/ND-CP became effective on January 3, 2026, requiring each residential property to have a unique electronic identification code, reinforcing the shift toward centralized housing and real estate databases. Decree 54/2026/ND-CP (February 2026) and Decree 136/2026/ND-CP (effective April 7, 2026) amended multiple housing and real estate business regulations, with a notable focus on social housing development and management rules linked to Decree 100/2024/ND-CP.
Value Chain Analysis
Vietnam's residential real estate value chain typically starts with land access and planning (land-use rights, site clearance, zoning, and construction permits) and moves into development and financing (developer equity, bank credit, and joint ventures). It then covers construction delivery (main contractors and specialized subcontractors), go-to-market (primary sales via developer channels and broker networks, alongside PropTech-enabled lead generation), and post-completion services (property management, facility maintenance, and secondary-market resale support). Policy-driven digitization is increasingly integrated across transaction and registration steps; Decree 357/2025/ND-CP (effective January 2026) mandates a centralized information system and database for the housing and real estate market, which supports more standardized listing, verification, and transfer processes.
Construction inputs remain an operational dependency, particularly for sand, gravel, and backfilling materials, where licensing complexity and concurrent infrastructure demand have periodically pushed procurement costs above official price announcements. The Prime Minister's Official Dispatch 85/CĐ-TTg (June 2025) called for stabilization of construction material prices and mining reform. This upstream volatility increases the value of procurement partnerships and execution capability, and it encourages developers to manage delivery risk through international and domestic contracting alliances, while sequencing launches around material availability and working-capital constraints among smaller contractors.
Competitive Landscape
The top five developers—Vinhomes, Novaland, Dat Xanh, Sun Group, and Hung Thinh—command roughly 30–35% of national deliveries, giving the Vietnam residential real estate market a moderate concentration profile. Limited dominance leaves headroom for regional specialists and foreign entrants. Domestic players are pivoting from land banking to execution excellence as buyers demonstrate a clear preference for near-completion assets. Tighter lending caps underscore this shift, incentivizing efficient capital recycling rather than speculative hoarding.
Strategic alliances have become a dominant theme. CapitaLand’s May 2025 memorandum with Vinhomes replaces adversarial land auctions with cooperative ventures that blend international funding with local land banks, accelerating project timelines. Keppel Land is pruning non-core assets such as Saigon Sport City to redeploy funds into higher-margin schemes with Khang Dien, while Novaland’s Aqua City restart highlights how restructuring can revitalize pipeline credibility. Joint ventures mitigate regulatory risk and pool brands to win customer trust.
Technology now separates leaders from laggards. Meey Group’s ISO-certified PropTech stack brings mapping, CRM, and 3D visualization into one ecosystem, reducing customer-acquisition cost. NCB’s five-minute mortgage approvals cut weeks out of sale cycles and shrink developer carrying costs. Mid-tier firms without digital capability or foreign partners face liquidity stress; 39% have delayed investments, and 21% froze disbursements in 2025, paving the way for consolidation. Overall, competitive dynamics are tilting toward well-capitalized, tech-enabled companies that can navigate policy shifts and deliver differentiated products, reinforcing the Vietnam residential real estate market’s maturation trajectory.
Vietnam Residential Real Estate Industry Leaders
Vinhomes
Novaland Group
Dat Xanh Group
Sun Group
Phat Dat Corporation
- *Disclaimer: Major Players sorted in no particular order

Market Opportunities and Future Outlook
Policy-backed affordable housing and social housing provide the clearest structured opportunity set, supported by quantified provincial targets under Resolution 07/NQ-CP (January 12, 2026) and follow-through actions from the Ministry of Construction, including Official Telegram 08/CD-BXD (April 28, 2026) urging acceleration of 2026 social housing delivery. With 220 projects (about 215,000 units) reported under construction as of early 2026, developers and capital providers have an active pipeline to participate in across compliant project selection, land preparation, construction delivery, and end-user financing. This is particularly relevant where lending incentives favor social housing relative to commercial real estate exposures.
A second opportunity area is transparency and transaction infrastructure. The government's direction in early 2026 to prepare a state-run real estate and land-use-rights trading center, alongside mandatory property-level electronic identification under Decree 357/2025/ND-CP, creates a practical whitespace for platforms and service providers that digitize listing integrity, title verification, valuation, and standardized secondary transfers. At the same time, anti-speculation tax policy discussions reported in January 2026 point to a shift toward regulated price discovery and compliance, which favors developers with clean legal documentation, clear land-use rights, and standardized buyer disclosure processes.
Recent Industry Developments
- July 2026: SkyWorld Development Bhd broke ground on SkySOLIS in Lai Thieu Ward, Ho Chi Minh City, marking its first residential project in Vietnam. The move adds a new foreign entrant to the competitive set in a prime demand center and signals expanding cross-border developer participation in Vietnam's urban housing pipeline.
- October 2025: Meey Group conducted investor roadshows at NASDAQ and in Singapore as part of its capital market engagement. The activity reinforced the role of PropTech platforms in standardizing sales, resale, and customer management workflows across primary and secondary transactions.
- December 2024: Ho Chi Minh City Metro Line 1 opened, connecting Ben Thanh (District 1) to Suoi Tien (District 9) across 14 stations. The operational milestone strengthened the transit-oriented development model and increased developer focus on corridor-led residential launches in areas such as Thu Duc and surrounding station catchments.


Research Methodology Framework and Report Scope
Market Definition and Coverage
For this report, the market is defined as the annual value generated from residential homes used for living in Vietnam, covering sales and leasing activity across the country, then converting it into a single USD value for each year.
Scope exclusions: We exclude timeshare units, purpose-built student dormitories, and corporate staff quarters, so the sizing stays tied to mainstream housing demand rather than specialized accommodation categories.
Segmentation Overview
- Sales
- Rental
Data Sources, Market Sizing, and Validation
Desk Research
Desk research was used to set the macro guardrails and keep assumptions realistic before we spoke to industry participants. We referred to public, non-paywalled sources such as General Statistics Office releases, Ministry of Construction updates on housing supply and legal changes, State Bank of Vietnam rate and credit series, Vietnam Customs trade statistics for building-material proxy checks, and official land and planning notices published by provincial and city authorities.
We also reviewed listed-company filings and investor presentations to understand project pipelines, handover timing, and reported presales, which then helped us test the direction of volumes and pricing. Reputed press and association websites were used to track policy changes, developer launches, and buyer sentiment, and a paid subscription covering company financials plus a paid news and financials service helped us verify timelines and cross-check notable transactions. This list is illustrative only, and additional sources were also used for data collection, validation, and clarification.
Primary Interviews and Surveys
Primary work focused on interviews and structured questionnaires with developers, brokers, property managers, lenders, and supporting service firms, so we could validate how deals were priced, how quickly inventory moved, and which buyer cohorts were active. For Vietnam, we ensured the conversations covered the main demand centers and the long tail of provinces, because absorption, ticket sizes, and financing terms can vary widely even within the same year.
Distribution of primary research fieldwork respondents
| Company type | Respondent position | Region |
|---|---|---|
| Top tier: 29% | CXOs: 14% | |
| Mid tier: 51% | Functional/Unit leaders: 27% | |
| Smaller Players: 20% | Managers: 59% |
Market-Sizing & Forecasting
Sizing starts with a top-down build that reconstructs the addressable housing value pool from housing activity and demand signals in Vietnam, then converts that pool into annual USD market values. To keep the totals grounded, we corroborate the result with selective bottom-up checks such as sampled project price sheets multiplied by observed sellable area, channel checks on resale ticket sizes, and rent-per-month runs across typical unit types, where data gaps are filled using conservative ranges.
The model is driven by a short set of inputs that can be tracked year by year, including new launch and completion cadence, absorption and inventory overhang, mortgage availability and average lending rates, primary-versus-secondary mix, and rental yield direction in major cities. For forecasting, we use scenario analysis so interest-rate paths, policy easing or tightening, and supply release timing can be tested side by side, then we rely on expert confirmation of which scenario best matches current market behavior. When inputs disagree across sources, we prioritize the series that is most consistent over time and can be explained through clear drivers.
Data Validation & Update Cycle
Outputs are checked through multiple passes, where we compare the final values against independent signals such as credit growth to households, observed pricing movement in active micro-markets, and the pace of new supply entering the market. If a year shows an unusual jump, the assumptions are reopened, and respondents are re-contacted to confirm whether it was driven by mix shift, one-off projects, or a true marketwide pricing change.
Before sign-off, another analyst reviews the model logic, unit conversions, and currency handling to remove avoidable variance. Reports are refreshed annually, and interim updates are triggered when a material event occurs, such as a major policy change affecting buyer eligibility or financing. Right before delivery, we do a final pass so clients receive the latest updated view rather than an older snapshot.
Mordor Intelligence's Vietnam Residential Real Estate Market Size Versus Other Published Estimates
Published market sizes for Vietnam housing can look far apart because the timing of currency conversion, the treatment of pricing (ASP) changes, and the exact definition of what counts as a market transaction are not always handled the same way. The chosen base year also matters, particularly when policy shifts affect absorption and price momentum within a short period.
When USD values are refreshed on a consistent cadence and the ASP path is re-checked against current launch pricing, resale ticket sizes, and achievable rents, the market total tends to move toward the latest on-ground reality. This is the validation step applied by Mordor Intelligence.
Benchmark comparison
| Source | Market Size | Gaps in Research Methodology |
|---|---|---|
| Mordor Intelligence | USD 34.12 B (2026) | |
| Global Consultancy A | USD 26.32 B (2024) | Uses an earlier base year and a different forecast window, and the public summary does not clarify whether secondary resales and rental receipts are counted, which can compress the addressed value pool. |
| Industry Publisher B | USD 25.26 B (2024) | Reports a 2024 value without clear detail on transaction boundaries and price update rules, and it is less transparent on how primary and secondary market activity are consolidated into one USD figure. |
The spread in the table is mainly explained by base-year choice, what is included as a transaction, and how pricing and currency timing are handled through the period. By tying the model to observable activity signals and keeping the conversion and pricing steps repeatable, we end up with a practical number that can be traced back to clear drivers and checked again when new data arrives.


Key Questions Answered in the Report
What is the current value of the Vietnam residential real estate market?
It reached USD 34.12 billion in 2026 and is projected to climb to USD 58.93 billion by 2031.
How fast is the Ho Chi Minh City segment expanding?
The city’s apartment prices rose 34% year-on-year in Q2 2025, and its future pipeline holds 36,427 units concentrated in Thu Duc.
Which city is forecast to grow the quickest?
Hai Phong is projected to post a 13.86% CAGR from 2026 to 2031, underpinned by heavy industrial investment and large township projects.
Why is affordable housing gaining momentum?
Government mortgage rates as low as 6.1% and lower capital risk weights for banks are steering credit toward social-housing projects.
How are foreign ownership rules changing?
Amendments effective August 2023 grant foreign buyers 50-year titles and streamline registration, boosting luxury-segment transactions.
What role do PropTech platforms play?
Solutions like Meey Group integrate mapping, CRM, and virtual tours, shortening resale cycles and adding transparency across the value chain.
Page last updated on:




