Middle East Lubricants Market Size

| Icons | Lable | Value |
|---|---|---|
|
|
Study Period | 2015 - 2026 |
|
|
Market Volume (2024) | 2.60 Billion Liters |
|
|
Market Volume (2026) | 2.77 Billion Liters |
|
|
Largest Share by End User | Automotive |
|
|
CAGR (2024 - 2026) | 3.22 % |
|
|
Largest Share by Country | Iran |
Major Players |
||
|
|
||
|
*Disclaimer: Major Players sorted in no particular order |
Middle East Lubricants Market Analysis
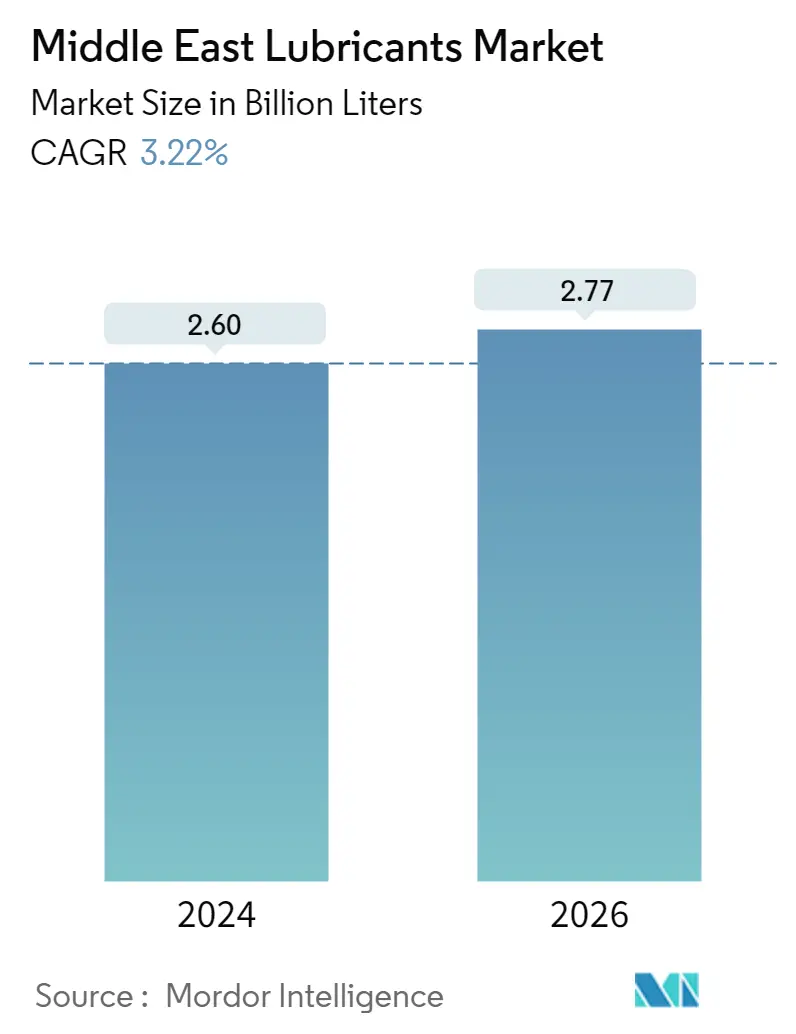
The Middle East Lubricants Market size is estimated at 2.60 Billion Liters in 2024, and is expected to reach 2.77 Billion Liters by 2026, growing at a CAGR of 3.22% during the forecast period (2024-2026).
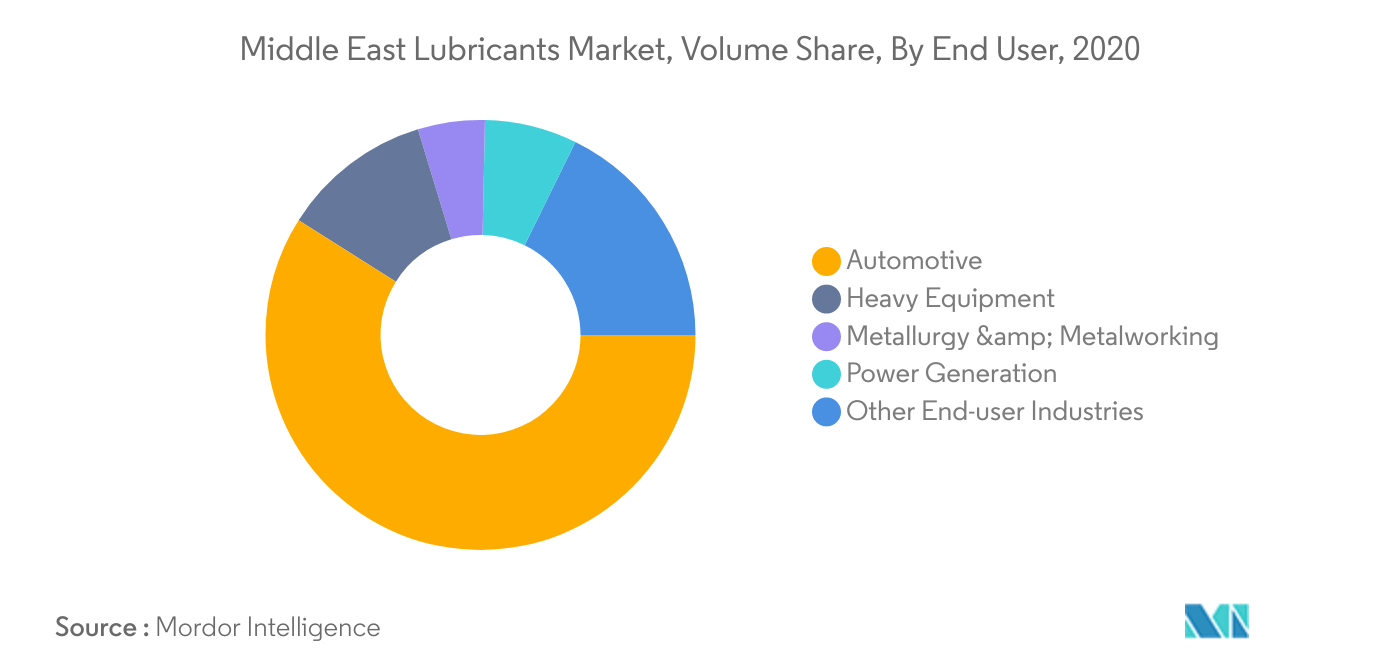
- Largest Segment by End-user Industry - Automotive : Among all end-user segments, automotive is the largest end user due to the high proportion of engine and gear oil usage in motor vehicles than other industrial applications.
- Fastest Segment by End-user Industry - Power Generation : Due to rising demand for low-cost energy from natural-gas-fueled power plants, power generation is likely to be the fastest-growing lubricant end user in the Middle East.
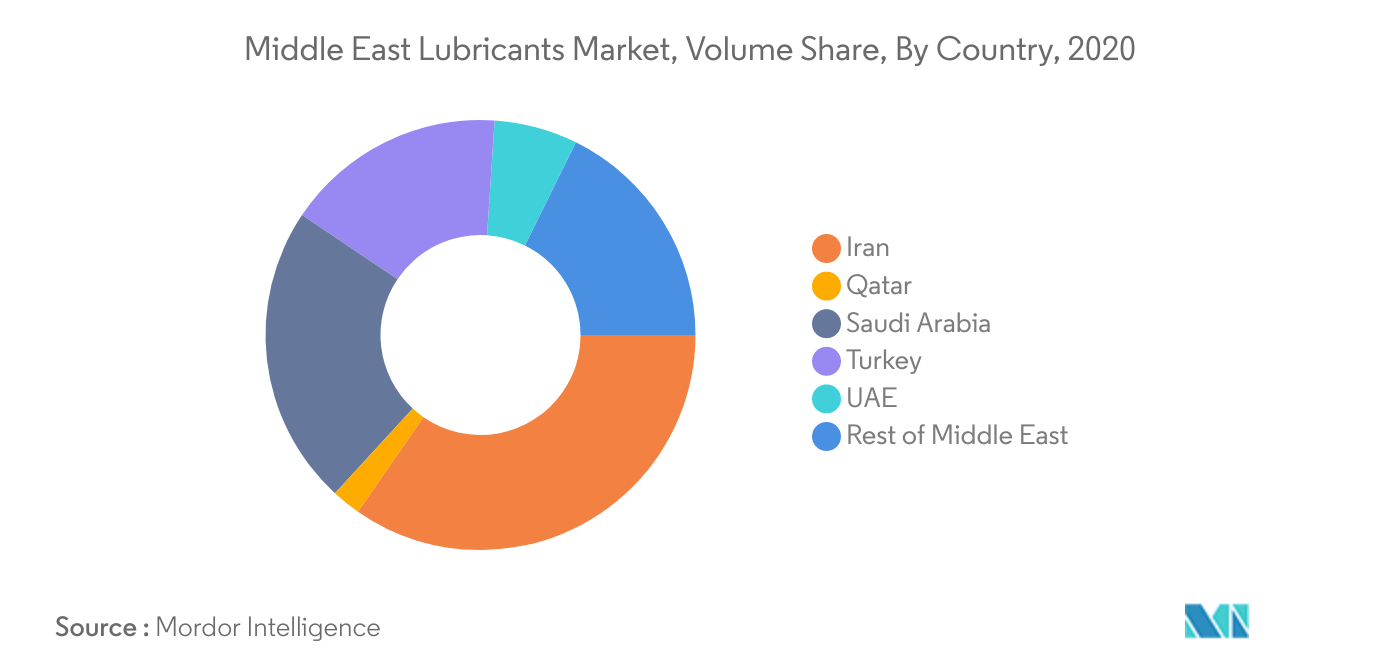
- Largest Country Market - Iran : Iran is the largest lubricant market in the Middle East, as the country possesses a higher number of motor vehicles and active industrial machinery than any other country.
- Fastest Growing Country Market - Turkey : Turkey is expected to be the fastest-growing lubricant-consuming country in the Middle East due to increased ownership of used vehicles and a growing heavy-equipment sector.
Middle East Lubricants Market Trends
This section covers the major market trends shaping the Middle-East Lubricants Market according to our research experts:
Largest Segment By End User : Automotive
- In 2020, the Middle Eastern lubricant market was dominated by the automotive industry, which accounted for around 58.9% of the total lubricant consumption in the country. During 2015-2019, lubricant consumption in the automotive industry increased by around 8.69%.
- In 2020, COVID-19-related restrictions led to decreased maintenance requirements from several industries. The major impact was observed in the automotive industry, which recorded a dip of 6.86% during 2019-2020, followed by heavy equipment (6.1%) during the year.
- Power generation is expected to be the fastest-growing end-user industry of the market studied, recording a CAGR of 5.33% during 2021-2026, followed by automotive (3.22%). The growing capacity addition of power generation in the country is anticipated to drive lubricant consumption in the power generation industry.
Largest Country : Iran
- In 2020, Iran was the leading consumer of lubricants in the Middle Eastern region, accounting for around 34.6% of the region's total lubricant consumption. During 2015-2019, lubricant consumption in Iran increased by 4.36%.
- In 2020, the COVID-19 outbreak restrained the operations of several industries, including lubricant consumption, across the Middle Eastern region. The United Arab Emirates was the most affected, with a 9.1% drop in its lubricant consumption during 2019-2020, followed by Qatar (8.3% drop).
- Turkey is likely to be the fastest-growing lubricants market in the Middle East during the forecast period, with a CAGR of around 4.94%. The recovering automotive sales and usage and the growing industrial activities are likely to drive lubricant growth in countries like Qatar, Saudi Arabia, and the United Arab Emirates.
Middle East Lubricants Industry Overview
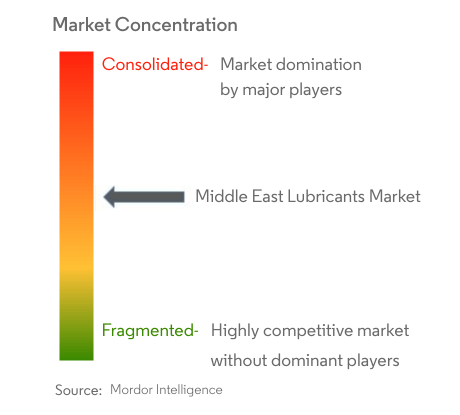
The Middle East Lubricants Market is moderately consolidated, with the top five companies occupying 44.32%. The major players in this market are Behran Oil Company, BP Plc (Castrol), Petromin Corporation, Royal Dutch Shell Plc and TotalEnergies (sorted alphabetically).
Middle East Lubricants Market Leaders
Behran Oil Company
BP Plc (Castrol)
Petromin Corporation
Royal Dutch Shell Plc
TotalEnergies
*Disclaimer: Major Players sorted in no particular order
Middle East Lubricants Market News
- May 2022: TotalEnergies, NEXUS Automotive Extend Strategic Partnership for a period of five years. As part of this partnership, TotalEnergies Lubricants will be expanding its presence in the burgeoning N! community, which has seen rapid growth in sales from EUR 7.2 billion in 2015 to nearly EUR 35 billion by the end of 2021.
- March 2022: ExxonMobil Corporation company has appointed Jay Hooley as lead managing director of the company.
- January 2022: Effective April 1, ExxonMobil Corporation was organized along three business lines - ExxonMobil Upstream Company, ExxonMobil Product Solutions and ExxonMobil Low Carbon Solutions.
Middle East Lubricants Market Report - Table of Contents
1. Executive Summary & Key Findings
2. Introduction
2.1. Study Assumptions & Market Definition
2.2. Scope of the Study
2.3. Research Methodology
3. Key Industry Trends
3.1. Automotive Industry Trends
3.2. Manufacturing Industry Trends
3.3. Power Generation Industry Trends
3.4. Regulatory Framework
3.5. Value Chain & Distribution Channel Analysis
4. Market Segmentation
4.1. By End User
4.1.1. Automotive
4.1.2. Heavy Equipment
4.1.3. Metallurgy & Metalworking
4.1.4. Power Generation
4.1.5. Other End-user Industries
4.2. By Product Type
4.2.1. Engine Oils
4.2.2. Greases
4.2.3. Hydraulic Fluids
4.2.4. Metalworking Fluids
4.2.5. Transmission & Gear Oils
4.2.6. Other Product Types
4.3. By Country
4.3.1. Iran
4.3.2. Qatar
4.3.3. Saudi Arabia
4.3.4. Turkey
4.3.5. UAE
4.3.6. Rest of Middle East
5. Competitive Landscape
5.1. Key Strategic Moves
5.2. Market Share Analysis
5.3. Company Profiles
5.3.1. ADNOC
5.3.2. Behran Oil Company
5.3.3. BP Plc (Castrol)
5.3.4. ExxonMobil Corporation
5.3.5. Iranol Oil Company
5.3.6. Petrol ofisi
5.3.7. Petromin Corporation
5.3.8. Qatar Lubricants Company (QALCO)
5.3.9. Royal Dutch Shell Plc
5.3.10. TotalEnergies
6. Appendix
6.1. Appendix-1 References
6.2. Appendix-2 List of Tables & Figures
7. Key Strategic Questions for Lubricants CEOs
List of Tables & Figures
- Figure 1:
- VEHICLE POPULATION, NUMBER OF UNITS, MIDDLE EAST, 2015 - 2026
- Figure 2:
- COMMERCIAL VEHICLES POPULATION, NUMBER OF UNITS, MIDDLE EAST, 2015 - 2026
- Figure 3:
- MOTORCYCLES POPULATION, NUMBER OF UNITS, MIDDLE EAST, 2015 - 2026
- Figure 4:
- PASSENGER VEHICLES POPULATION, NUMBER OF UNITS, MIDDLE EAST, 2015 - 2026
- Figure 5:
- MANUFACTURING VALUE ADDED, USD BILLION (CURRENT VALUE), MIDDLE EAST, 2015 - 2020
- Figure 6:
- POWER GENERATION CAPACITY, GIGAWATT (GW), MIDDLE EAST, 2015 - 2020
- Figure 7:
- MIDDLE EAST LUBRICANTS MARKET, VOLUME IN LITERS, BY END USER, 2015-2026
- Figure 8:
- MIDDLE EAST LUBRICANTS MARKET, VOLUME SHARE (%), BY END USER, 2020
- Figure 9:
- MIDDLE EAST LUBRICANTS MARKET, VOLUME IN LITERS, AUTOMOTIVE, 2015-2026
- Figure 10:
- MIDDLE EAST LUBRICANTS MARKET, AUTOMOTIVE, VOLUME SHARE (%), BY PRODUCT TYPE, 2020
- Figure 11:
- MIDDLE EAST LUBRICANTS MARKET, VOLUME IN LITERS, HEAVY EQUIPMENT, 2015-2026
- Figure 12:
- MIDDLE EAST LUBRICANTS MARKET, HEAVY EQUIPMENT, VOLUME SHARE (%), BY PRODUCT TYPE, 2020
- Figure 13:
- MIDDLE EAST LUBRICANTS MARKET, VOLUME IN LITERS, METALLURGY & METALWORKING, 2015-2026
- Figure 14:
- MIDDLE EAST LUBRICANTS MARKET, METALLURGY & METALWORKING, VOLUME SHARE (%), BY PRODUCT TYPE, 2020
- Figure 15:
- MIDDLE EAST LUBRICANTS MARKET, VOLUME IN LITERS, POWER GENERATION, 2015-2026
- Figure 16:
- MIDDLE EAST LUBRICANTS MARKET, POWER GENERATION, VOLUME SHARE (%), BY PRODUCT TYPE, 2020
- Figure 17:
- MIDDLE EAST LUBRICANTS MARKET, VOLUME IN LITERS, OTHER END-USER INDUSTRIES, 2015-2026
- Figure 18:
- MIDDLE EAST LUBRICANTS MARKET, OTHER END-USER INDUSTRIES, VOLUME SHARE (%), BY PRODUCT TYPE, 2020
- Figure 19:
- MIDDLE EAST LUBRICANTS MARKET, VOLUME IN LITERS, BY PRODUCT TYPE, 2015-2026
- Figure 20:
- MIDDLE EAST LUBRICANTS MARKET, VOLUME SHARE (%), BY PRODUCT TYPE, 2020
- Figure 21:
- MIDDLE EAST LUBRICANTS MARKET, VOLUME IN LITERS, ENGINE OILS, 2015-2026
- Figure 22:
- MIDDLE EAST LUBRICANTS MARKET, ENGINE OILS, VOLUME SHARE (%), BY END USER, 2020
- Figure 23:
- MIDDLE EAST LUBRICANTS MARKET, VOLUME IN LITERS, GREASES, 2015-2026
- Figure 24:
- MIDDLE EAST LUBRICANTS MARKET, GREASES, VOLUME SHARE (%), BY END USER, 2020
- Figure 25:
- MIDDLE EAST LUBRICANTS MARKET, VOLUME IN LITERS, HYDRAULIC FLUIDS, 2015-2026
- Figure 26:
- MIDDLE EAST LUBRICANTS MARKET, HYDRAULIC FLUIDS, VOLUME SHARE (%), BY END USER, 2020
- Figure 27:
- MIDDLE EAST LUBRICANTS MARKET, VOLUME IN LITERS, METALWORKING FLUIDS, 2015-2026
- Figure 28:
- MIDDLE EAST LUBRICANTS MARKET, METALWORKING FLUIDS, VOLUME SHARE (%), BY END USER, 2020
- Figure 29:
- MIDDLE EAST LUBRICANTS MARKET, VOLUME IN LITERS, TRANSMISSION & GEAR OILS, 2015-2026
- Figure 30:
- MIDDLE EAST LUBRICANTS MARKET, TRANSMISSION & GEAR OILS, VOLUME SHARE (%), BY END USER, 2020
- Figure 31:
- MIDDLE EAST LUBRICANTS MARKET, VOLUME IN LITERS, OTHER PRODUCT TYPES, 2015-2026
- Figure 32:
- MIDDLE EAST LUBRICANTS MARKET, OTHER PRODUCT TYPES, VOLUME SHARE (%), BY END USER, 2020
- Figure 33:
- MIDDLE EAST LUBRICANTS MARKET, VOLUME IN LITERS, BY COUNTRY, 2015-2026
- Figure 34:
- MIDDLE EAST LUBRICANTS MARKET, VOLUME SHARE (%), BY COUNTRY, 2020
- Figure 35:
- MIDDLE EAST LUBRICANTS MARKET, VOLUME IN LITERS, IRAN, 2015-2026
- Figure 36:
- MIDDLE EAST LUBRICANTS MARKET, IRAN, VOLUME SHARE (%), BY PRODUCT TYPE, 2020
- Figure 37:
- MIDDLE EAST LUBRICANTS MARKET, VOLUME IN LITERS, QATAR, 2015-2026
- Figure 38:
- MIDDLE EAST LUBRICANTS MARKET, QATAR, VOLUME SHARE (%), BY PRODUCT TYPE, 2020
- Figure 39:
- MIDDLE EAST LUBRICANTS MARKET, VOLUME IN LITERS, SAUDI ARABIA, 2015-2026
- Figure 40:
- MIDDLE EAST LUBRICANTS MARKET, SAUDI ARABIA, VOLUME SHARE (%), BY PRODUCT TYPE, 2020
- Figure 41:
- MIDDLE EAST LUBRICANTS MARKET, VOLUME IN LITERS, TURKEY, 2015-2026
- Figure 42:
- MIDDLE EAST LUBRICANTS MARKET, TURKEY, VOLUME SHARE (%), BY PRODUCT TYPE, 2020
- Figure 43:
- MIDDLE EAST LUBRICANTS MARKET, VOLUME IN LITERS, UAE, 2015-2026
- Figure 44:
- MIDDLE EAST LUBRICANTS MARKET, UAE, VOLUME SHARE (%), BY PRODUCT TYPE, 2020
- Figure 45:
- MIDDLE EAST LUBRICANTS MARKET, VOLUME IN LITERS, REST OF MIDDLE EAST, 2015-2026
- Figure 46:
- MIDDLE EAST LUBRICANTS MARKET, REST OF MIDDLE EAST, VOLUME SHARE (%), BY PRODUCT TYPE, 2020
- Figure 47:
- MIDDLE EAST LUBRICANTS MARKET, MOST ACTIVE COMPANIES, BY NUMBER OF STRATEGIC MOVES, 2018 - 2021
- Figure 48:
- MIDDLE EAST LUBRICANTS MARKET, MOST ADOPTED STRATEGIES, 2018 - 2021
- Figure 49:
- MIDDLE EAST LUBRICANTS MARKET SHARE(%), BY MAJOR PLAYERS, 2020
Middle East Lubricants Industry Segmentation
| By End User | |
| Automotive | |
| Heavy Equipment | |
| Metallurgy & Metalworking | |
| Power Generation | |
| Other End-user Industries |
| By Product Type | |
| Engine Oils | |
| Greases | |
| Hydraulic Fluids | |
| Metalworking Fluids | |
| Transmission & Gear Oils | |
| Other Product Types |
| By Country | |
| Iran | |
| Qatar | |
| Saudi Arabia | |
| Turkey | |
| UAE | |
| Rest of Middle East |
Market Definition
- Vehicle Types and Industrial Equipment - Automotive (Passenger Vehicles, Commercial Vehicles and Motorcycles), Power Generation, Heavy Equipment, Metallurgy & Metalworking and Other End-user Industries (Marine, Aviation etc.) are considered under the lubricants market.
- Product Types - For the purpose of this study, lubricant products such as engine oils, transmission & gear oils, hydraulic fluids, metalworking fluids, and greases are taken into consideration.
- Service Refill - Service/maintenance refill is considered while accounting the lubricant consumption for each of the vehicle and equipment, under the study.
- Factory Fill - First lubricant fill-ups for newly produced vehicles and industrial equipment are considered under the study.
Research Methodology
Mordor Intelligence follows a four-step methodology in all our reports.
- Step-1: Identify Key Variables: The quantifiable key variables (industry and extraneous) pertaining to the specific product segment and country are selected from a group of relevant variables & factors based on desk research & literature review; along with primary expert inputs. These variables are further confirmed through regression modeling (wherever required).
- Step-2: Build a Market Model: In order to build a robust forecasting methodology, the variables and factors identified in Step-1 are tested against available historical market numbers. Through an iterative process, the variables required for market forecast are set and the model is built on the basis of these variables.
- Step-3: Validate and Finalize: In this important step, all market numbers, variables and analyst calls are validated through an extensive network of primary research experts from the market studied. The respondents are selected across levels and functions to generate a holistic picture of the market studied.
- Step-4: Research Outputs: Syndicated Reports, Custom Consulting Assignments, Databases & Subscription Platforms


