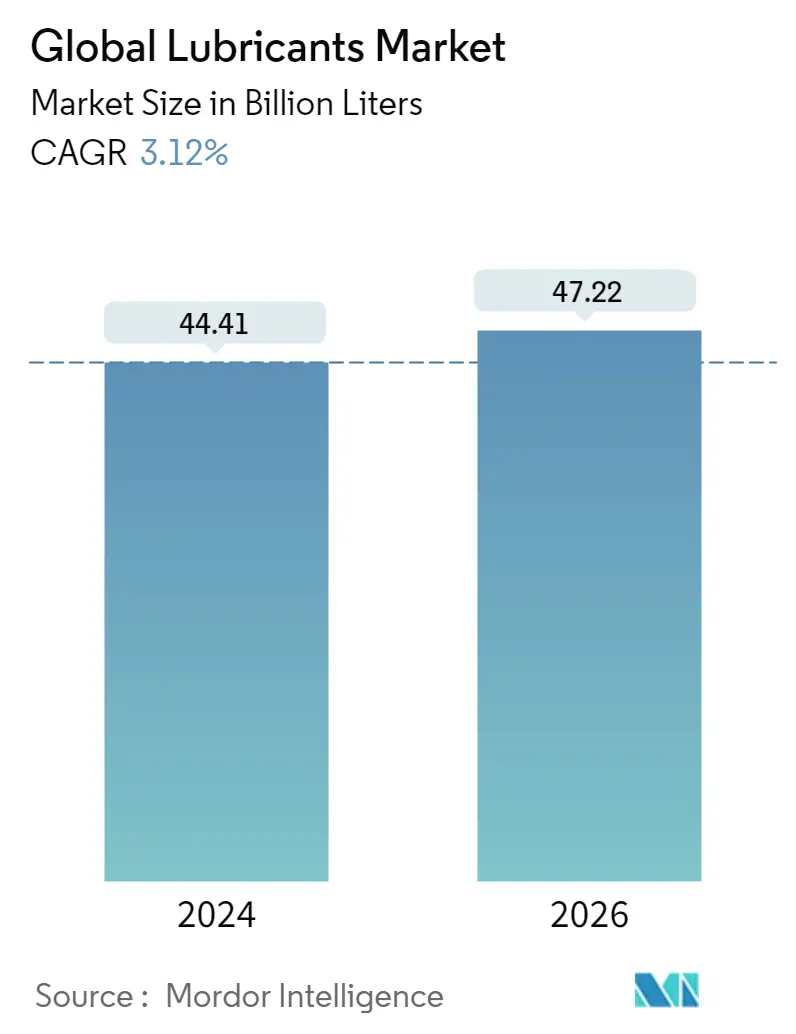
Lubricants Market Size

| Icons | Lable | Value |
|---|---|---|
|
|
Study Period | 2015 - 2026 |
|
|
Market Volume (2024) | 44.41 Billion Liters |
|
|
Market Volume (2026) | 47.22 Billion Liters |
|
|
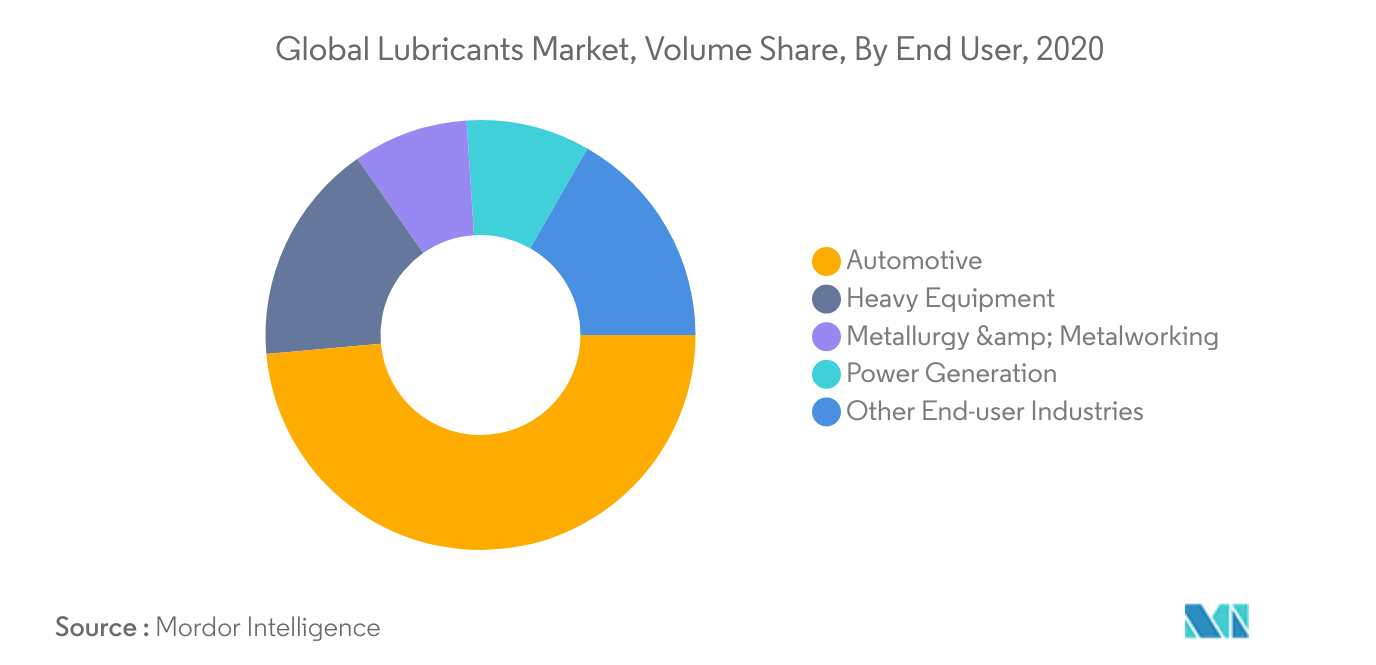
Largest Share by End User | Automotive |
|
|
CAGR (2024 - 2026) | 3.12 % |
|
|
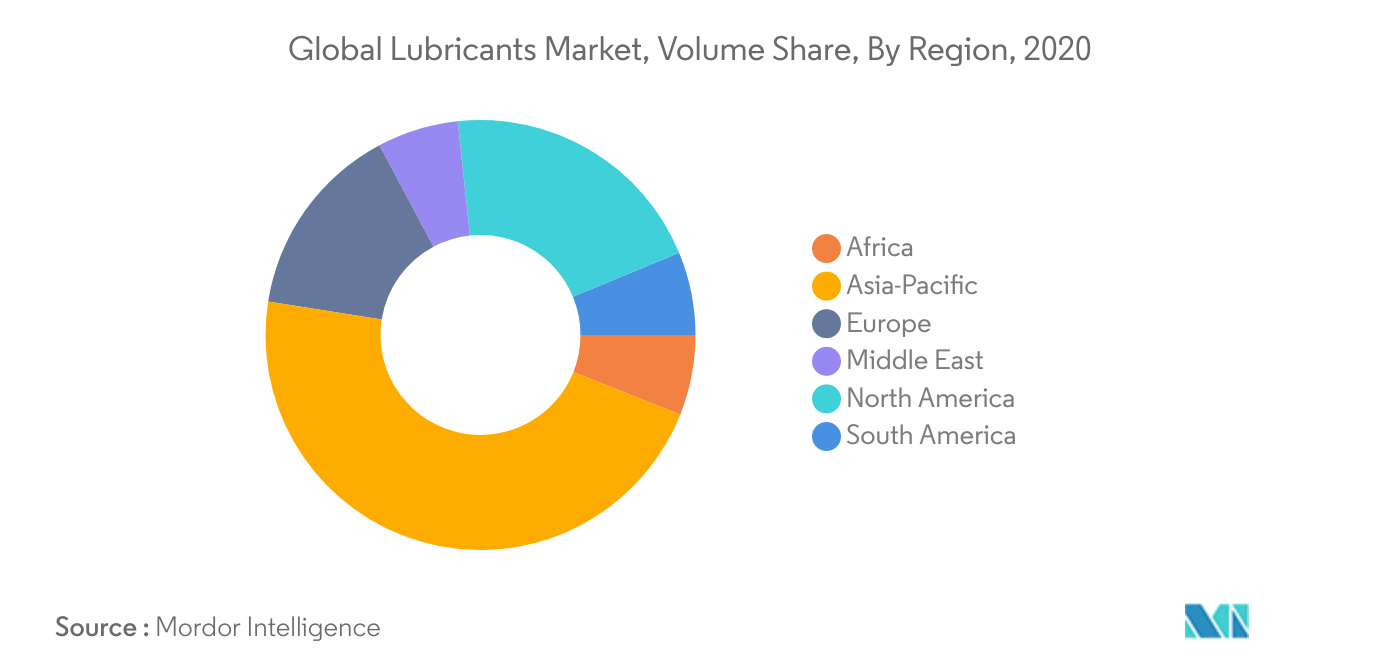
Largest Share by Region | Asia-Pacific |
Major Players |
||
|
|
||
|
*Disclaimer: Major Players sorted in no particular order |
Lubricants Market Analysis
The Global Lubricants Market size is estimated at 44.41 Billion Liters in 2024, and is expected to reach 47.22 Billion Liters by 2026, growing at a CAGR of 3.12% during the forecast period (2024-2026).
- Largest Segment by End-user Industry - Automotive : Automotive was the largest end-user among all categories due to the high replacement cycles of lubricants used in motor vehicles compared to any other industrial application.
- Fastest Segment by End-user Industry - Power Generation : Power generation is projected to be the fastest-growing end-user globally due to the increasing demand for low-cost energy from natural gas and wind power plants.
- Largest Region Market - Asia-Pacific : Asia-Pacific, driven mainly by India, China, and Japan, is the major lubricant-consuming region due to high vehicle ownerships and industrial machinery than any other region.
- Fastest Growing Region Market - Asia-Pacific : Due to rising urbanization, increased electricity use, and rising vehicle ownership in China and India, Asia-Pacific is projected to be the fastest-growing region.
Lubricants Market Trends
This section covers the major market trends shaping the Lubricants Market according to our research experts:
Largest Segment By End User : Automotive
- In 2020, the automotive industry dominated the global lubricants market, accounting for around half of the total lubricant consumption. During 2015-2019, lubricant consumption in the automotive industry increased by 11% due to growth in vehicle sales and usage.
- In 2020, COVID-19-related restrictions led to declined maintenance requirements from several industries. The major impact was observed in the automotive industry, which recorded a dip of 10.1% during the year, followed by heavy equipment (7.66%).
- Power generation is likely to be the fastest-growing end-user industry of the global lubricants market during 2021-2026, with a CAGR of 4.8%, followed by automotive (3.8%). The capacity additions in the renewable energy sector worldwide will likely drive lubricant consumption in the power generation industry.
Largest Region : Asia-Pacific
- In 2020, Asia-Pacific was the leading consumer of lubricants in the world, accounting for around 46% of the global lubricant consumption. During 2015-2019, lubricant consumption in the Asia-Pacific region increased by around 20%, driven by China, India, and Indonesia.
- In 2020, the COVID-19 outbreak restrained the operations of several industries, thereby restraining lubricant consumption across the globe. North America was the most affected, with a 13.4% drop in its lubricant consumption, followed by Europe, with an 11.29% drop, during 2019-20.
- Asia-Pacific is likely to be the fastest-growing lubricants market in Africa during 2021-26, with a CAGR of around 4.3%. The recovering automotive sales and usage combined with growing industrial activities in the region are likely to drive the growth of the Asia-Pacific lubricants market in the near future.
Lubricants Industry Overview
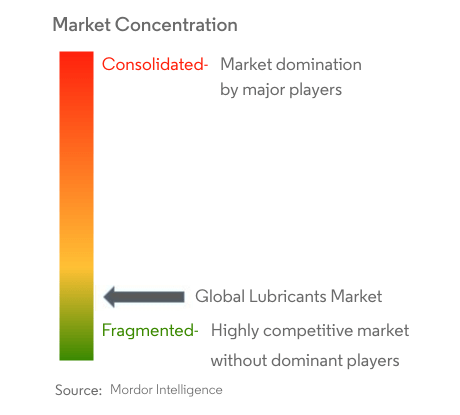
The Global Lubricants Market is fragmented, with the top five companies occupying 38.45%. The major players in this market are BP PLC (Castrol), China National Petroleum Corporation, China Petroleum & Chemical Corporation, ExxonMobil Corporation and Royal Dutch Shell PLC (sorted alphabetically).
Lubricants Market Leaders
BP PLC (Castrol)
China National Petroleum Corporation
China Petroleum & Chemical Corporation
ExxonMobil Corporation
Royal Dutch Shell PLC
*Disclaimer: Major Players sorted in no particular order
Lubricants Market News
- May 2022: TotalEnergies, NEXUS Automotive Extend Strategic Partnership for a period of five years. As part of this partnership, TotalEnergies Lubricants will be expanding its presence in the burgeoning N! community, which has seen rapid growth in sales from EUR 7.2 billion in 2015 to nearly EUR 35 billion by the end of 2021.
- April 2022: FUCHS company introduced AGRI FARM lubricants which are especially suited for high-end agricultural machines.
- April 2022: FUCHS Lubricants South Africa has introduced new food-grade Renolin SJL Heavy and Renolin SJL Winter lubricants for the sugar processing industry.The new lubricant offers benefits such as equipment longevity and food safety.
Lubricants Market Report - Table of Contents
1. Executive Summary & Key Findings
2. Introduction
2.1. Study Assumptions & Market Definition
2.2. Scope of the Study
2.3. Research Methodology
3. Key Industry Trends
3.1. Automotive Industry Trends
3.2. Manufacturing Industry Trends
3.3. Power Generation Industry Trends
3.4. Regulatory Framework
3.5. Value Chain & Distribution Channel Analysis
4. Market Segmentation
4.1. By End User
4.1.1. Automotive
4.1.2. Heavy Equipment
4.1.3. Metallurgy & Metalworking
4.1.4. Power Generation
4.1.5. Other End-user Industries
4.2. By Product Type
4.2.1. Engine Oils
4.2.2. Greases
4.2.3. Hydraulic Fluids
4.2.4. Metalworking Fluids
4.2.5. Transmission & Gear Oils
4.2.6. Other Product Types
4.3. By Region
4.3.1. Africa
4.3.1.1. Egypt
4.3.1.2. Morocco
4.3.1.3. Nigeria
4.3.1.4. South Africa
4.3.1.5. Rest of Africa
4.3.2. Asia-Pacific
4.3.2.1. China
4.3.2.2. India
4.3.2.3. Indonesia
4.3.2.4. Japan
4.3.2.5. Malaysia
4.3.2.6. South Korea
4.3.2.7. Thailand
4.3.2.8. Vietnam
4.3.2.9. Rest of Asia-Pacific
4.3.3. Europe
4.3.3.1. France
4.3.3.2. Germany
4.3.3.3. Italy
4.3.3.4. Russia
4.3.3.5. Spain
4.3.3.6. United Kingdom
4.3.3.7. Rest of Europe
4.3.4. Middle East
4.3.4.1. Iran
4.3.4.2. Qatar
4.3.4.3. Saudi Arabia
4.3.4.4. Turkey
4.3.4.5. UAE
4.3.4.6. Rest of Middle East
4.3.5. North America
4.3.5.1. Canada
4.3.5.2. Mexico
4.3.5.3. United States
4.3.5.4. Rest of North America
4.3.6. South America
4.3.6.1. Argentina
4.3.6.2. Brazil
4.3.6.3. Rest of South America
5. Competitive Landscape
5.1. Key Strategic Moves
5.2. Market Share Analysis
5.3. Company Profiles
5.3.1. Behran Oil Company
5.3.2. BP PLC (Castrol)
5.3.3. Carl Bechem GmbH
5.3.4. Chevron Corporation
5.3.5. China National Petroleum Corporation
5.3.6. China Petroleum & Chemical Corporation
5.3.7. Coperative Soceite des petroleum
5.3.8. ENEOS Corporation
5.3.9. Eni SpA
5.3.10. ExxonMobil Corporation
5.3.11. FUCHS
5.3.12. Gazprom
5.3.13. GS Caltex
5.3.14. Gulf Oil International
5.3.15. Hindustan Petroleum Corporation Limited
5.3.16. Idemitsu Kosan Co. Ltd
5.3.17. Indian Oil Corporation Limited
5.3.18. Lukoil
5.3.19. Motul
5.3.20. Petromin Corporation
5.3.21. Petronas Lubricants International
5.3.22. Phillips 66 Lubricants
5.3.23. PT Pertamina
5.3.24. PTT Lubricants
5.3.25. Rosneft
5.3.26. Royal Dutch Shell PLC
5.3.27. Terpel
5.3.28. TotalEnergies
5.3.29. Valvoline Inc.
5.3.30. YPF
6. Appendix
6.1. Appendix-1 References
6.2. Appendix-2 List of Tables & Figures
7. Key Strategic Questions for Lubricants CEOs
List of Tables & Figures
- Figure 1:
- VEHICLE POPULATION, NUMBER OF UNITS, GLOBAL, 2015-2027
- Figure 2:
- COMMERCIAL VEHICLES POPULATION, NUMBER OF UNITS, GLOBAL, 2015-2027
- Figure 3:
- MOTORCYCLES POPULATION, NUMBER OF UNITS, GLOBAL, 2015-2027
- Figure 4:
- PASSENGER VEHICLES POPULATION, NUMBER OF UNITS, GLOBAL, 2015-2027
- Figure 5:
- MANUFACTURING VALUE ADDED, USD BILLION (CURRENT VALUE), GLOBAL, 2015-2027
- Figure 6:
- POWER GENERATION CAPACITY, GIGAWATT (GW), GLOBAL, 2015-2027
- Figure 7:
- GLOBAL LUBRICANTS MARKET, VOLUME IN LITERS, BY END USER, 2015-2027
- Figure 8:
- GLOBAL LUBRICANTS MARKET, VOLUME SHARE (%), BY END USER, 2021
- Figure 9:
- GLOBAL LUBRICANTS MARKET, VOLUME IN LITERS, AUTOMOTIVE, 2015-2027
- Figure 10:
- GLOBAL LUBRICANTS MARKET, AUTOMOTIVE, VOLUME SHARE (%), BY PRODUCT TYPE, 2021
- Figure 11:
- GLOBAL LUBRICANTS MARKET, VOLUME IN LITERS, HEAVY EQUIPMENT, 2015-2027
- Figure 12:
- GLOBAL LUBRICANTS MARKET, HEAVY EQUIPMENT, VOLUME SHARE (%), BY PRODUCT TYPE, 2021
- Figure 13:
- GLOBAL LUBRICANTS MARKET, VOLUME IN LITERS, METALLURGY & METALWORKING, 2015-2027
- Figure 14:
- GLOBAL LUBRICANTS MARKET, METALLURGY & METALWORKING, VOLUME SHARE (%), BY PRODUCT TYPE, 2021
- Figure 15:
- GLOBAL LUBRICANTS MARKET, VOLUME IN LITERS, POWER GENERATION, 2015-2027
- Figure 16:
- GLOBAL LUBRICANTS MARKET, POWER GENERATION, VOLUME SHARE (%), BY PRODUCT TYPE, 2021
- Figure 17:
- GLOBAL LUBRICANTS MARKET, VOLUME IN LITERS, OTHER END-USER INDUSTRIES, 2015-2027
- Figure 18:
- GLOBAL LUBRICANTS MARKET, OTHER END-USER INDUSTRIES, VOLUME SHARE (%), BY PRODUCT TYPE, 2021
- Figure 19:
- GLOBAL LUBRICANTS MARKET, VOLUME IN LITERS, BY PRODUCT TYPE, 2015-2027
- Figure 20:
- GLOBAL LUBRICANTS MARKET, VOLUME SHARE (%), BY PRODUCT TYPE, 2021
- Figure 21:
- GLOBAL LUBRICANTS MARKET, VOLUME IN LITERS, ENGINE OILS, 2015-2027
- Figure 22:
- GLOBAL LUBRICANTS MARKET, ENGINE OILS, VOLUME SHARE (%), BY END USER, 2021
- Figure 23:
- GLOBAL LUBRICANTS MARKET, VOLUME IN LITERS, GREASES, 2015-2027
- Figure 24:
- GLOBAL LUBRICANTS MARKET, GREASES, VOLUME SHARE (%), BY END USER, 2021
- Figure 25:
- GLOBAL LUBRICANTS MARKET, VOLUME IN LITERS, HYDRAULIC FLUIDS, 2015-2027
- Figure 26:
- GLOBAL LUBRICANTS MARKET, HYDRAULIC FLUIDS, VOLUME SHARE (%), BY END USER, 2021
- Figure 27:
- GLOBAL LUBRICANTS MARKET, VOLUME IN LITERS, METALWORKING FLUIDS, 2015-2027
- Figure 28:
- GLOBAL LUBRICANTS MARKET, METALWORKING FLUIDS, VOLUME SHARE (%), BY END USER, 2021
- Figure 29:
- GLOBAL LUBRICANTS MARKET, VOLUME IN LITERS, TRANSMISSION & GEAR OILS, 2015-2027
- Figure 30:
- GLOBAL LUBRICANTS MARKET, TRANSMISSION & GEAR OILS, VOLUME SHARE (%), BY END USER, 2021
- Figure 31:
- GLOBAL LUBRICANTS MARKET, VOLUME IN LITERS, OTHER PRODUCT TYPES, 2015-2027
- Figure 32:
- GLOBAL LUBRICANTS MARKET, OTHER PRODUCT TYPES, VOLUME SHARE (%), BY END USER, 2021
- Figure 33:
- GLOBAL LUBRICANTS MARKET, VOLUME IN LITERS, BY REGION, 2015-2027
- Figure 34:
- GLOBAL LUBRICANTS MARKET, VOLUME SHARE (%), BY REGION, 2021
- Figure 35:
- GLOBAL LUBRICANTS MARKET, VOLUME IN LITERS, AFRICA, BY COUNTRY, 2015-2027
- Figure 36:
- GLOBAL LUBRICANTS MARKET, VOLUME SHARE (%), AFRICA, BY COUNTRY, 2021
- Figure 37:
- GLOBAL LUBRICANTS MARKET, VOLUME IN LITERS, EGYPT, 2015-2027
- Figure 38:
- GLOBAL LUBRICANTS MARKET, EGYPT, VOLUME SHARE (%), BY PRODUCT TYPE, 2021
- Figure 39:
- GLOBAL LUBRICANTS MARKET, VOLUME IN LITERS, MOROCCO, 2015-2027
- Figure 40:
- GLOBAL LUBRICANTS MARKET, MOROCCO, VOLUME SHARE (%), BY PRODUCT TYPE, 2021
- Figure 41:
- GLOBAL LUBRICANTS MARKET, VOLUME IN LITERS, NIGERIA, 2015-2027
- Figure 42:
- GLOBAL LUBRICANTS MARKET, NIGERIA, VOLUME SHARE (%), BY PRODUCT TYPE, 2021
- Figure 43:
- GLOBAL LUBRICANTS MARKET, VOLUME IN LITERS, SOUTH AFRICA, 2015-2027
- Figure 44:
- GLOBAL LUBRICANTS MARKET, SOUTH AFRICA, VOLUME SHARE (%), BY PRODUCT TYPE, 2021
- Figure 45:
- GLOBAL LUBRICANTS MARKET, VOLUME IN LITERS, REST OF AFRICA, 2015-2027
- Figure 46:
- GLOBAL LUBRICANTS MARKET, REST OF AFRICA, VOLUME SHARE (%), BY PRODUCT TYPE, 2021
- Figure 47:
- GLOBAL LUBRICANTS MARKET, VOLUME IN LITERS, ASIA-PACIFIC, BY COUNTRY, 2015-2027
- Figure 48:
- GLOBAL LUBRICANTS MARKET, VOLUME SHARE (%), ASIA-PACIFIC, BY COUNTRY, 2021
- Figure 49:
- GLOBAL LUBRICANTS MARKET, VOLUME IN LITERS, CHINA, 2015-2027
- Figure 50:
- GLOBAL LUBRICANTS MARKET, CHINA, VOLUME SHARE (%), BY PRODUCT TYPE, 2021
- Figure 51:
- GLOBAL LUBRICANTS MARKET, VOLUME IN LITERS, INDIA, 2015-2027
- Figure 52:
- GLOBAL LUBRICANTS MARKET, INDIA, VOLUME SHARE (%), BY PRODUCT TYPE, 2021
- Figure 53:
- GLOBAL LUBRICANTS MARKET, VOLUME IN LITERS, INDONESIA, 2015-2027
- Figure 54:
- GLOBAL LUBRICANTS MARKET, INDONESIA, VOLUME SHARE (%), BY PRODUCT TYPE, 2021
- Figure 55:
- GLOBAL LUBRICANTS MARKET, VOLUME IN LITERS, JAPAN, 2015-2027
- Figure 56:
- GLOBAL LUBRICANTS MARKET, JAPAN, VOLUME SHARE (%), BY PRODUCT TYPE, 2021
- Figure 57:
- GLOBAL LUBRICANTS MARKET, VOLUME IN LITERS, MALAYSIA, 2015-2027
- Figure 58:
- GLOBAL LUBRICANTS MARKET, MALAYSIA, VOLUME SHARE (%), BY PRODUCT TYPE, 2021
- Figure 59:
- GLOBAL LUBRICANTS MARKET, VOLUME IN LITERS, SOUTH KOREA, 2015-2027
- Figure 60:
- GLOBAL LUBRICANTS MARKET, SOUTH KOREA, VOLUME SHARE (%), BY PRODUCT TYPE, 2021
- Figure 61:
- GLOBAL LUBRICANTS MARKET, VOLUME IN LITERS, THAILAND, 2015-2027
- Figure 62:
- GLOBAL LUBRICANTS MARKET, THAILAND, VOLUME SHARE (%), BY PRODUCT TYPE, 2021
- Figure 63:
- GLOBAL LUBRICANTS MARKET, VOLUME IN LITERS, VIETNAM, 2015-2027
- Figure 64:
- GLOBAL LUBRICANTS MARKET, VIETNAM, VOLUME SHARE (%), BY PRODUCT TYPE, 2021
- Figure 65:
- GLOBAL LUBRICANTS MARKET, VOLUME IN LITERS, REST OF ASIA-PACIFIC, 2015-2027
- Figure 66:
- GLOBAL LUBRICANTS MARKET, REST OF ASIA-PACIFIC, VOLUME SHARE (%), BY PRODUCT TYPE, 2021
- Figure 67:
- GLOBAL LUBRICANTS MARKET, VOLUME IN LITERS, EUROPE, BY COUNTRY, 2015-2027
- Figure 68:
- GLOBAL LUBRICANTS MARKET, VOLUME SHARE (%), EUROPE, BY COUNTRY, 2021
- Figure 69:
- GLOBAL LUBRICANTS MARKET, VOLUME IN LITERS, FRANCE, 2015-2027
- Figure 70:
- GLOBAL LUBRICANTS MARKET, FRANCE, VOLUME SHARE (%), BY PRODUCT TYPE, 2021
- Figure 71:
- GLOBAL LUBRICANTS MARKET, VOLUME IN LITERS, GERMANY, 2015-2027
- Figure 72:
- GLOBAL LUBRICANTS MARKET, GERMANY, VOLUME SHARE (%), BY PRODUCT TYPE, 2021
- Figure 73:
- GLOBAL LUBRICANTS MARKET, VOLUME IN LITERS, ITALY, 2015-2027
- Figure 74:
- GLOBAL LUBRICANTS MARKET, ITALY, VOLUME SHARE (%), BY PRODUCT TYPE, 2021
- Figure 75:
- GLOBAL LUBRICANTS MARKET, VOLUME IN LITERS, RUSSIA, 2015-2027
- Figure 76:
- GLOBAL LUBRICANTS MARKET, RUSSIA, VOLUME SHARE (%), BY PRODUCT TYPE, 2021
- Figure 77:
- GLOBAL LUBRICANTS MARKET, VOLUME IN LITERS, SPAIN, 2015-2027
- Figure 78:
- GLOBAL LUBRICANTS MARKET, SPAIN, VOLUME SHARE (%), BY PRODUCT TYPE, 2021
- Figure 79:
- GLOBAL LUBRICANTS MARKET, VOLUME IN LITERS, UNITED KINGDOM, 2015-2027
- Figure 80:
- GLOBAL LUBRICANTS MARKET, UNITED KINGDOM, VOLUME SHARE (%), BY PRODUCT TYPE, 2021
- Figure 81:
- GLOBAL LUBRICANTS MARKET, VOLUME IN LITERS, REST OF EUROPE, 2015-2027
- Figure 82:
- GLOBAL LUBRICANTS MARKET, REST OF EUROPE, VOLUME SHARE (%), BY PRODUCT TYPE, 2021
- Figure 83:
- GLOBAL LUBRICANTS MARKET, VOLUME IN LITERS, MIDDLE EAST, BY COUNTRY, 2015-2027
- Figure 84:
- GLOBAL LUBRICANTS MARKET, VOLUME SHARE (%), MIDDLE EAST, BY COUNTRY, 2021
- Figure 85:
- GLOBAL LUBRICANTS MARKET, VOLUME IN LITERS, IRAN, 2015-2027
- Figure 86:
- GLOBAL LUBRICANTS MARKET, IRAN, VOLUME SHARE (%), BY PRODUCT TYPE, 2021
- Figure 87:
- GLOBAL LUBRICANTS MARKET, VOLUME IN LITERS, QATAR, 2015-2027
- Figure 88:
- GLOBAL LUBRICANTS MARKET, QATAR, VOLUME SHARE (%), BY PRODUCT TYPE, 2021
- Figure 89:
- GLOBAL LUBRICANTS MARKET, VOLUME IN LITERS, SAUDI ARABIA, 2015-2027
- Figure 90:
- GLOBAL LUBRICANTS MARKET, SAUDI ARABIA, VOLUME SHARE (%), BY PRODUCT TYPE, 2021
- Figure 91:
- GLOBAL LUBRICANTS MARKET, VOLUME IN LITERS, TURKEY, 2015-2027
- Figure 92:
- GLOBAL LUBRICANTS MARKET, TURKEY, VOLUME SHARE (%), BY PRODUCT TYPE, 2021
- Figure 93:
- GLOBAL LUBRICANTS MARKET, VOLUME IN LITERS, UAE, 2015-2027
- Figure 94:
- GLOBAL LUBRICANTS MARKET, UAE, VOLUME SHARE (%), BY PRODUCT TYPE, 2021
- Figure 95:
- GLOBAL LUBRICANTS MARKET, VOLUME IN LITERS, REST OF MIDDLE EAST, 2015-2027
- Figure 96:
- GLOBAL LUBRICANTS MARKET, REST OF MIDDLE EAST, VOLUME SHARE (%), BY PRODUCT TYPE, 2021
- Figure 97:
- GLOBAL LUBRICANTS MARKET, VOLUME IN LITERS, NORTH AMERICA, BY COUNTRY, 2015-2027
- Figure 98:
- GLOBAL LUBRICANTS MARKET, VOLUME SHARE (%), NORTH AMERICA, BY COUNTRY, 2021
- Figure 99:
- GLOBAL LUBRICANTS MARKET, VOLUME IN LITERS, CANADA, 2015-2027
- Figure 100:
- GLOBAL LUBRICANTS MARKET, CANADA, VOLUME SHARE (%), BY PRODUCT TYPE, 2021
- Figure 101:
- GLOBAL LUBRICANTS MARKET, VOLUME IN LITERS, MEXICO, 2015-2027
- Figure 102:
- GLOBAL LUBRICANTS MARKET, MEXICO, VOLUME SHARE (%), BY PRODUCT TYPE, 2021
- Figure 103:
- GLOBAL LUBRICANTS MARKET, VOLUME IN LITERS, UNITED STATES, 2015-2027
- Figure 104:
- GLOBAL LUBRICANTS MARKET, UNITED STATES, VOLUME SHARE (%), BY PRODUCT TYPE, 2021
- Figure 105:
- GLOBAL LUBRICANTS MARKET, VOLUME IN LITERS, REST OF NORTH AMERICA, 2015-2027
- Figure 106:
- GLOBAL LUBRICANTS MARKET, REST OF NORTH AMERICA, VOLUME SHARE (%), BY PRODUCT TYPE, 2021
- Figure 107:
- GLOBAL LUBRICANTS MARKET, VOLUME IN LITERS, SOUTH AMERICA, BY COUNTRY, 2015-2027
- Figure 108:
- GLOBAL LUBRICANTS MARKET, VOLUME SHARE (%), SOUTH AMERICA, BY COUNTRY, 2021
- Figure 109:
- GLOBAL LUBRICANTS MARKET, VOLUME IN LITERS, ARGENTINA, 2015-2027
- Figure 110:
- GLOBAL LUBRICANTS MARKET, ARGENTINA, VOLUME SHARE (%), BY PRODUCT TYPE, 2021
- Figure 111:
- GLOBAL LUBRICANTS MARKET, VOLUME IN LITERS, BRAZIL, 2015-2027
- Figure 112:
- GLOBAL LUBRICANTS MARKET, BRAZIL, VOLUME SHARE (%), BY PRODUCT TYPE, 2021
- Figure 113:
- GLOBAL LUBRICANTS MARKET, VOLUME IN LITERS, REST OF SOUTH AMERICA, 2015-2027
- Figure 114:
- GLOBAL LUBRICANTS MARKET, REST OF SOUTH AMERICA, VOLUME SHARE (%), BY PRODUCT TYPE, 2021
- Figure 115:
- GLOBAL LUBRICANTS MARKET, MOST ACTIVE COMPANIES, BY NUMBER OF STRATEGIC MOVES, 2018 - 2021
- Figure 116:
- GLOBAL LUBRICANTS MARKET, MOST ADOPTED STRATEGIES, 2018 - 2021
- Figure 117:
- GLOBAL LUBRICANTS MARKET SHARE(%), BY MAJOR PLAYERS, 2021
Lubricants Industry Segmentation
| By End User | |
| Automotive | |
| Heavy Equipment | |
| Metallurgy & Metalworking | |
| Power Generation | |
| Other End-user Industries |
| By Product Type | |
| Engine Oils | |
| Greases | |
| Hydraulic Fluids | |
| Metalworking Fluids | |
| Transmission & Gear Oils | |
| Other Product Types |
| By Region | |||||||||||
| |||||||||||
| |||||||||||
| |||||||||||
| |||||||||||
| |||||||||||
|
Market Definition
- Vehicle Types and Industrial Equipment - Automotive (Passenger Vehicles, Commercial Vehicles and Motorcycles), Power Generation, Heavy Equipment, Metallurgy & Metalworking and Other End-user Industries (Marine, Aviation etc.) are considered under the lubricants market.
- Product Types - For the purpose of this study, lubricant products such as engine oils, transmission & gear oils, hydraulic fluids, metalworking fluids, and greases are taken into consideration.
- Service Refill - Service/maintenance refill is considered while accounting the lubricant consumption for each of the vehicle and equipment, under the study.
- Factory Fill - First lubricant fill-ups for newly produced vehicles and industrial equipment are considered under the study.
Research Methodology
Mordor Intelligence follows a four-step methodology in all our reports.
- Step-1: Identify Key Variables: The quantifiable key variables (industry and extraneous) pertaining to the specific product segment and country are selected from a group of relevant variables & factors based on desk research & literature review; along with primary expert inputs. These variables are further confirmed through regression modeling (wherever required).
- Step-2: Build a Market Model: In order to build a robust forecasting methodology, the variables and factors identified in Step-1 are tested against available historical market numbers. Through an iterative process, the variables required for market forecast are set and the model is built on the basis of these variables.
- Step-3: Validate and Finalize: In this important step, all market numbers, variables and analyst calls are validated through an extensive network of primary research experts from the market studied. The respondents are selected across levels and functions to generate a holistic picture of the market studied.
- Step-4: Research Outputs: Syndicated Reports, Custom Consulting Assignments, Databases & Subscription Platforms


