
Market Overview
| Study Period | 2020 - 2031 |
|---|---|
| Forecast Data Period | 2026 - 2031 |
| Base Year Market Size (2025) | USD 3.5 Billion |
| Market Size (2026) | USD 3.67 Billion |
| Market Size (2031) | USD 4.71 Billion |
| Growth Rate (2026 - 2031) | 5.12 % |
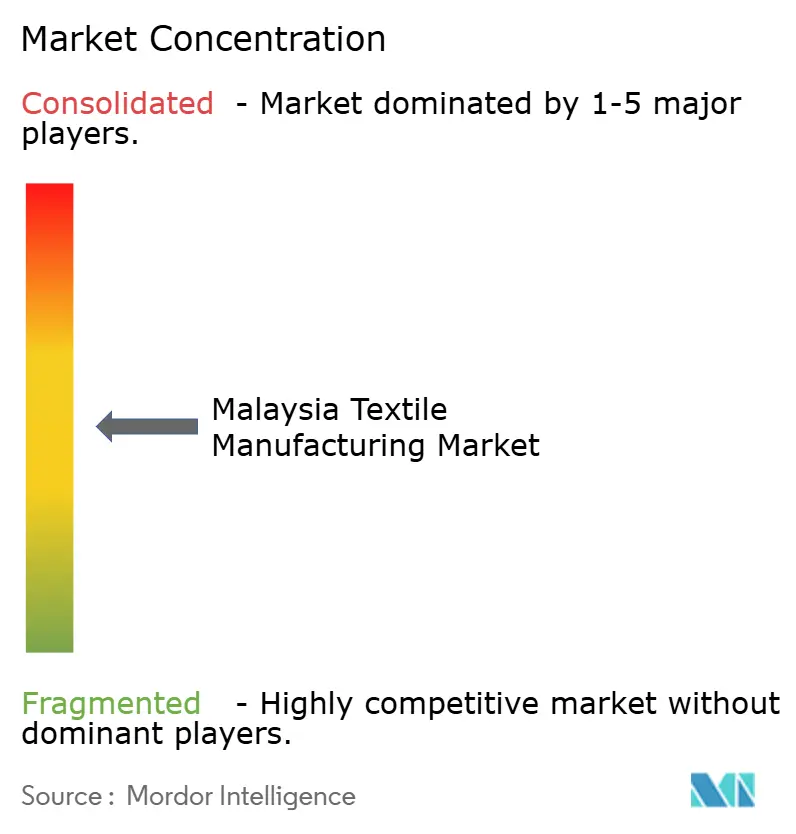
| Market Concentration | Medium |
Major Players *Disclaimer: Major Players sorted in no particular order Image © Mordor Intelligence. Reuse requires attribution under CC BY 4.0. | |
Malaysia Textile Manufacturing Market Analysis by Mordor Intelligence
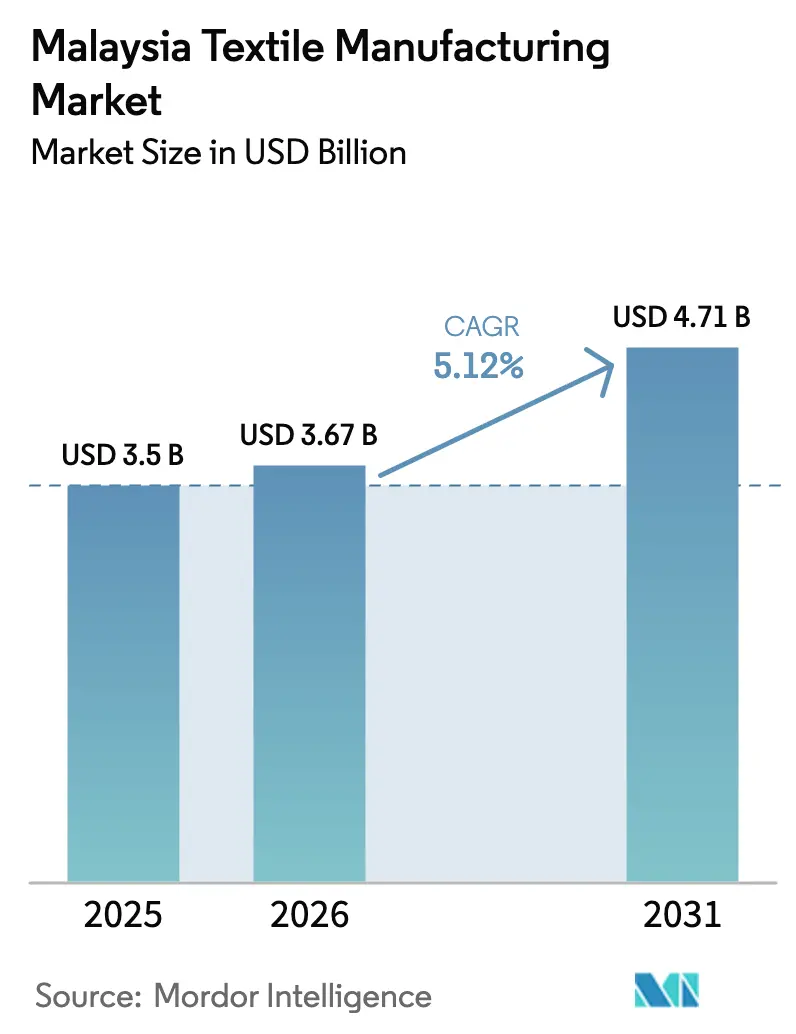
The Malaysia Textile Manufacturing Market size is projected to be USD 3.5 billion in 2025, USD 3.67 billion in 2026, and reach USD 4.71 billion by 2031, growing at a CAGR of 5.12% from 2026 to 2031.
Larger order volumes triggered by Regional Comprehensive Economic Partnership (RCEP) tariff eliminations, steady e-commerce demand for fast fashion, and a reinstated Investment Tax Allowance (ITA) are enabling producers to recover automation costs faster, even as energy and labor expenses rise. Polyester staple fiber output is scaling up in Penang to meet European Digital Product Passport recycled-content mandates, while non-woven investments position local mills as preferred suppliers for ASEAN personal protective equipment (PPE) replenishment. Northern Malaysia leads capacity expansions because its integrated clusters reduce lead times, whereas Central dyeing houses face margin pressure from the July 2025 electricity tariff hike. Moderate fragmentation persists, yet players that deploy blockchain traceability and renewable energy solutions are widening their competitive moat.
Key Report Takeaways
- By application, fashion and apparel led with 54.1% of Malaysia's textile manufacturing market share in 2025; industrial and technical textiles are forecast to expand at a 6.54% CAGR through 2031.
- By raw material, synthetic fibers dominated with 45.19% of revenue in 2025; polyester is the quickest-growing sub-segment at a 6.89% CAGR to 2031.
- By process, woven fabrics retained a 52.19% share in 2025; non-woven production is set to grow the fastest at a 6.37% CAGR through 2031.
- By geography, Northern Malaysia held 39.97% of 2025 revenue; the region is expected to log the highest 6.15% CAGR during 2026-2031.
Note: Market size and forecast figures in this report are generated using Mordor Intelligence’s proprietary estimation framework, updated with the latest available data and insights as of January 2026.
Market Trends and Insights
Drivers Impact Analysis of Malaysia Textile Manufacturing Market*
| Drivers | (~) % IMPACT ON CAGR FORECAST | Geographic Relevance | Impact Timeline |
|---|---|---|---|
| RCEP tariff eliminations are accelerating yarn exports | +0.8% | National, with concentration in Northern (Penang, Kedah) and Southern (Johor) export hubs | Medium term (2-4 years) |
| E-commerce-driven resurgence in ASEAN fast-fashion demand | +0.7% | National, with supply-chain nodes in Central (Selangor, Kuala Lumpur) and Northern regions | Short term (≤ 2 years) |
| Reinstated textile Investment Tax Allowance (ITA) 2025 | +0.6% | National, early uptake in Northern and Central industrial corridors | Medium term (2-4 years) |
| PPE stockpile renewal boosting healthcare textile orders | +0.4% | National, with manufacturing concentration in Northern (Penang) and Southern (Johor) | Short term (≤ 2 years) |
| Penang Circularity Industrial Park supplying recycled fibers | +0.3% | Northern (Penang), spillover to Central (Selangor) | Long term (≥ 4 years) |
| Early blockchain traceability adoption for EU Digital Product Passport | +0.3% | National, prioritized by exporters in Northern and Central regions | Medium term (2-4 years) |
| Source: Mordor Intelligence | |||
RCEP Tariff Eliminations Accelerating Yarn Exports
Preferential access under RCEP has lowered Malaysian yarn duties in China, Japan, South Korea, and Australia, lifting margins by 5–8 percentage points for compliant suppliers. Producers may combine Australian wool or Chinese polyester chips without losing origin status, a benefit already exploited by mid-scale spinners in Penang and Kedah. Foreign direct investment approvals for textile projects jumped 8% of Malaysia’s 2024 manufacturing total, signaling confidence in a yarn-export hub. Capacity gains disproportionately reward integrated mills that spin in-house, though cut-make-trim contractors capture upside only if contracts allow pass-through pricing. Continued tariff phase-outs to 2026 keep this tailwind intact.[1]
E-commerce-Driven Resurgence in ASEAN Fast-Fashion Demand
Regional gross merchandise value for online marketplaces touched USD 139 billion in 2024, with apparel as the second-largest category. Platforms such as Shopee and Lazada now aggregate small-lot orders in Malaysian hubs, cutting turnaround times to 21 days and rewarding agile knitters who invested in automated cutting and digital patterning. ZALORA’s 33% jump in modest-wear sales benefits local batik and jersey makers that offer cultural design advantages. However, Vietnamese and Cambodian sourcing networks are expanding, so Malaysian firms must lock multi-year platform agreements before 2027.
Reinstated Textile Investment Tax Allowance (ITA) 2025
The 2025 ITA grants a 60% allowance on capital spending, offset against 70% of statutory income over five years, spurring upgrades to energy-efficient looms and water-saving dye lines. Penfabric is installing closed-loop recycling systems, while Ramatex has rolled out rooftop solar arrays up to 50 MW to hedge against fuel-cost volatility. Mid-sized knitters gain a more generous benefit versus Malaysia’s standard reinvestment allowance, yet uptake hinges on available technicians, a gap aggravated by stricter migrant-worker quotas. Firms that pair ITA claims with technical-training partnerships shorten payback periods and widen productivity gaps.
PPE Stockpile Renewal Boosting Healthcare Textile Orders
ASEAN health ministries began rotating expired 2020-era PPE in 2024, awarding 70% of Malaysia’s domestic tender for 500 million masks and 20 million gowns to local suppliers[2]. Oceancash Pacific is doubling spunbond and meltblown capacity to 16,000 tpa to meet this surge, while Penang non-woven lines operate near full utilization. ISO 13485 accreditation required by Malaysia’s regulators limits import threats from lower-cost producers. Although restocking moderates after 2027, manufacturers expanding into veterinary PPE and semiconductor clean-room garments are positioned for continued growth.
Restraints Impact Analysis of Malaysia Textile Manufacturing Market*
| Restraints | (~) % IMPACT ON CAGR FORECAST | Geographic Relevance | Impact Timeline |
|---|---|---|---|
| Stricter 2025 migrant-worker quota causing skilled-labour gaps | -0.6% | National, most severe in Northern (Penang, Kedah) and Central (Selangor) manufacturing zones | Medium term (2-4 years) |
| Escalating natural-gas tariffs under ICPT 2025 review | -0.5% | National, acute impact in Central (Selangor) and Southern (Johor, Melaka) dyeing clusters | Short term (≤ 2 years) |
| Ringgit volatility raising imported fiber & dye costs | -0.4% | National, with heightened exposure in Central (Selangor, Kuala Lumpur) import-dependent clusters | Short term (≤ 2 years) |
| Logistics bottlenecks from delayed Johor Port textile upgrades | -0.3% | Southern (Johor), with spillover delays affecting Central (Selangor) exporters using Johor Port | Medium term (2-4 years) |
| Source: Mordor Intelligence | |||
Stricter 2025 Migrant-Worker Quota Causing Skilled-Labor Gaps
A phased cut from 15% to 10% foreign-labor allocation by 2026 threatens mills where migrant dependence exceeds 40%. Unfilled vacancies already affect 35% of textile plants, pushing operator wages up 26.7% to USD 475/month in 2025. Larger players accelerate automation - Ramatex has deployed programmable sewing modules - yet SMEs struggle with financing despite the ITA window. Without faster technical-training rollouts, labor scarcity will cap output growth even as orders rebound.
Escalating Natural-Gas Tariffs Under ICPT 2025 Review
The July 2025 ICPT adjustment raised industrial electricity from 39.95 to 45.40 sen/kWh, lifting dyeing costs by USD 0.008–0.011 per kg and squeezing margins on commodity fabrics[3]. Selangor and Johor houses operating older boilers feel the sharpest pain, pushing some clients to shift finishing to Indonesia, where coal-fired power is cheaper. Malaysia’s 2025 budget earmarked USD 1.25 billion for efficiency grants, yet slow disbursement favors larger applicants and leaves SME dyers stranded. Unless subsidy access widens, domestic finishing could hollow out, weakening vertical integration advantages.
*Our forecasts treat driver/restraint impacts as directional, not additive. The impact forecasts reflect baseline growth, mix effects, and variable interactions.
Malaysia Textile Manufacturing Market Segment Analysis
By Application:
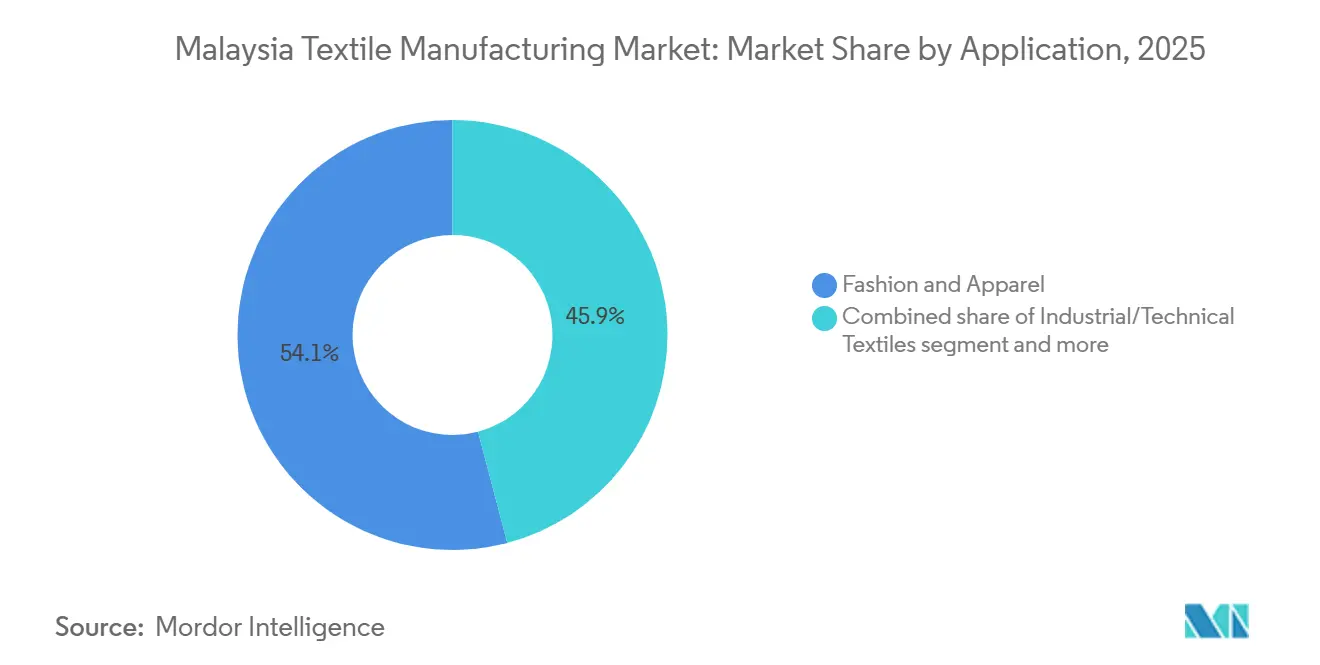
Technical Textiles Outpace Apparel on PPE and Automotive DemandFashion and apparel applications commanded 54.1% of 2025 revenue, underscoring the historical backbone of the Malaysia textile manufacturing market. Industrial and technical textiles, however, are set to grow at a 6.54% CAGR, the highest among applications, propelled by PPE restocking and automotive interior fabric localization for Proton and Perodua lines. The segment’s robust trajectory positions it to narrow the share gap with apparel by 2031.
Oceancash Pacific’s plan to double non-woven output to 16,000 tpa exemplifies capacity shifts toward spunbond and meltblown fabrics for surgical masks and gowns. Automotive interior supplier Chori Trading Malaysia is expanding its Selangor weaving lines to support electric-vehicle programs requiring flame-retardant, lightweight materials. Household textiles follow at a 4.8% pace, anchored by Malaysia’s housing starts, yet price-sensitive consumers keep Chinese and Indian imports competitive.

By Raw Material:
Polyester Surges on Recycled-Content MandatesSynthetic fibers captured 45.19% of 2025 revenue, with polyester logging the fastest 6.89% CAGR, driven by brands seeking Digital Product Passport-ready recycled PET. Toray’s 51,000 tpa Penfibre capacity and Far Eastern New Century’s forthcoming 30,000 tpa recycled line underscore investment momentum. In contrast, cotton’s 24% share grows only 4.5% as water-use concerns and price volatility encourage polyester-cotton blends.
Recycled fibers account for 8% of consumption and are expected to expand at a 7.2% CAGR, second only to virgin polyester, once Penang’s circularity infrastructure scales. Specialty high-performance fibers such as aramid and UHMWPE hold just 2% share but rise 6.1% annually, reflecting unmet demand for ballistic and marine applications now dominated by imports.
By Process:
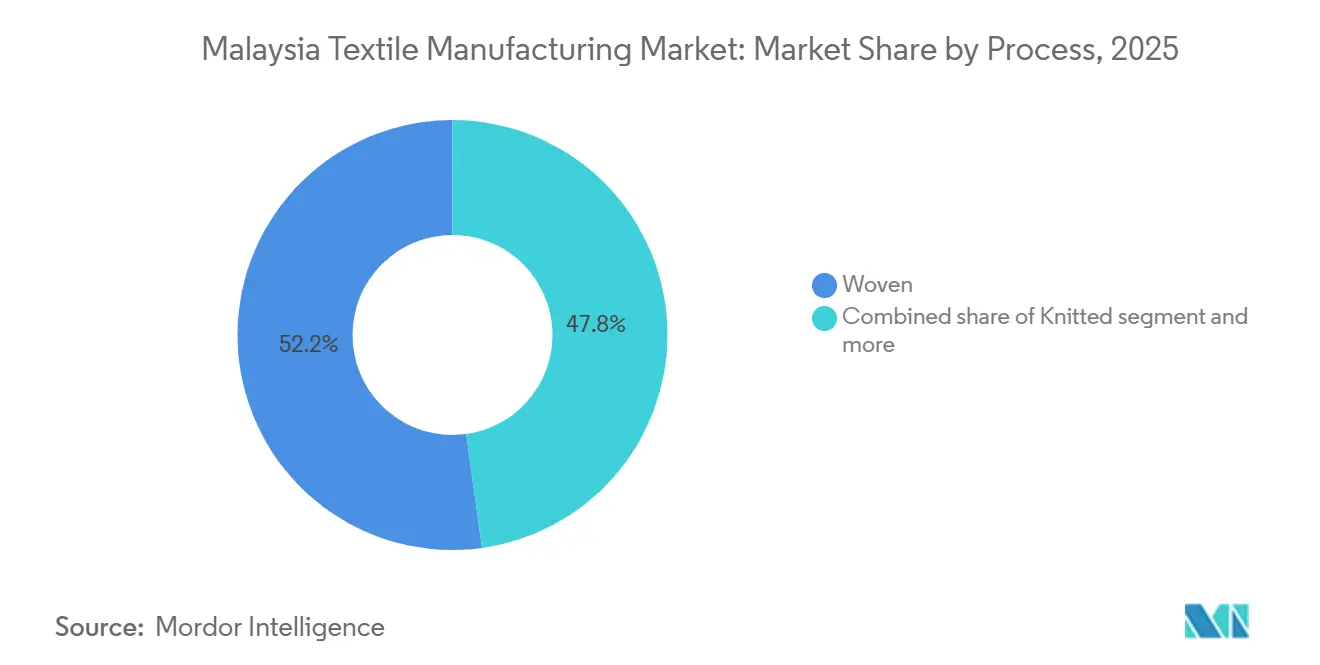
Non-Woven Gains on Hygiene and Medical ApplicationsWoven fabrics represented 52.19% of 2025 production, yet non-woven output is on track for a 6.37% CAGR, the fastest among processes, as healthcare systems renew PPE inventories. Spunbond and meltblown currently supply 60% of non-woven volume and see 6.8% annual growth, while needle-punched materials serve automotive acoustic insulation.
Knitted fabrics maintain a 28% share and grow 5.3% tied to e-commerce demand for small-batch jersey and rib constructions. Niche 3D weaving and spacer fabrics now stand at 2% but are climbing 6.9% annually, mirroring automakers’ shift toward breathable seat covers and mattress producers’ ergonomic designs.
Geography Analysis
Northern Malaysia delivered 39.97% of 2025 revenue and will continue as the growth leader with a 6.15% CAGR to 2031, largely because Penang’s tightly clustered mills can ship orders in under 10 days via Penang Port’s direct Europe and North America routes. Kedah’s industrial diversification, exemplified by a USD 750 million nitrile-butadiene latex complex, reinforces the regional ecosystem.
Central Malaysia followed with a 32% share and a slower 4.8% CAGR; its dyeing hubs were squeezed by electricity hikes that raised finishing costs. Selangor remains vital for design and logistics, yet some processors are relocating energy-intensive stages to Indonesia. Kuala Lumpur’s trading houses, including Chori, anchor sourcing but send weaving work to Johor and Penang to preserve margins.
Southern Malaysia held 18% of revenue in 2025 and is expanding 5.1% annually, benefiting from Singapore-linked re-export channels despite port delays that have nudged exporters toward Port Klang. East Coast and East Malaysia combined for an 11% share and a 4.2% CAGR, as infrastructure lags, although Tex Cycle Technology’s USD 25 million Sabah waste-valorization plant could spark a circular-fiber niche.
Regulatory Landscape
Malaysia's textile manufacturing operations operate under a mix of industrial licensing, investment-incentive screening, and environmental and product or quality compliance. Manufacturing licenses are required under the Industrial Co-ordination Act 1975 for qualifying firms (for example, companies with shareholders funds of RM2.5 million or more or employing 75 or more full-time paid employees), with applications and incentive requests routed through MIDA's InvestMalaysia platform. Investment approvals and promoted activities under frameworks such as the Promotion of Investments Act 1986 and Income Tax Act 1967 emphasize higher value-added output, and current investment guidelines embed sustainability expectations around waste management, water and energy consumption, and responsible raw-material selection.
On standards and environmental control, the Department of Standards Malaysia (JSM) oversees Malaysian Standards (MS) alignment, while the Department of Environment (DOE) issues sector-specific guidance for the textile and apparel industry, including expectations tied to wet processing and effluent management. Policy direction under NIMP 2030 positions textile, apparel, and footwear as a strategic manufacturing sector, reinforcing requirements and eligibility criteria that favor automation, resource efficiency, and traceability practices for exporters facing tightening transparency and recycled-content demands.
Value Chain Analysis
Malaysia's textile manufacturing value chain covers upstream primary textiles (polymerisation and fiber or yarn formation, spinning, weaving, knitting, and wet processing such as bleaching and dyeing), midstream made-up textiles, and downstream garmenting and accessories, with export-oriented logistics supported by established industrial corridors. Upstream feedstocks include natural and synthetic fibers (with polyester and polypropylene important for apparel blends and non-woven PPE substrates), supported by domestic and regional chemical inputs for dyes and auxiliaries, while energy cost exposure is most acute in wet processing and finishing where electricity and gas tariffs affect conversion economics.
Industry coordination and capability upgrading are supported by the Malaysian Textile Manufacturers Association (MTMA) as a national representative body covering multinationals, large local firms, and SMEs. Government-promoted products span natural and synthetic fibers, yarn, woven or knitted fabrics, non-wovens, specialized apparel, and technical or functional textiles, with the value chain geared toward higher value-added segments. Key bottlenecks highlighted in the operating environment include skilled labor constraints and cost pressure in dyeing and finishing, which has increased interest in automation and energy-efficiency solutions to protect lead times and export compliance performance.
Competitive Landscape
Competition inside the Malaysia textile manufacturing market remains moderately fragmented; the top 10 producers command roughly 35–40% of 2025 revenue. Vertically integrated structures dominate: Ramatex oversees spinning through garment assembly across multiple countries, whereas Penfabric achieved STeP by OEKO-TEX certification, securing European orders that prize transparent supply chains. Rising electricity and labor costs are prompting selective outsourcing of high-energy finishing to neighboring countries, pressuring the traditional full-integration model.
Technology adoption is a clear differentiator. Padini’s USD 2.5 million RFID rollout extends upstream to fabric suppliers, creating Digital Product Passport readiness and inventory accuracy that trims working capital needs. Ramatex’s 50 MW solar arrays lower energy costs and insulate operations from ICPT tariff shocks. Oceancash’s USD 10 million non-woven upgrade enables single-source three-ply mask production, reducing reliance on imported meltblown fabric and capturing PPE demand.
White-space opportunities include aramid and UHMWPE fiber production, still 100% import-dependent, and textile-waste recycling, where only 12% of 2024 waste was reclaimed. Tex Cycle Technology’s Sabah facility anchors this nascent segment and may attract apparel brands seeking recycled inputs. Firms that secure long-term supply agreements with e-commerce giants before platform sourcing shifts to Vietnam and Cambodia will lock in volume, mitigating commodity-fabric margin erosion.
Malaysia Textile Manufacturing Industry Leaders
-
Ramatex Textiles Industrial Sdn Bhd
-
Penfabric Sdn Berhad
-
D&Y Textile (Malaysia) Sdn Bhd
-
Esquel Malaysia Sdn Berhad
-
Asia Brands Berhad
- *Disclaimer: Major Players sorted in no particular order
Malaysia Textile Manufacturing Market Companies Covered in this Report
- Ramatex Textiles Industrial Sdn Bhd
- Penfabric Sdn Berhad
- D&Y Textile (Malaysia) Sdn Bhd
- Esquel Malaysia Sdn Berhad
- Asia Brands Berhad
- Kamunting Spinning Industries Sdn Bhd
- KIB Textiles Bhd
- Vicmark Fashion Sdn Bhd
- San Miguel Yamamura Woven Products Sdn Bhd
- Manwira Manufacturing Sdn Bhd
- Kima Sdn Bhd
- Oceanic Fabric Mill Sdn Bhd
- Maxim Textile Technology Sdn Bhd
- Hytex Integrated Bhd
- Padini Holdings Berhad
- Furniweb Holdings Ltd
- Batek Malaysia Berhad
- Usha Yarns (Malaysia)
- Titan Petrochemicals (M) Sdn Bhd
- Skreen Fabric (M) Sdn Bhd
- Choon Giap Knitting Ind. Sdn Bhd
Market Opportunities and Future Outlook
Incentive-linked upgrading creates room for mills that can document higher capital intensity, automation, and ESG outcomes, while expanding into higher value categories such as technical textiles, functional non-wovens, and traceable synthetic and recycled yarns. The National Investment Framework (NIF), introduced in Malaysia's National Budget 2026, shifts manufacturing incentives toward an outcome-based, tiered approach tied to metrics such as capital investment per employee and ESG practices. That structure pushes project pipelines toward energy-efficient machinery, digital monitoring, and resource-saving wet processing.
This direction also maps to NIMP 2030's sector positioning for textile, apparel, and footwear, which emphasizes sustainability, advanced manufacturing, and circular economy practices rather than commodity-only output. Export-facing compliance and cost competitiveness further support opportunities around measurable energy and water reductions, given that finishing and dyeing are among the most energy-intensive steps and have been directly affected by tariff adjustments. On the demand side, industrial and technical textiles (including PPE-related non-wovens and automotive interior textiles) offer margin resilience versus basic apparel fabrics, while circular inputs and recycled fiber integration support buyer expectations for transparency and material provenance. Digitalization initiatives, such as IoT-based energy optimization and traceability systems, can be paired with incentive criteria and buyer audits to reinforce Malaysia-based sourcing for regional e-commerce supply chains and premium export programs.
Recent Industry Developments in Malaysia Textile Manufacturing Market
- February 2026: Penfabric Sdn Berhad signed an MoU with Hitachi Sunway Information Systems Sdn Bhd to implement energy-efficiency solutions. The collaboration supports cost control in energy-intensive textile operations and strengthens compliance narratives around greener manufacturing for export customers.
- July 2025: Industrial electricity tariffs increased to 45.40 sen/kWh under Malaysia's ICPT mechanism, tightening margins for dyeing and finishing operations. The step-up accelerated interest in on-site renewables and energy-saving retrofits, particularly for processors exposed to utility-driven cost volatility.
- May 2024: Tex Cycle Technology committed USD 25 million to Sabah's first integrated scheduled-waste facility focused on fiber-to-fiber recycling. The investment adds domestic circularity infrastructure that can supply recycled inputs and reduce waste-disposal risk for textile manufacturers, including wet-processing players.
Malaysia Textile Manufacturing Market Report Scope and Research Methodology
Market Definition and Coverage
For this study, the Malaysia textile manufacturing market is defined as the value of textile and garment manufacturing activity carried out in Malaysia, covering conversion from fiber to finished textile outputs and associated manufacturing processes.
Scope exclusions: retail textile and apparel sales, pure trading and distribution margins, and second-hand textile flows are not counted in this market value.
Segments Covered in This Report
- By Application
- Fashion & Apparel
- Industrial/Technical Textiles
- Household & Home Textiles
- Medical & Healthcare Textiles
- Automotive & Transport Textiles
- Others (Protective, Sports Textiles, etc.)
- By Raw Material
- Natural Fibers
- Cotton
- Wool
- Silk
- Synthetic Fibers
- Polyester
- Nylon
- Rayon / Viscose
- Acrylic
- Polypropylene
- Recycled Fibers
- Others (Speciality High-Performance Fibers (Aramid, Carbon, UHMWPE))
- Natural Fibers
- By Process / Technology
- Woven
- Knitted
- Non-woven
- Spunlaid (Spunbond / Melt-blown)
- Dry-laid Hydro-entangled
- Wet-Laid
- Needle-punched
- 3-D Weaving & Spacer Fabrics
- By Geography
- Northern (Penang, Kedah, Perlis, and Perak)
- Central (Selangor, Kuala Lumpur, Negeri Sembilan, and Putrajaya)
- Southern (Johor, Melaka)
- East Coast (Kelantan, Terengganu, Pahang, and Labuan)
- East Malaysia (Sabah, Sarawak)
Data Sources, Market Sizing, and Validation
Desk Research
Desk research is used to set the factual backbone for the model, so the sizing starts from what can be independently observed about Malaysia manufacturing activity, trade patterns, and sector health. Typically, the work reviews official statistics and reference series such as Malaysia External Trade Development Corporation trade releases, Department of Statistics Malaysia manufacturing indicators, International Trade Centre trade maps, UN Comtrade customs series, and World Bank macro and FX series, followed by relevant policy notes from Malaysian agencies.
To make the numbers practical, company annual reports, investor presentations, and public announcements are also reviewed to understand product mix, utilization signals, and expansion plans that can move output value. When needed, a paid subscription that aggregates company financials, news, and patent filings is used to reduce manual gaps and to cross-check timelines. These desk sources are illustrative only, and many other public sources were also used for data collection, validation, and clarification.
Primary Interviews and Surveys
Primary work is used to test assumptions that desk sources do not explain well, such as typical product mix shifts, export order visibility, and how pricing changes flow through contracts. We speak with manufacturers, machinery and process experts, and downstream buyers across Malaysia, and we re-check inputs when there are conflicting signals between output, trade, and pricing direction.
Distribution of primary research fieldwork respondents
| Company type | Respondent position |
|---|---|
| Top tier: 32% | CXOs: 12% |
| Mid tier: 51% | Functional/Unit leaders: 28% |
| Smaller Players: 17% | Managers: 60% |
Market-Sizing & Forecasting
Sizing begins with a top-down reconstruction that ties Malaysia textile manufacturing value to observable manufacturing and trade signals, and then to process-level activity such as spinning, weaving or knitting, and finishing, followed by garment manufacturing where it applies. Once the demand pool is built, selective bottom-up checks are run using sampled company revenue signals, capacity additions, and typical price per unit output proxies, so the totals can be adjusted when the first pass looks stretched.
A few inputs that materially shape the model include textile and apparel export and import values, the mix movement between fiber, yarn, fabric, and garments, manufacturing output indicators, capacity utilization commentary from interviews, and USD-MYR conversion timing for the base year. For the forecast, scenario analysis is used so the model can reflect different paths for export demand, cost inflation, and utilization recovery that were discussed in expert calls. A central case is then selected based on the most repeated assumptions. When bottom-up information is missing for smaller facilities, the gap is handled through proportioning based on trade exposure and process mix, and then checked back against the macro and industry totals.
Data Validation & Update Cycle
Model outputs are cross-checked against independent signals such as trade values, manufacturing output direction, and the implied price and volume movement for key textile categories. If a jump looks too large for the year, the assumptions are revisited, and follow-up calls are triggered to confirm whether the change is driven by mix, pricing, or a one-time shock.
Before sign-off, the work goes through step-by-step analyst reviews, including variance checks across segments, currency consistency checks, and reasonableness checks versus recent expansion and utilization narratives. Reports are refreshed annually, and interim updates are made when material events occur. A final fresh pass is done right before delivery so clients receive the latest view.
Mordor Intelligence's Malaysia Textile Manufacturing Industry Study Market Size Versus Other Published Estimates
Published estimates for Malaysia textile manufacturing often do not match because the market can be defined from different angles, and the choice changes what gets counted as value. Differences usually come from whether apparel is bundled with textiles, how trade is treated versus domestic output, and how exchange rates and inflation are carried through the base year.
Some sources also mix a broader lifestyle category into the total, which can pull in adjacent items and make growth look smoother than what manufacturing and trade data show. In Mordor Intelligence modeling, value is counted only for Malaysia textile and garment manufacturing activity across processes like spinning, fabric making, wet processing, and garment manufacturing, and then validated against trade and production signals before forecasting.
Benchmark comparison
| Source | Market Size | Gaps in Research Methodology |
|---|---|---|
| Mordor Intelligence | USD 3.67 B (2026) | |
| Industry Data Portal A | USD 3.49 B (2025) | This estimate is presented in a broader lifestyle context, and the scope narrative indicates apparel and related categories can be bundled, which can shift the counted value versus pure manufacturing output. |
| Market Publisher B | USD 3.20 B (2024) | This figure uses an earlier base year and a different segmentation lens focused on apparel and home textiles, which can undercount upstream process activity and also changes the FX timing used for USD conversion. |
Taken together, the spread is mainly explained by scope definition, base year choice, and what is treated as manufacturing value versus adjacent categories. By keeping the model tied to process coverage and cross-checking it with trade and production indicators, the final number stays easier to reproduce and to stress-test when assumptions change.
Key Questions Answered in the Report
How large is the Malaysia textile manufacturing market in 2026?
The Malaysia textile manufacturing market size stands at USD 3.67 billion in 2026 and is projected to reach USD 4.71 billion by 2031.
Which application segment is growing the fastest?
Industrial and technical textiles lead growth with a 6.54% CAGR through 2031, driven by PPE and automotive interior demand.
Why is polyester usage rising in Malaysian mills?
Polyester gains from lower cost versus cotton and from European regulations that favor recycled PET, pushing its 6.89% CAGR to 2031.
Which region contributes most to Malaysian textile output?
Northern Malaysia, anchored by Penang and Kedah, supplied 39.97% of 2025 revenue and will grow at a 6.15% CAGR to 2031.
How are energy costs affecting manufacturers?
A 13.6% electricity tariff hike in July 2025 increased dyeing costs, prompting investments in solar power and energy-efficient equipment.