
Market Overview
| Study Period | 2021 - 2031 |
|---|---|
| Market Size (2026) | USD 312.36 Billion |
| Market Size (2031) | USD 432.58 Billion |
| Growth Rate (2026 - 2031) | 6.72 % |
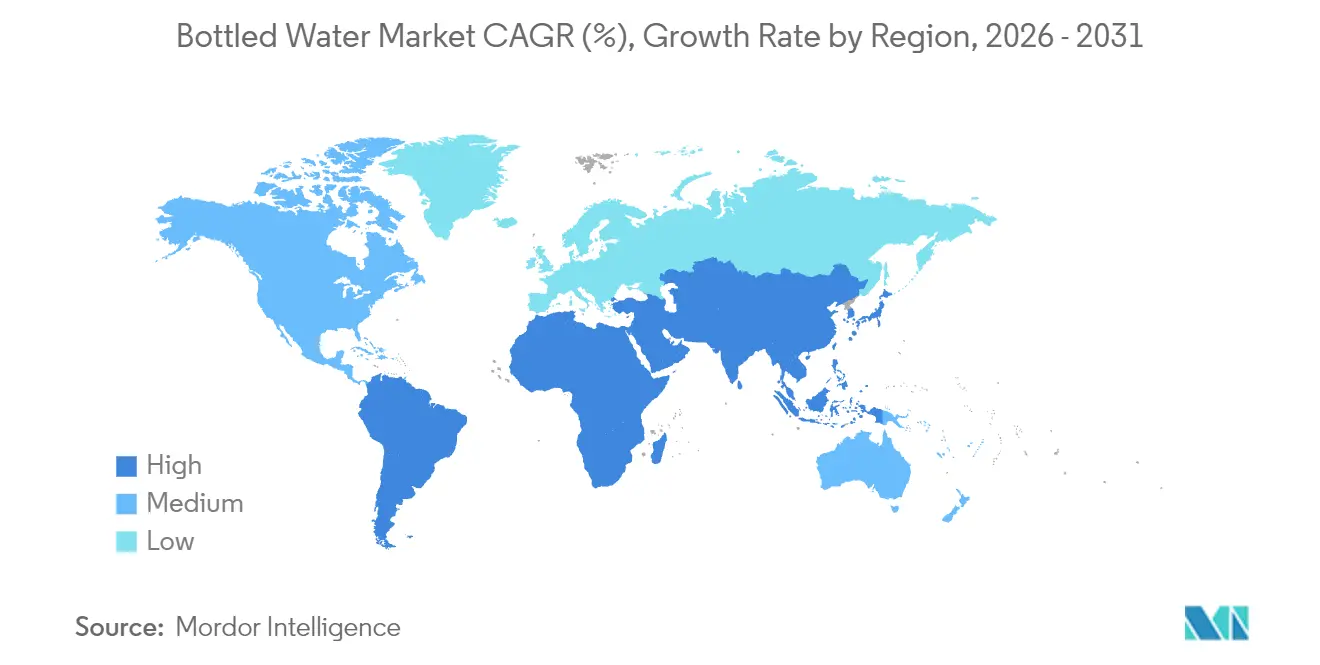
| Fastest Growing Market | South America |
| Largest Market | North America |
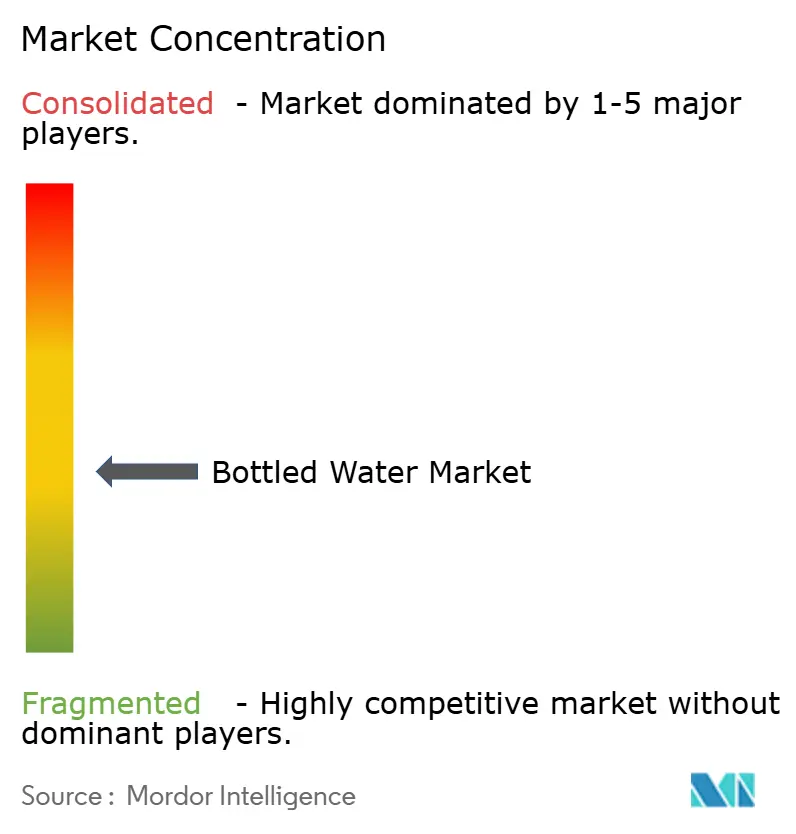
| Market Concentration | Medium |
Major Players *Disclaimer: Major Players sorted in no particular order Image © Mordor Intelligence. Reuse requires attribution under CC BY 4.0. | |
Bottled Water Market Analysis by Mordor Intelligence
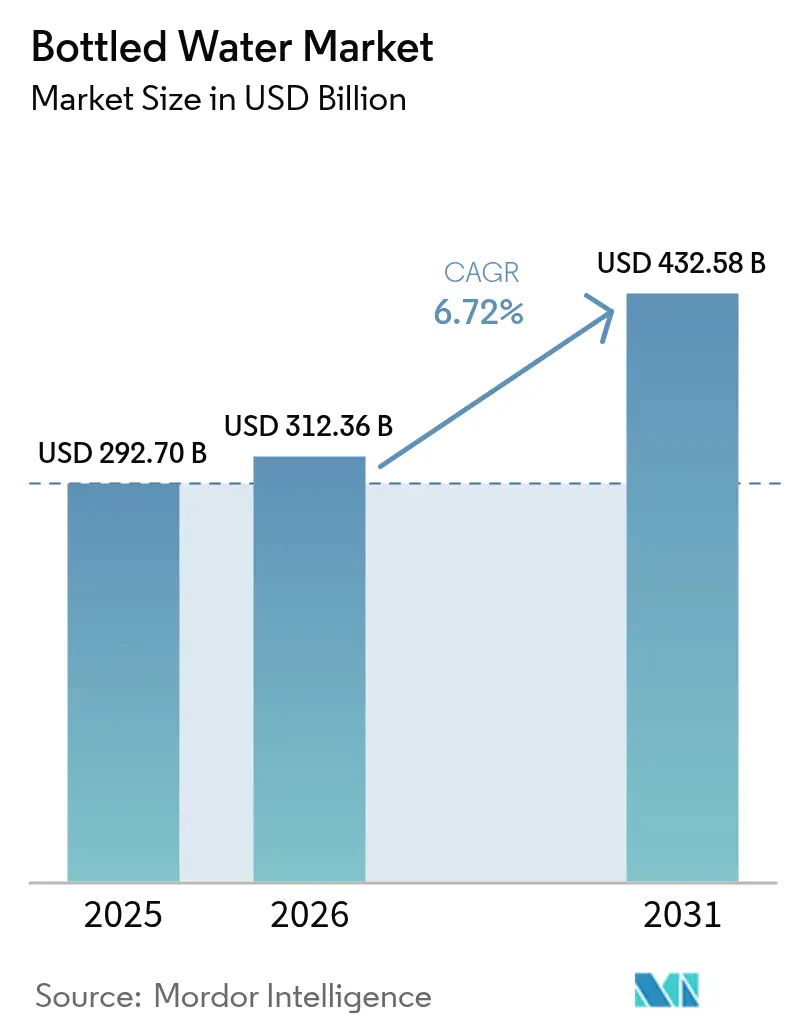
The bottled water market size is expected to grow from USD 292.7 billion in 2025 to USD 312.36 billion in 2026 and is forecast to reach USD 432.58 billion by 2031 at 6.72% CAGR over 2026-2031. As regulators clamp down on single-use plastics, industry players are turning to premiumization strategies, successfully elevating average selling prices. Consumers, increasingly prioritizing wellness, hydration, and brand narratives, are driving up the category's value. Meanwhile, technological advancements in purification and packaging are helping to counterbalance the rising costs of compliance. Major players in the bottled water industry are ramping up mergers, forging partnerships, and investing in recycled materials, all in a bid to navigate cost pressures and safeguard their reputations in the bottled water industry. Yet, local and regional contenders are making their mark, leveraging artisanal branding and strategic channel placements. As a result, the bottled water market is transitioning from mere convenience to a holistic focus on health, sustainability, and brand experience within the bottled water market.
Key Report Takeaways
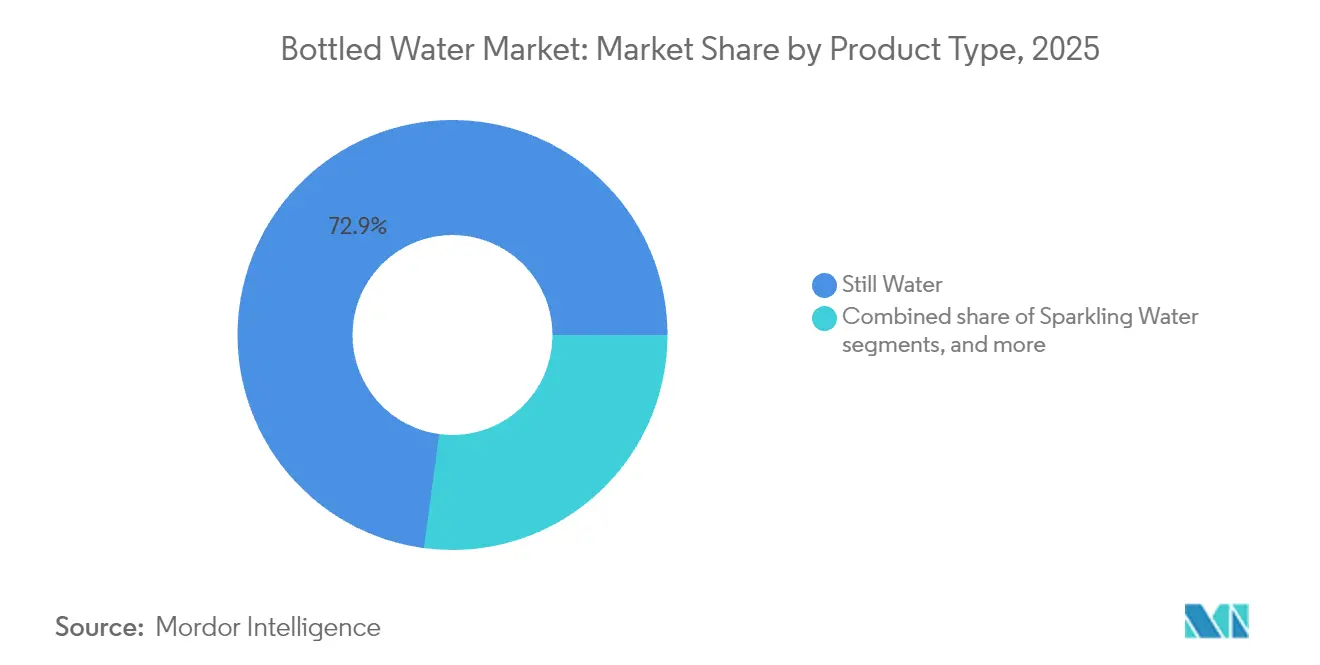
- By product type, still water held 72.88% of the bottled water market share in 2025, whereas functional and flavored waters are expanding at an 8.12% CAGR through 2031 in the bottled water market.
- By packaging material, PET retained 61.05% share of the bottled water market size in 2025, yet glass bottles are growing at 8.74% CAGR thanks to sustainability-led premium positioning in the bottled water industry.
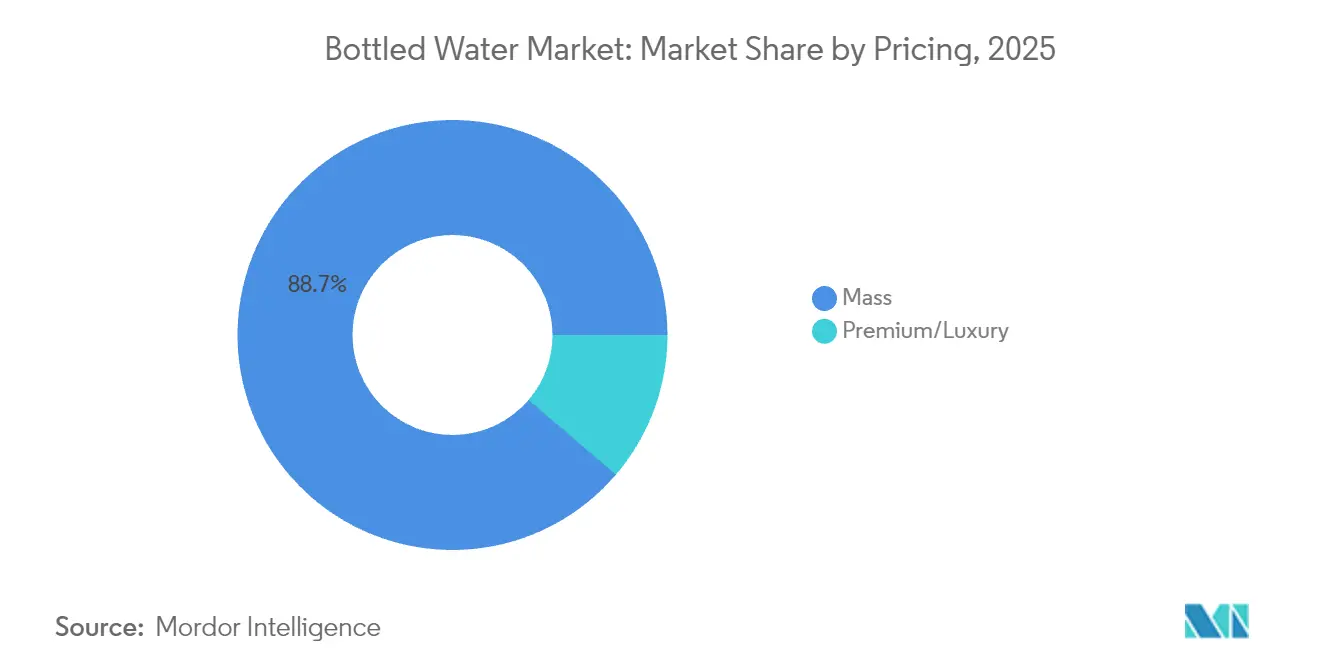
- By pricing tier, mass offerings captured 88.74% of the bottled water market size in 2025, while premium and luxury lines are advancing at a 9.27% CAGR.
- By distribution channel, off-trade accounted for 63.65% of sales in 2025; on-trade is the fastest mover with a 7.10% CAGR as hospitality rebounds.
- By geography, North America led with 28.11% bottled water market share in 2025, whereas South America posts the highest regional CAGR at 9.88% to 2031.
Note: Market size and forecast figures in this report are generated using Mordor Intelligence’s proprietary estimation framework, updated with the latest available data and insights as of 2026.
Market Trends and Insights
Drivers Impact Analysis of Bottled Water Market*
| Driver | (~) % Impact on CAGR Forecast | Geographic Relevance | Impact Timeline |
|---|---|---|---|
| Premiumisation and "permissible indulgence" positioning | +1.2% | Global, with premium focus in North America and Europe | Medium term (2-4 years) |
| Innovative packaging solutions for convenience and environmental impact | +0.8% | Europe and North America leading, Asia Pacific adoption | Long term (≥ 4 years) |
| Growing on-the-go hydration in emerging megacities | +1.5% | Asia-Pacific and South America urban centers | Short term (≤ 2 years) |
| Adoption of advanced purification and bottling technologies | +0.6% | Global, with technology hubs in developed markets | Medium term (2-4 years) |
| Deep-aquifer sourcing in water-stressed regions | +0.9% | Middle East and Africa, parts of Asia Pacific | Long term (≥ 4 years) |
| Expansion of the tourism and hospitality sector | +0.7% | Global, concentrated in tourism-dependent economies | Medium term (2-4 years) |
| Source: Mordor Intelligence | |||


Premiumization and "Permissible Indulgence" positioning
Shifts in consumer psychology have transformed bottled water purchases from mere necessities to choices driven by wellness-oriented lifestyles. This evolution has granted brands pricing power, challenging the norms of traditional commodity markets. In 2023, Nongfu Spring showcased this trend, raking in RMB 42.67 billion (USD 5.8 billion) in revenue. Despite facing a nationalist backlash, the company leveraged a premium positioning strategy for its natural spring water products. The concept of "permissible indulgence" plays a pivotal role, allowing consumers to view their premium water purchases as investments in health rather than mere luxuries. This shift in perception empowers brands to set prices 200-400% higher than mass-market counterparts, all while enjoying consistent volume growth. Categories like electrolyte-enhanced and vitamin-fortified waters are riding this wave, presenting clear health benefits that validate their premium pricing. This approach finds particular resonance in developed markets, where higher disposable incomes make discretionary spending on health perceptions more feasible in the bottled water market.
Innovative packaging solutions for convenience and environmental impact
In response to regulatory pressures and growing consumer concerns about the environment, the packaging industry is turning to innovation. Technological breakthroughs are not only helping companies meet sustainability standards but also offering them a chance to stand out in the market. A notable leap forward came in November 2024, when Suntory unveiled the world's first commercial PET bottles made from bio-paraxylene, sourced from used cooking oil. This move, as highlighted by the Suntory Group, aims to produce 45 million beverage PET bottles each year and promises a reduction in CO2 emissions when compared to traditional petroleum-based materials[1]Source: Suntory Holdings, “Bio-Paraxylene PET Bottle Launch,” suntory.com. Meanwhile, the European Union is tightening its grip on plastic use. Their Single-Use Plastics Directive requires PET bottles to contain 25% recycled content by 2025, increasing to 30% by 2030. Such mandates are pushing companies across the value chain to ramp up their innovation investments, a sentiment echoed by the European Commission. On the technology front, KHS Freshsafe's PET Plasmax glass coating is making waves. It offers a hybrid solution, ensuring PET remains recyclable while boasting premium glass-like barrier properties. In South Korea, a legislative move is reshaping the market. By 2026, external labels on bottled water will be banned, a shift that's propelling the adoption of labelless bottle technologies. This change, as noted by Domino Printing Sciences, could potentially wipe out 24.6 million tonnes of plastic waste annually in the bottled water industry.
Growing on-the-go hydration in emerging megacities
In emerging bottled water markets, urbanization is reshaping demand for packaged hydration solutions. As infrastructure struggles to keep pace and lifestyles evolve, consumption of bottled water surges. Take Lagos, Nigeria: its booming population grapples with water scarcity, leaning more on bottled solutions, even as the Lagos State Water Corporation strives to meet the city's water demands (Wiley Online Library). Meanwhile, in Pakistan, urban dwellers are set to double from 81 million in 2022 to 160 million by 2050. Alarmingly, 43% currently lack access to safe water, underscoring a persistent demand for bottled solutions (Pakistan Institute of Development Economics)[2]Source: Pakistan Institute of Development Economics, “Pakistan’s Urban Water Challenges,” pide.org.pk. In megacities, where daily commutes stretch beyond two hours, traditional hydration methods falter, pushing residents towards on-the-go consumption. China's beverage landscape mirrors this trend, with a growing preference for healthier hydration aligning with urban lifestyles. The rise of mobile commerce and delivery services further fuels this shift, making bulk purchases easier and more appealing across the bottled water industry.
Adoption of advanced purification and bottling technologies
As technological advancements reshape water treatment, they carve out competitive edges and address quality concerns, particularly in premium market segments. The use of nanomaterials, such as graphene, carbon nanotubes, and titanium dioxide, is pioneering a new frontier in water purification, boasting superior capabilities in removing heavy metals, organic pollutants, and pathogens. In India, the bottled water sector showcases a clear divide in technology adoption: larger firms swiftly embrace advanced reverse osmosis and ozonation systems, while their smaller counterparts, constrained by costs, stick to simpler methods. This disparity results in noticeable quality differences across bottled water market segments. The Bureau of Indian Standards (BIS) plays a pivotal role, shaping technology adoption through compliance mandates that lean towards advanced treatment methods. Brands leverage UV treatment, ozonation, and multi-stage filtration systems to tout superior purity, justifying their premium pricing. Furthermore, the integration of automation and IoT in bottling not only curtails contamination risks but also boosts operational efficiency, offering cost benefits that enhance competitive standing in a price-sensitive bottled water market.
Restraints Impact Analysis of Bottled Water Market*
| Restraint | (~) % Impact on CAGR Forecast | Geographic Relevance | Impact Timeline |
|---|---|---|---|
| Microplastic and nanoplastic health concerns | -0.8% | Global, with heightened awareness in developed markets | Short term (≤ 2 years) |
| Anti-single-use-plastic legislation momentum | -1.1% | Europe leading, spreading to other regions | Medium term (2-4 years) |
| Carbon-footprint labelling and scope-3 scrutiny | -0.6% | North America and Europe, expanding globally | Long term (≥ 4 years) |
| Strict government bans and penalties | -0.9% | Regional variations, with Europe most restrictive | Short term (≤ 2 years) |
| Source: Mordor Intelligence | |||
Microplastic and nano plastic health concerns
Scientific research revealing widespread microplastic contamination in bottled water poses challenges to consumer confidence and invites regulatory scrutiny, jeopardizing market fundamentals. Research from the National Institutes of Health (NIH) highlights that bottled water harbors an average of 240,000 plastic particles per liter, predominantly in the form of nanoplastics. Notably, 90% of these detected particles are identified as polyamide and polyethylene terephthalate (PET)[3]Source: National Institutes of Health, “Plastic Particles in Bottled Water,” nih.gov. In August 2024, the FDA launched a webpage addressing micro- and nanoplastics, confirming their presence in various foods, including bottled water. However, the FDA noted a lack of conclusive evidence linking these particles to health risks, introducing a layer of regulatory ambiguity that could sway industry investment choices, as highlighted by the Food Packaging Forum. Major brands are facing class action lawsuits, accused of misleading advertising concerning microplastic content. Courts have permitted these cases to advance, focusing on claims of consumer deception rather than substantiated health risk evidence. The International Bottled Water Association (IBWA) is under mounting pressure to tackle these contamination issues, advocating for heightened bottled water industry standards and rigorous testing protocols. Environmental groups, through consumer awareness campaigns, are amplifying concerns over health implications, potentially steering consumers towards pricier alternatives within the bottled water industry like different packaging materials or advanced filtration systems in the bottled water market.
Anti-single-use-plastic legislation momentum
Regulatory momentum against single-use plastics is reshaping the bottled water industry, imposing compliance costs and market access hurdles. The European Parliament's recent endorsement of deposit return system regulations mandates a 90% collection rate for single-use bottles by 2029. These regulations, as highlighted by eEuropa, introduce mandatory deposit schemes, complicating operations and skewing cost structures in favor of larger market players[4]Source: European Commission, “Single-Use Plastics Directive,” europa.eu. Meanwhile, California's Low Carbon Fuel Standard regulations, overseen by the California Air Resources Board, are tightening carbon intensity benchmarks. This shift is impacting transportation costs for bottled water distribution. Additionally, the EU's impending ban on BPA in food-contact materials is set to phase out polycarbonate water coolers by January 2029. This move compels manufacturers to pivot to alternative materials like PET, all while navigating transition costs and potential supply chain disruptions. However, the landscape is further complicated by inconsistent regulatory implementation across EU member states. Divergent measurement methods and penalty structures lead to uneven competitive conditions, while regional regulatory fragmentation demands tailored approaches, curbing economies of scale and inflating operational costs in the bottled water industry.
*Our forecasts treat driver/restraint impacts as directional, not additive. The impact forecasts reflect baseline growth, mix effects, and variable interactions.
Bottled Water Market Segment Analysis
By Product Type:
Functional Waters Drive Premium MigrationIn 2025, still water commands a dominant 72.88% share of the bottled water market, underscoring entrenched consumer preferences and a robust distribution network. Meanwhile, the functional and flavored water segments are on an upward trajectory, boasting an 8.12% CAGR projected through 2031. This shift underscores a notable evolution in hydration consumption patterns. The pivot towards premium water products highlights successful strategies that elevate basic hydration to wellness-centric lifestyle choices. Sparkling water enjoys consistent growth, buoyed by trends in natural carbonation and its role as a mixer. Concurrently, the functional waters segment diversifies, branching into vitamin-enhanced, electrolyte sports, and botanical fruit-infused categories, each catering to distinct health objectives.
Vitamin-enhanced waters tap into the supplement market, providing a convenient nutrient boost. This appeals to health-conscious consumers who desire more than just hydration. Waters infused with electrolytes and marketed for sports are riding the wave of an expanding fitness culture. Urban markets, with their bustling gym memberships and outdoor activities, showcase a pronounced demand for these specialized hydration solutions. Meanwhile, botanical and fruit-infused waters strike a balance, catering to flavor enthusiasts while upholding a health-centric image. They steer clear of artificial additives, a concern for many in the wellness community. Insights from consumer perception studies, as highlighted by the SupplySide Food & Beverage Journal, reveal that functional waters command premium pricing. This is largely due to their perceived tangible health benefits, granting them a sustainable edge over traditional commodity alternatives in the bottled water industry.


By Packaging Material:
Glass Bottles Surge Despite PET DominanceIn 2025, PET bottles dominate the bottled water market with a 61.05% share, thanks to their cost advantages and established recycling infrastructure. Meanwhile, glass bottles are on the rise, boasting a 8.74% CAGR, fueled by growing sustainability concerns and a push for premium positioning. This shift in packaging underscores consumers' readiness to pay a premium for perceived environmental benefits and enhanced product protection. Aluminum cans and bottles are carving out a niche, especially in sparkling water and functional beverages, where their metallic allure boosts brand differentiation and shelf visibility. Glass packaging, while commanding a premium price, offers full recyclability and chemical inertness, traits that resonate with health-conscious consumers wary of plastic migration.
However, the heavier weight of glass poses transportation cost hurdles, challenging distribution efficiency. Yet, premium brands adeptly counterbalance these costs with elevated margins and strategic market positioning. Innovations in PET, such as bio-based materials and cutting-edge barrier coatings, are striving to close the sustainability gap without sacrificing cost competitiveness, as highlighted by the Suntory Group. The EU's recycled content mandates, emphasizing a 25% recycled content by 2025, are not just pushing PET technology advancements but are also reshaping supply chains, a sentiment echoed by the European Commission. Meanwhile, alternative packaging materials like plant-based plastics and hybrid solutions are emerging as potential game-changers, though their commercial success is currently hampered by cost and performance challenges across the bottled water market.
By Pricing:
Premium Segment Outpaces Mass Market GrowthIn 2025, mass market pricing commands an impressive 88.74% bottled water market share, driven by volume strategies targeting price-sensitive consumers. Meanwhile, premium and luxury categories, with a notable 9.27% CAGR, harness successful differentiation strategies to cultivate sustainable pricing power. This pricing divide underscores a maturing market: while commodity competition exerts margin pressures, premium positioning capitalizes on brand equity and perceived benefits. Premium brands, by emphasizing sourcing narratives, innovative packaging, and tangible benefits, justify price premiums ranging from 200% to 400% over their mass market counterparts.
Luxury water brands find favor among affluent consumers and in hospitality settings, where diminished price sensitivity and heightened status signaling drive purchases. These brands employ limited distribution tactics to uphold exclusivity, allowing them to command impressive margins that fuel marketing and brand-building endeavors. Meanwhile, the mass market faces intensified competition from expanding private labels and aggressive promotional pricing. This dynamic exerts pressure on mid-tier brands struggling with differentiation. Nongfu Spring's journey underscores the strength of premium positioning; the brand not only weathered a nationalist backlash but also sustained revenue growth, thanks to its commitment to superior product quality and brand equity. Furthermore, an analysis of economic sensitivities reveals that premium segments exhibit a resilience to recessions, offering a stabilizing force for portfolios during economic slumps within the bottled water industry.
By Distribution Channel:
On-Trade Growth Accelerates Post-PandemicIn 2025, off-trade channels capture a dominant 63.65% bottled water market share, leveraging retail convenience and competitive pricing. Meanwhile, on-trade segments, buoyed by a recovering hospitality sector and premiumization trends, achieve a robust 7.10% CAGR in food service applications. This distribution evolution mirrors shifting consumption patterns: convenience retail leads in volume, while hospitality channels excel in margins and brand-building. Supermarkets and hypermarkets serve as broad market access points and promotional platforms, whereas convenience and grocery stores cater to impulse buying with immediate purchase opportunities.
The on-trade's growth surge is fueled by a recovering hospitality sector and a booming tourism industry, presenting lucrative high-margin prospects for premium brands. Hotels, restaurants, and entertainment venues command premium pricing, thanks to convenience and limited competition, while simultaneously enhancing brand visibility that sways retail consumer preferences. E-commerce platforms and subscription models bolster home and office delivery services, capitalizing on convenience premiums and fostering customer loyalty. Online retail channels, propelled by direct-to-consumer tactics and marketplace engagement, face hurdles like logistics costs and packaging demands for liquid products. This channel evolution underscores the necessity for brands to adopt omnichannel strategies, striking a balance between margin optimization and expansive market access across varied consumer touchpoints in the bottled water industry.
Geography Analysis
North America Bottled Water Market
In 2025, North America commands a dominant 28.11% share of the bottled water market, leveraging its established infrastructure and premium consumption habits. The region's advanced logistics and extensive rPET collection networks cater to a growing consumer preference for functional hydration. Retailers are allocating significant shelf space to electrolyte, alkaline, and flavored water extensions, which command higher price points. Furthermore, deposit-return schemes across several states have boosted recycling rates to over 70%, according to the U.S. Environmental Protection Agency. However, with California and Washington tightening recycled content mandates, there's a looming concern: these regulations could elevate costs for traditional PET formats. Meanwhile, grocery chains are intensifying competition by rolling out organic-focused private labels, putting pressure on mid-tier national brands in the bottled water industry.
South America Bottled Water Market
South America is on the fast track, boasting the highest CAGR at 9.88%. Swift urbanization, infrastructure challenges, and a rise in disposable incomes fuel this surge. In Brazil's megacities, sporadic municipal water quality concerns have led middle-class families to view packaged water as a necessity. While government water-public-partnership initiatives promise to address long-term water scarcity, immediate reliability issues are driving consumers towards multi-pack purchases. In Chile and Colombia, a trend towards premiumization is evident, spurred by health-conscious lifestyles and an influx of tourists favoring glass or recycled-content PET. Although regional production is fragmented, there's a noticeable trend of consolidation as multinational bottlers snap up artisanal brands to gain rights to local aquifers within the bottled water industry.
APAC and MEA Bottled Water Market
Asia-Pacific, while a major player in global bottled water consumption, showcases vast disparities in purchasing power and regulatory rigor. Urban consumers in China are gravitating towards premium mineral water. In contrast, India's bottled water sector grapples with inconsistent enforcement of BIS standards, influencing technology investments. Distribution challenges arise in Indonesia due to its archipelagic nature, leading to a rise in refill-station formats alongside conventional PET retail. In the Middle East and parts of Africa, deep-aquifer sourcing caters to high-margin desert tourism and expatriates. Yet, political instability and logistical challenges hinder consistent market growth. These regional nuances highlight the importance of localized production, tailored supply strategies, and proactive regulatory engagement for sustained market expansion.

Regulatory Landscape
Bottled water is regulated as a food and packaged drinking-water product, with overlapping requirements covering source protection, treatment controls, and microbiological and chemical criteria. In the United States, the FDA framework under 21 CFR Part 129 (good manufacturing practices) and 21 CFR Part 165 (standards of quality, including testing for total coliform and E. coli) continues to anchor compliance programs, with regulatory attention also expanding to emerging contaminants such as PFAS, aligned with U.S. drinking-water standards.
In Europe, Directive (EU) 2020/2184 increases scrutiny on water-quality parameters and risk-based monitoring, and Member States were required to communicate outcomes of their assessments to the European Commission by 12 January 2026. National transpositions continue to refine bottled water rules, including Ireland's S.I. No. 204/2025, which further implements aspects of Directive (EU) 2020/2184 for waters sold in bottles or containers, with updates to parameters and sampling provisions. For cross-border trade, manufacturers and importers also use reference points such as Codex Alimentarius (Codex General Standard for Bottled/Packaged Drinking Waters) and technical regional regulations, including the EAEU TR 044/2017, to structure specifications, lab testing, and labeling dossiers.
Competitive Landscape
Five global giants, Nestlé, Danone, The Coca-Cola Company, PepsiCo, and Nongfu Spring, dominate the bottled water market, which remains moderately fragmented. Nestlé is reshaping its portfolio, shifting investments from commodity PET water to higher-margin categories. Recent asset reviews indicate a strategic pivot towards functional beverages that resonate with a wellness identity. In North America, Danone and Coca-Cola have joined forces, with Danone trading brand equity for enhanced distribution efficiency of Evian. Meanwhile, Coca-Cola is harnessing its manufacturing scale to boost the rollout of recycled PET and expedite carbon-footprint reductions across its flagship products in the bottled water market.
In 2024, BlueTriton and Primo Water united, creating a USD 6.5 billion North American hydration powerhouse. Their strategy focuses on cost synergies through shared bottling and logistics, alongside a unified approach to sustainability reporting. Suntory, in Japan and Southeast Asia, is leading the charge in bio-based PET commercialization on an industrial scale. This positions Suntory not just as a market player but as a technology and sustainability frontrunner, poised to license its expertise to regional collaborators. Meanwhile, smaller regional bottlers are carving out their niche, securing protected source areas upstream and leveraging e-commerce micro-fulfillment downstream. Their artisanal sourcing be it Alpine, volcanic, or rainforest resonates with eco-conscious consumers and discerning hospitality buyers who value authenticity.
Technology stands as a pivotal competitive edge in the industry. Players are enhancing quality assurance and marketing claims by adopting nanofiltration, UV-C sterilization, and real-time IoT monitoring. Packaging innovations, from labelless bottles and attached caps to renewable resin blends, vie for attention alongside flavor innovations. As Gen Z shifts media consumption, marketing budgets are pivoting from traditional television to digital storytelling and influencer collaborations. Looking ahead, market players will need to harmonize regulatory requirements with consumer desires. By emphasizing circular packaging, validated carbon reductions, and health-centric formulations, they aim to bolster their foothold in the bottled water arena and strengthen the bottled water industry.
Bottled Water Industry Leaders
Danone S.A.
PepsiCo Inc.
The Coca-Cola Company
Nestle SA
Nongfu Spring Co. Ltd
- *Disclaimer: Major Players sorted in no particular order
Bottled Water Market Companies Covered in this Report
- Nestle SA
- Danone SA
- The Coca-Cola Company
- PepsiCo Inc.
- Nongfu Spring Co. Ltd
- Suntory Holdings Ltd
- BlueTriton Brands Inc.
- Fiji Water Company LLC
- Bisleri International Pvt Ltd
- VOSS of Norway ASA
- Hint Inc
- JUST Goods, Inc.(Just Water)
- Wahaha Group Co. Ltd
- CENTR Brands Corporation (Centr)
- Disruptive Beverages Inc. (Ayala's Herbal Water)
- Keurig Dr. Pepper ( Bai, Core Hydration)
- Crag Spring Water
- Callaway Blue Spring Water
- Vitamin Well
- Saratoga Springs Water

Market Opportunities and Future Outlook
Capacity additions and modernization programs are concentrating near large demand centers to reduce logistics costs and protect service levels for high-velocity SKUs. In April 2026, Niagara Bottling announced a USD 160 million manufacturing and warehousing facility in Fulton County, New York (targeting operations in early 2027), reinforcing continued investment in North American production footprints as packaging and compliance requirements tighten. In July 2026, Suntory PepsiCo inaugurated a USD 300 million plant in Tay Ninh, Vietnam, with annual capacity of about 1.244 billion liters, highlighting the role of large, automated facilities in scaling still and branded waters across Asia-Pacific.
Sustainability-driven shifts are also widening in packaging and distribution models that reduce single-use plastic exposure while preserving convenience and brand control. In July 2026, INOX India and Wayout International partnered on decentralized water micro-factory concepts supplying refillable stainless steel vessels, pointing to a growth lane alongside traditional packaged formats where refill economics and local water treatment infrastructure support deployment. In South America, Coca-Cola FEMSA began investing in May 2025 to expand Crystal mineral water production in South Brazil, aiming for a material capacity uplift, and showing how local mineral-water platforms can scale through dedicated assets where urban reliability concerns and retail multipack demand are key purchase drivers.
Recent Industry Developments in Bottled Water Market
- June 2026: PepsiCo reported progress toward its 2030 watershed replenishment target, stating 58% completion, equivalent to 23 billion liters restored to local watersheds, and expanded the accounting boundary to include both company-owned and franchise-bottler facilities in high water-risk areas. The update reinforces water stewardship as a core operational KPI for beverage production, shaping site selection, capex priorities, and license-to-operate decisions in water-stressed regions.
- March 2026: PepsiCo announced it achieved its 2025 goal of replenishing 100% of the water used at all company-owned manufacturing sites in high water-risk watersheds and completed adoption of the Alliance for Water Stewardship (AWS) Standard at these sites. Standardized external verification and replenishment performance can support procurement and customer conversations around resource stewardship for packaged beverages, including bottled water.
- March 2025: Coca-Cola took over marketing, sales, and distribution for Danone's Evian in the United States and Canada under a commercial agreement with Groupe Danone. The shift leverages Coca-Cola's route-to-market scale to widen premium water availability in North America, increasing competitive pressure on other premium and imported brands across on-trade and key retail channels.


Bottled Water Market Report Scope and Research Methodology
Market Definition and Coverage
For this study, the bottled water market covers packaged drinking water sold for human consumption through retail and foodservice channels, counted in value terms (USD). It includes still, sparkling, and flavored or functional bottled water sold in common packs such as PET, glass, and cans.
Scope exclusions: Excluded items include bulk water sold in large dispensers (for example, reusable 5-gallon jugs) and other non-bottled potable water formats.
Segments Covered in This Report
- By Product Type
- Still Water
- Sparkling Water
- Functional/Flavoured Water
- Vitamin-Enhanced
- Electrolyte/Sports
- Botanical/Fruit-Infused
- By Packaging Material
- PET Bottles
- Glass Bottles
- Aluminum Cans and Bottles
- Others
- By Pricing
- Mass
- Premium/Luxury
- By Distribution Channel
- On-trade
- Off-trade
- Supermarkets/Hypermarkets
- Convenience/Grocery Stores
- Home and Office Space
- Online Retail
- Other Off-trade channels
- By Geography
- North America
- United States
- Canada
- Mexico
- Rest of North America
- Europe
- Germany
- United Kingdom
- Italy
- France
- Spain
- Netherlands
- Poland
- Belgium
- Sweden
- Rest of Europe
- Asia-Pacific
- China
- India
- Japan
- Australia
- Indonesia
- South Korea
- Thailand
- Singapore
- Rest of Asia-Pacific
- South America
- Brazil
- Argentina
- Colombia
- Chile
- Peru
- Rest of South America
- Middle East and Africa
- South Africa
- Saudi Arabia
- United Arab Emirates
- Nigeria
- Egypt
- Morocco
- Turkey
- Rest of Middle East and Africa
- North America
Data Sources, Market Sizing, and Validation
Desk Research
Desk research was used to set the fact base for demand, pricing, and category definitions before any modeling was done. We mainly relied on public, non-paywalled sources such as FAO food and agriculture statistics, UN Comtrade trade flows for packaged beverages, US FDA and EPA publications on drinking water and packaging, and WHO and UNICEF water access indicators that influence bottled water use.
To connect those macro signals to market value, company filings and investor presentations were reviewed for category revenue language, packaging mix, and regional growth discussion, and then checked against reputable press and association websites such as bottled water industry bodies. For context on patents and product claims, a paid patent database was also referenced, and shipment level import or export databases were used selectively where trade intensity was high. The desk sources cited here are illustrative only, and many other public documents were also used for data collection, cross-checking, and clarification.
Primary Interviews and Surveys
Primary work focused on interviews and short surveys with bottlers, packaging and distribution participants, and channel-side respondents across key consuming regions, so assumptions from desk research could be corrected where needed. These conversations were used to validate pricing ladders (mass versus premium), channel splits (on-trade versus off-trade), and the pace of shifts toward sparkling and flavored or functional offerings. We then sanity-checked the final totals through simple volume and price math.
Distribution of primary research fieldwork respondents
| Company type | Respondent position | Region |
|---|---|---|
| Top tier: 35% | CXOs: 15% | APAC: 48% |
| Mid tier: 44% | Functional/Unit leaders: 30% | EMEA: 30% |
| Smaller Players: 21% | Managers: 55% | Americas: 22% |
Market-Sizing & Forecasting
Sizing started with a top-down build where consumption proxies and trade signals were used to reconstruct the demand pool by region, and then the value was formed using typical category price ranges validated by interviews. For bottled water, the model was shaped using a small set of practical inputs such as per capita packaged water consumption, population and urbanization movement, share of off-trade retail in beverages, observed pack mix shifts (PET versus glass versus cans), and price premiums linked to sparkling and functional or flavored variants.
After the top-down pass, results were corroborated with selective bottom-up approximations, including sampled checks of brand and private label shelf prices, channel level volume cues, and supplier-side revenue ranges where disclosures were available. Where gaps existed, like limited visibility in small informal retail, assumptions were kept conservative and then re-tested with primary respondents until the implied volumes and pricing looked reasonable.
Forecasting relied mainly on scenario analysis supported by a light multivariate view of the drivers that matter most, including income trends, tap water quality perceptions, regulation around single-use packaging, and category premiumization. Inputs were moved forward annually, and the forecast was adjusted when expert feedback suggested a different slope for pricing or mix changes.
Data Validation & Update Cycle
Validation was done in steps so the final number could be traced back to simple checks. We compared model outputs against independent signals such as beverage category growth, trade and production direction, and region-level consumption patterns, and then reviewed outliers like sudden price jumps or unrealistic channel shares.
Before sign-off, assumptions and calculations go through multi-step analyst review, and re-contact is triggered when a metric conflicts with what respondents report on pricing, mix, or demand. Reports are refreshed annually, with interim updates when material events occur, and a final pre-delivery pass is done so clients receive the most current view.
Mordor Intelligence's Bottled Water Market Size Measured Against Other Published Estimates
Published market sizes for bottled water can look far apart even when they sound like they cover the same category, because the definition and the value capture point often differ. Differences usually come from what formats are counted, whether the number reflects producer value or retail value, and how quickly pricing and mix shifts are updated in the model.
Bulk water sold in large dispensers sits outside Mordor Intelligence's scope, which is one reason some published totals run higher when they blend bottled water with adjacent water delivery formats. Gaps can also show up when one estimate uses retail sales value and another uses producer revenue, or when currency timing and premiumization assumptions are not updated after inflation and packaging cost swings.
Benchmark comparison
| Source | Market Size | Gaps in Research Methodology |
|---|---|---|
| Mordor Intelligence | USD 312.36 B (2026) | |
| Industry Publisher A | USD 274.00 B (2024) | Uses an earlier base year and a different forecast window, and the scope wording is broader, which can lead to mix and price assumptions that do not fully reflect the latest premiumization and packaging shifts. |
| Industry Association B | USD 48.77 B (2023) | Covers the United States only and reports retail dollars, so it is not comparable to a global market value number that aggregates regions and aligns value capture consistently across channels. |
Taken together, the spread is mostly explained by geography coverage, value capture point (retail versus producer), and whether adjacent water formats are blended into the category. By keeping the scope tied to packaged bottled water and by re-checking price and mix with real channel signals, the estimate stays easier to replicate and easier to audit year over year.


Key Questions Answered in the Report
What is the projected value of the global bottled water market in 2031?
The market is expected to reach USD 432.58 billion by 2031, growing at a 6.72% CAGR over 2026-2031.
Which region will grow fastest through 2031?
South America leads with a 9.88% compound annual growth rate supported by rapid urbanization and infrastructure gaps.
How large is still water compared with functional and flavored variants?
Still formats represented 72.88% of 2025 sales, yet functional/flavored waters post the strongest 8.12% CAGR to 2031.
Which packaging material is advancing quickest?
Glass bottles are rising at a 8.74% CAGR as consumers associate the format with sustainability and purity.
Page last updated on:




