
Egypt Agriculture Market Analysis by Mordor Intelligence
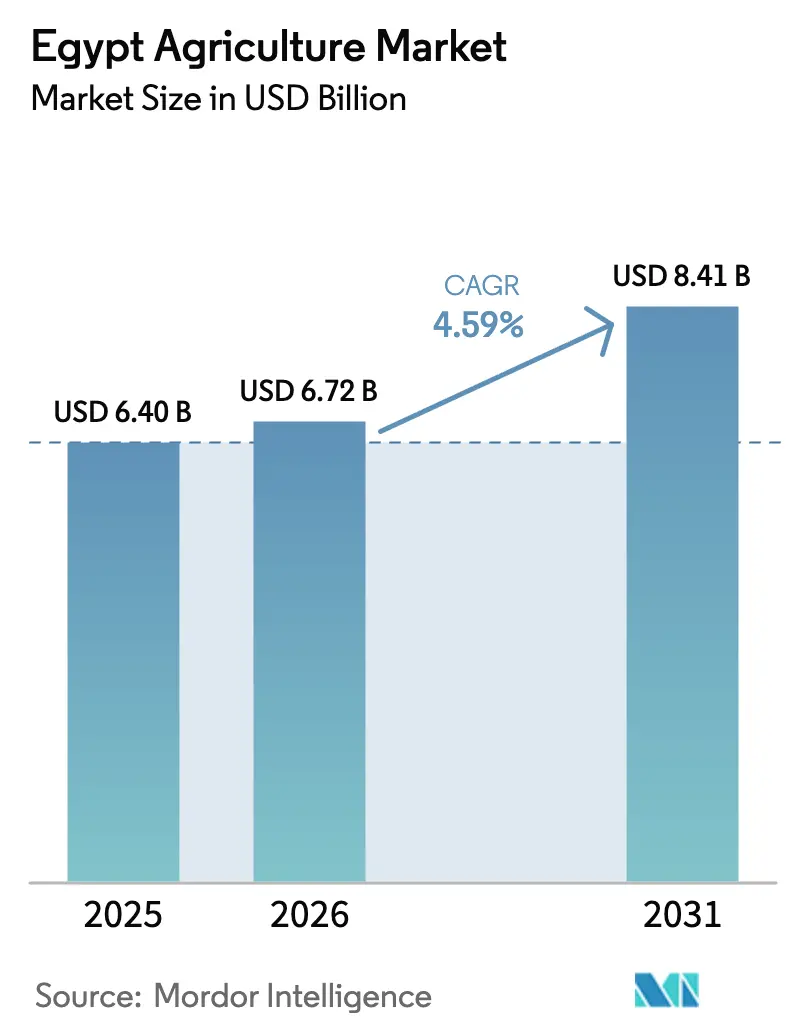
The Egypt agriculture market size is projected to expand from USD 6.40 billion in 2025 and USD 6.72 billion in 2026 to USD 8.41 billion by 2031, registering a CAGR of 4.59% between 2026 to 2031. Sustained export momentum in citrus, grapes, and potatoes, rising private investment in drip irrigation, and government procurement guarantees for wheat, cotton, and sugarcane underpin this expansion of the Egypt agriculture market. Voluntary carbon-credit revenue, blended-finance vehicles, and duty-free access to Brazil, Argentina, Paraguay, and Uruguay through the Egypt-Mercosur framework are broadening profit pools, even as climate-driven water scarcity and freight cost spikes constrain margins. Precision irrigation programs financed by a USD 500 million World Bank loan are cutting on-farm water use by up to 40%, while the Grand Ethiopian Renaissance Dam’s downstream flow reductions force farmers to switch from rice to less water-intensive crops. Freight volatility following the 2024 Red Sea attacks highlighted the need for resilient logistics networks, prompting vertically integrated exporters to build cold-chain and overland corridors that protect perishables and stabilize the Egypt agriculture market.
Key Report Takeaways
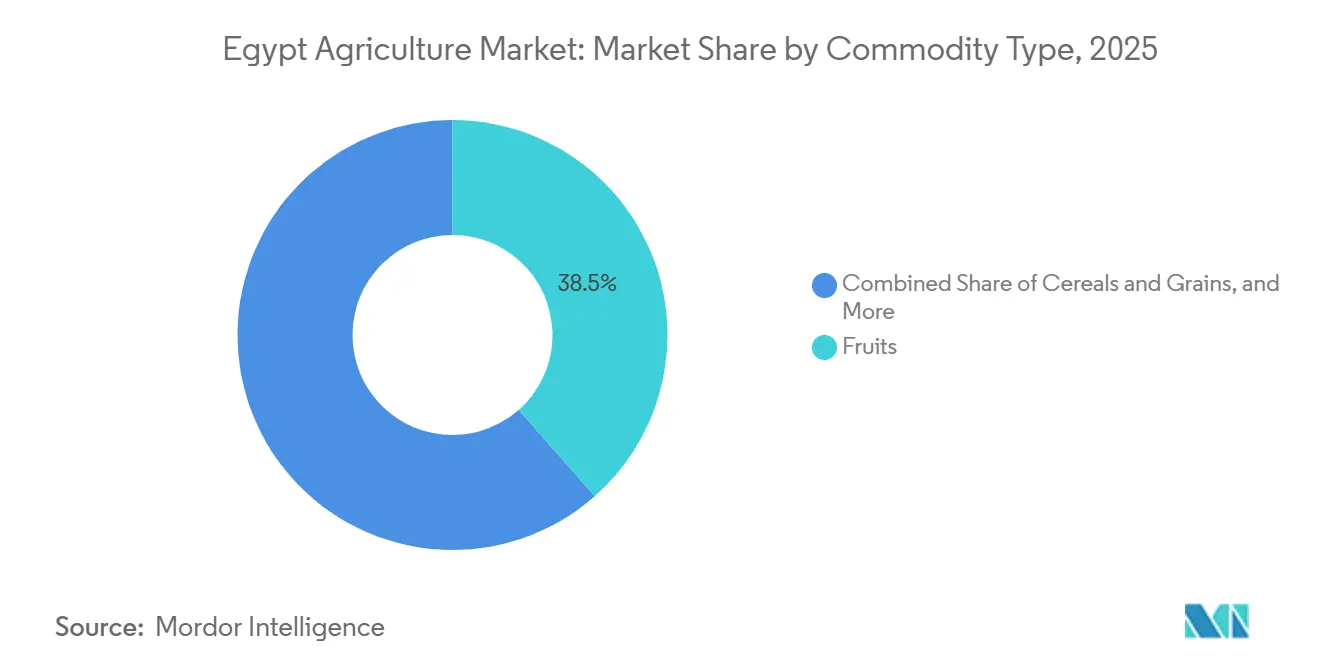
- By commodity type, fruits led with a 38.5% Egypt agriculture market share in 2025, while oilseeds and pulses posted the highest projected 5.0% CAGR through 2031.
Note: Market size and forecast figures in this report are generated using Mordor Intelligence’s proprietary estimation framework, updated with the latest available data and insights as of January 2026.
Egypt Agriculture Market Trends and Insights
Drivers Impact Analysis*
| Driver | (~) % Impact on CAGR Forecast | Geographic Relevance | Impact Timeline |
|---|---|---|---|
| Population-driven calorie demand growth | +0.8% | Nationwide, concentrated in Greater Cairo, Alexandria, and Giza | Medium term (2-4 years) |
| Expansion of agriculture export preferential trade agreements | +0.6% | Nationwide gains to the European Union, Southern Common Market, European Free Trade Association, and Common Market for Eastern and Southern Africa | Long term (≥ 4 years) |
| Accelerating adoption of precision irrigation systems | +0.5% | Nile Delta, Beheira, Dakahlia, and desert reclamation zones | Medium term (2-4 years) |
| Rise of agriculture focused blended finance funds | +0.3% | Early traction in Upper Egypt and Minya | Long term (≥ 4 years) |
| Carbon-credit monetization of regenerative acreage | +0.3% | Fayoum, New Valley, and desert reclamation zones | Long term (≥ 4 years) |
| Blockchain-enabled commodity tokenization | +0.2% | Pilot stage in Alexandria and Damietta ports | Long term (≥ 4 years) |
| Source: Mordor Intelligence | |||
Population-Driven Calorie Demand Growth
Wheat has been a vital food staple in Egypt for centuries and remains one of the key crops for food security in the country. It currently accounts for one-third of the average Egyptian's daily calorie intake. The crop contributes approximately 10% to the total value of agricultural production and around 20% of all agricultural imports, highlighting the significant food security challenges faced by the country[1]Source: International Center for Agricultural Research in the Dry Areas (ICARDA), "Political Economy of the Wheat Sector in Egypt: Seed Systems, Varietal Adoption, and Impacts," icarda.org. The subsidized baladi bread program, benefiting 70 million people, sustains a consistent structural demand for cereals. Rising urban incomes are driving dietary changes, with increased consumption of poultry and aquaculture. This has led to soybean meal inclusion rates of 19.4% in poultry feed and up to 30% in aquaculture feed. These dietary trends directly link oilseed imports to protein supply chains, ensuring that improvements in yield contribute significantly to the growth of Egypt's agricultural market. Additionally, the reliance on imports highlights the importance of global trade partnerships and the need for strategic investments in domestic agricultural productivity to reduce dependency on external sources.
Expansion of Agriculture Export Preferential Trade Agreements
Preferential agreements facilitated USD 10.6 billion in agricultural exports in 2025, representing a 21% year-on-year increase. The Southern Common Market agreement, finalized in 2024, allows tariff-free access for Egyptian citrus, grapes, and strawberries to four South American countries, which collectively import over 4 million metric tons of fresh produce annually. This agreement significantly enhances market penetration opportunities for Egyptian exporters, enabling them to compete more effectively in these high-demand markets. Additional concessions under the European Free Trade Association agreement and the long-standing European Union Association Agreement reduce landed costs by 8% to 15%, thereby increasing addressable demand and supporting export-driven value growth in the Egypt agriculture market.
Accelerating Adoption of Precision Irrigation Systems
A USD 500 million World Bank modernization loan, approved in 2024, supports the conversion from drip and sprinkler irrigation systems to more efficient systems on 500,000 feddans in the Nile Delta[2]Source: World Bank Group, “Egypt Water Resources and Irrigation Modernization Project,” worldbank.org. The International Fund for Agricultural Development complements this with a USD 52.8 million climate-resilient agriculture facility targeting smallholders in Beheira, Dakahlia, and Kafr El Sheikh. Al Dahra Holding demonstrated 40% water savings and 18% yield gains on 1,500 acres of sesame using Dragon Line drip technology, providing a compelling commercial case for rapid diffusion. With the Ministry of Agriculture and Land Reclamation mandating drip irrigation on all new acreage, precision systems are set to become the agronomic baseline for the Egypt agriculture market.
Rise of Agriculture Focused Blended Finance Funds
Blended finance operates by strategically utilizing concessional public funds, such as International Fund for Agricultural Development (IFAD) loans and grants, to mitigate risks associated with investments that commercial lenders may deem too high, particularly those involving small-scale farmers and agribusinesses. This approach has enabled greater access to financial resources for these entities, fostering their growth and resilience. The International Finance Corporation’s equity investment in Raya Foods in 2024 supports the establishment of a USD 40 million freeze-dried facility, adding 50,000 tons of processing capacity. This facility is projected to enhance value addition and improve supply chain efficiency in the agriculture sector. By integrating concessional capital with commercial returns, these financial structures reduce the weighted average cost of capital, promoting investment in crushing plants, cold-chain infrastructure, and regenerative farming practices. This, in turn, supports the growth of the agriculture market in Egypt.
Restraints Impact Analysis*
| Restraint | (~) % Impact on CAGR Forecast | Geographic Relevance | Impact Timeline |
|---|---|---|---|
| Climate-induced water-scarcity stress | -0.6% | Nile Delta, Fayoum, Minya, and Upper Egypt | Short term (≤ 2 years) |
| Trade-route disruptions and freight spikes | -0.5% | Nationwide, acute for Alexandria, Damietta, and Port Said exporters | Short term (≤ 2 years) |
| Soil salinity creep in reclaimed desert lands | -0.4% | Toshka, New Delta, and Sinai reclamation zones | Medium term (2-4 years) |
| Limited availability of agriculture-specific green hydrogen | -0.2% | Concentrated in Suez Canal Economic Zone | Long term (≥ 4 years) |
| Source: Mordor Intelligence | |||
Climate-Induced Water-Scarcity Stress
Renewable water availability is currently at 560 cubic meters per capita, significantly below the United Nations' scarcity threshold of 1,000 cubic meters. This limited water availability poses a significant challenge to agricultural sustainability in the region. The initial filling of the Grand Ethiopian Renaissance Dam in 2024 reduced Nile flows by 10 to 15%, compelling farmers in Minya and Aswan to shift from rice cultivation to wheat and maize, which are less water-intensive crops. Government-imposed rice acreage limits of 1.1 million feddans, combined with saltwater intrusion in the Nile Delta, have further reduced the production of Egypt's most water-intensive crop. These measures aim to conserve water resources but have also impacted the agricultural output and income of farmers. Although drip irrigation has helped mitigate some losses, its uneven adoption among smallholders continues to hinder short-term growth prospects, highlighting the need for broader implementation and support for sustainable farming practices.
Soil Salinity Creep in Reclaimed Desert Lands
Salinity impacts approximately 35% of cultivated land, with Toshka reporting electrical conductivity exceeding 4 deciSiemens per meter in 20% of plots[3]Source: Ministry of Agriculture and Land Reclamation Egypt, “Agricultural Development Strategy 2024-2030,” agr.gov.eg. Reclamation efforts require five to eight years, as farmers must leach salts using 1.5 to 2 times the standard water application, which conflicts with water conservation mandates. This process is labor-intensive and requires significant resources, further complicating efforts to achieve timely reclamation. While organic matter amendments and gypsum provide some relief by improving soil structure and reducing salinity levels, financial constraints hinder widespread adoption. This delays the anticipated yield improvements from the government’s 3.5 million feddan expansion program in 2023, thereby moderating growth in the Egyptian agriculture market. Additionally, the lack of adequate infrastructure and technical support exacerbates the challenges faced by farmers in addressing salinity issues effectively.
*Our forecasts treat driver/restraint impacts as directional, not additive. The impact forecasts reflect baseline growth, mix effects, and variable interactions.
Segment Analysis
By Commodity Type: Fruits Exports Anchor Value Growth
Fruits generated 38.5% of the Egypt agriculture market share in 2025, underpinned by 3.8 million metric tons of orange output and 2.1 million metric tons of citrus exports valued at USD 1.9 billion[4]Source: Food and Agriculture Organization of the United Nations Statistics, “Egypt Agricultural Production Statistics 2024,” fao.org. Grapes reached 1.8 million tons and strawberries 700,000 metric tons, while citrus supplied more than 50 international destinations during Europe’s off-season. Duty-free quotas from the European Union, Southern Common Market, and European Free Trade Association shave 8 to 15% off landed costs, sharpening competitiveness. Cold-chain upgrades such as Raya Foods’ 25,000-square-meter freeze-dried plant add 50,000 metric tons of processing capacity in 2024, extend shelf life, and reduce post-harvest losses to 10%. These factors collectively secure horticulture’s status as the dominant value generator in the Egypt agriculture market.
Oilseeds and pulses are the fastest-growing segment, projected to expand at a 5.0% CAGR through 2031. Al Dahra Holding’s sesame trials recorded 18% yield gains under zero-tillage and drip irrigation in desert zones, surpassing the Nile Delta in oilseed viability. Government tenders in January 2025 secured 30,000 metric tons of crude soybean oil and 10,000 metric tons of sunflower oil, confirming robust downstream demand. Capital inflows into crushing and feed plants position oilseeds to deliver the highest incremental revenue to the Egypt agriculture market.



Geography Analysis
The Nile Delta governorates of Beheira, Dakahlia, and Kafr El Sheikh are renowned for their intensive production of wheat, rice, and vegetables on fertile alluvial soils. However, Mediterranean saltwater intrusion affects 15,000 to 20,000 feddans annually, necessitating the use of salt-tolerant cultivars and precision leaching techniques to mitigate soil degradation. To address water scarcity and sustain agricultural productivity, drip and sprinkler irrigation retrofits, funded by the World Bank, aim to cover 500,000 feddans. These retrofits are projected to achieve water savings of 30% to 40%, ensuring the maintenance of agricultural yields despite increasing water stress conditions in the region.
Upper Egypt governorates, including Minya, Aswan, and Sohag, focus on sugarcane, cotton, and aromatic herbs. Flow reductions from the Grand Ethiopian Renaissance Dam resulted in a 20% decrease in rice acreage by 2025, prompting growers to switch to maize and wheat. SEKEM’s pilot in Minya converted 1,300 farmers to biodynamic practices, delivering 15% input savings and a 20% organic price premium that bolsters household income and diversifies output quality within the Egypt agriculture market.
The desert reclamation zones of Toshka, the New Delta, and Sinai represent the growth frontier, with 3.5 million feddans slated for cultivation. Toshka targets 540,000 feddans yet grapples with high salinity, and 20% of surveyed plots exceed 4 deciSiemens per meter. Al Dahra Holding’s 147,000 acre footprint uses zero-tillage and Dragon Line drip irrigation to overcome these constraints, recording 18% sesame yield gains in 2024. Proximity to Alexandria and Damietta ports positions the New Delta to become a future export hub for citrus and grapes, once irrigation infrastructure is fully commissioned, broadening regional gains for the Egypt agriculture market.
Regulatory Landscape
Egypt's agricultural commodities market operates under a multi-agency control system led by the National Food Safety Authority (NFSA) for food safety licensing and risk-based inspections, alongside the General Organization for Export and Import Control (GOEIC) for import-export conformity assessment and laboratory testing (including ISO/IEC 17025-accredited labs). Plant health for traded crops is overseen through the Central Administration of Plant Quarantine (CAPQ), which shapes market access for seeds, fresh produce, and other plant-origin agricultural commodities moving into domestic or export channels.
In January 2026, NFSA published Decision No. 1/2025 establishing rules for handling genetically modified foods and their components, including notification, environmental risk assessment, and unique identifier requirements, with a stated six-month compliance grace period. This adds a clearer compliance pathway for operators handling GMO-derived ingredients, while increasing documentation and traceability requirements for importers, storage operators, and downstream handlers that interface with regulated food supply chains.
Value Chain Analysis
The Egypt agriculture value chain starts with inputs (seed, fertilizers, crop protection, irrigation equipment) and farm production dominated by smallholders (typically one to five feddans), then aggregates through traders, cooperatives, and vertically integrated growers before moving into sorting, packing, cold storage, and domestic wholesale or export channels. Large exporters and integrated agribusinesses (including Al Dahra Holding, Wadi Holdings, PICO for Modern Agriculture, and SEKEM) concentrate capabilities in irrigation know-how, aggregation, quality management, and export logistics, while government procurement programs for strategic crops (notably wheat) influence farm-gate pricing behavior and planting decisions.
Infrastructure and logistics remain binding constraints and investment levers across the chain. The FY 2025/2026 development plan directs EGP 17.5 billion of public investment toward agriculture and irrigation (within total planned sector investments of EGP 144.8 billion), alongside land expansion targets such as reclaiming 750,000 feddans. Flagship platforms include the New Delta Project (2.2 million feddans), supported by enabling assets such as pumping stations and road networks. Post-harvest losses and insufficient cold-chain and storage capacity continue to be key bottlenecks. At the same time, the build-out of modern grain silos (reported capacity rising to 3.6 million tons by 2025, supported by new local manufacturing initiatives) strengthens midstream resilience for cereals handling and procurement flows.
Competitive Landscape
Smallholders managing plots of one to five feddans constitute nearly 70% of the cultivated area. In contrast, large vertically integrated companies, including Al Dahra Holding LLC, Wadi Holdings S.A.E., PICO for Modern Agriculture Co. S.A.E., and SEKEM Holding SE for Modern Agriculture, dominate export logistics and processing activities. Al Dahra invested USD 30 million in 2024 to expand its operations to 147,000 acres, establishing itself as Egypt’s largest private wheat producer with 450,000 metric tons delivered over three years and achieving a top-ten position in citrus exports.
Strategic differentiation centers on long-term supply contracts, precision irrigation, and regenerative farming that qualify for future carbon credits. Raya Foods’ USD 40 million freeze-dried facility aims to cut post-harvest losses and target premium institutional buyers willing to pay 30 to 40% above commodity benchmarks. Oilseed crushing offers white-space upside as poultry and aquaculture feed demand accelerates, while blockchain tokenization pilots reduce settlement times and financing costs for grain exporters once regulatory clarity emerges.
Smaller cooperatives utilize blended finance to consolidate volumes and engage with bulk buyers, reducing the weighted average cost of capital and enhancing competitiveness. By pooling resources, these cooperatives can negotiate more favorable terms with buyers and suppliers, thereby improving their market position. Government procurement programs ensure minimum prices for wheat, cotton, and sugarcane, providing stability but reducing incentives for efficiency improvements. While these programs provide a safety net for farmers, they may also discourage innovation and hinder cost optimization. Companies excelling in precision irrigation, carbon-credit monetization, and diversified trade corridors are well-positioned to outperform competitors and achieve significant gains in the Egypt agriculture market. These firms utilize advanced technologies and sustainable practices to boost productivity and expand their market reach, thereby securing a competitive edge.
Market Opportunities and Future Outlook
Water and land productivity programs are creating near-term whitespace for irrigation equipment, on-farm efficiency services, and agronomy packages that can be deployed across both the Nile Delta and desert reclamation zones. The World Bank-supported irrigation modernization program (USD 500 million, approved in 2024, targeting 500,000 feddans) and the stated mandate for drip irrigation on new acreage expand addressable demand for precision irrigation systems and farm-level advisory. Large-scale reuse infrastructure also adds supply-side support for new desert farming, with the Agriculture Ministry citing major wastewater treatment assets including Al-Hammam (7.5 million cubic meters/day), Bahr El-Baqar (5.6 million cubic meters/day), and Al-Mahsama (1.3 million cubic meters/day) in 2026.
Export competitiveness and supply-chain resilience initiatives open opportunities in cold-chain, storage, and corridor-linked logistics that protect perishables and reduce volatility. In July 2026, Egypt announced eight international logistics corridors to improve trade connectivity, including routes linking Upper Egypt and southern gateways, consistent with an emerging hub-and-spoke approach connecting production basins to ports and cross-border markets. Alongside this, localization of strategic midstream assets, including the Feerum Egypt joint venture for local grain-silo manufacturing in East Port Said (announced November 2025), supports storage build-out and reduces import dependence for critical infrastructure, improving handling efficiency for cereals and stabilizing procurement-linked supply chains.
Recent Industry Developments
- April 2026: Indorama Corporation signed a contract to develop a phosphate fertilizers and chemicals complex in the Suez Canal Economic Zone with an initial investment of USD 525 million. The project strengthens domestic supply of fertilizer and related inputs, reducing exposure to import volatility for crop producers and commercial farms. It also reinforces the Suez Canal Economic Zone as an inputs manufacturing base linked to nationwide distribution corridors.
- November 2025: Egypt and Polands Feerum established Feerum Egypt, a joint venture to manufacture grain silos locally in East Port Said. The initiative targets 80% local production within three years, supporting faster rollout of modern storage infrastructure and localizing parts of the cereals supply chain. It aligns with food security priorities by improving strategic grain reserve logistics and reducing reliance on imported silo systems.
- October 2024: The World Bank approved a USD 500 million Water Resources and Irrigation Modernization project supporting conversion to efficient irrigation systems across 500,000 feddans in the Nile Delta. This creates a scaled financing channel for drip and sprinkler retrofits, accelerating demand for irrigation equipment, installation, and maintenance services. By lowering on-farm water use materially, the program supports crop mix adjustments under water-scarcity pressure and helps protect farm-gate value in key production governorates.


Research Methodology Framework and Report Scope
Market Definition and Coverage
For this report, the market is defined as the annual farm-gate value, in USD, of crops produced in Egypt and sold into domestic supply chains or exported within the same year.
Scope exclusions: Livestock, aquaculture, and post-farm processing activities are not counted in this market value.
Segmentation Overview
-
By Commodity Type
-
Cereals and Grains
-
Production Analysis
- Overview
- Area Harvested and Yield
- Consumption Analysis (Value and Volume)
-
Trade Analysis (Value and Volume)
-
Import Market Analysis
- Overview
- Key Supplying Markets
-
Export Market Analysis
- Overview
- Key Destination Markets
-
Import Market Analysis
- Wholesale Price Trend Analysis and Forecast
- Seasonality Analysis
-
Production Analysis
-
Oilseeds and Pulses
-
Production Analysis
- Overview
- Area Harvested and Yield
- Consumption Analysis (Value and Volume)
-
Trade Analysis (Value and Volume)
-
Import Market Analysis
- Overview
- Key Supplying Markets
-
Export Market Analysis
- Overview
- Key Destination Markets
-
Import Market Analysis
- Wholesale Price Trend Analysis and Forecast
- Seasonality Analysis
-
Production Analysis
-
Fruits
-
Production Analysis
- Overview
- Area Harvested and Yield
- Consumption Analysis (Value and Volume)
-
Trade Analysis (Value and Volume)
-
Import Market Analysis
- Overview
- Key Supplying Markets
-
Export Market Analysis
- Overview
- Key Destination Markets
-
Import Market Analysis
- Wholesale Price Trend Analysis and Forecast
- Seasonality Analysis
-
Production Analysis
-
Vegetables
-
Production Analysis
- Overview
- Area Harvested and Yield
- Consumption Analysis (Value and Volume)
-
Trade Analysis (Value and Volume)
-
Import Market Analysis
- Overview
- Key Supplying Markets
-
Export Market Analysis
- Overview
- Key Destination Markets
-
Import Market Analysis
- Wholesale Price Trend Analysis and Forecast
- Seasonality Analysis
-
Production Analysis
-
Cash Crops
-
Production Analysis
- Overview
- Area Harvested and Yield
- Consumption Analysis (Value and Volume)
-
Trade Analysis (Value and Volume)
-
Import Market Analysis
- Overview
- Key Supplying Markets
-
Export Market Analysis
- Overview
- Key Destination Markets
-
Import Market Analysis
- Wholesale Price Trend Analysis and Forecast
- Seasonality Analysis
-
Production Analysis
-
Cereals and Grains
Data Sources, Market Sizing, and Validation
Desk Research
To build the initial fact base, we started from public agriculture statistics and trade signals that can be checked year after year. Sources used include, for example, FAOSTAT for crop production volumes and yield patterns, UN Comtrade for export and import flows by commodity, and World Bank indicators for macro variables linked to farm income and input affordability.
We also reviewed CAPMAS releases where available, Ministry of Agriculture and Land Reclamation updates, and publications from bodies like the Food and Agriculture Organization for crop calendars and agronomy context. We used company filings, investor presentations, and reputable press to sense-check pricing direction and export momentum. In addition, a few paid subscriptions were used only for company financials and intelligence, shipment-level trade views, and patent searches, which helped confirm assumptions on commercialization and input adoption. This list is illustrative, and many other public sources were also referenced for data collection, validation, and clarification.
Primary Interviews and Surveys
Primary work focused on stress-testing the demand and supply reality behind the desk model, especially around farm-gate pricing, marketed surplus, and exportable grades for major Egyptian crops. We spoke with growers, exporters, input suppliers, traders, and industry experts across key producing areas, then used their responses to close gaps in marketed share and pricing assumptions and to confirm the reasonableness of the final inputs.
Distribution of primary research fieldwork respondents
| Company type | Respondent position | Region |
|---|---|---|
| Top tier: 33% | CXOs: 17% | |
| Mid tier: 50% | Functional/Unit leaders: 32% | |
| Smaller Players: 17% | Managers: 51% |
Market-Sizing & Forecasting
Our sizing logic uses top-down and bottom-up together, but it is not built as a full supplier roll-up. The top-down approach reconstructs crop value by combining crop-wise production volumes with farm-gate price levels, and then it is adjusted for marketed output that actually enters domestic trade or export channels. To keep the totals grounded, selective bottom-up checks are run using sampled price quotes, channel checks with traders and exporters, and spot validation of harvested area and yield movement.
Inputs that materially shape the model include harvested area trends by major crop groups, yield shifts tied to irrigation availability and weather, farm-gate price direction for key staples and cash crops, export volumes and destination pull, and policy signals that influence cropping choices (such as procurement and import management for staple grains). Where a data point is missing for a smaller crop, we bridge the gap using close proxy crops and regional averages, and then recheck the outcome with field feedback.
For forecasting, scenario analysis is used with a simple set of drivers, and the driver paths are aligned to what experts expect for acreage, yields, and farm-gate pricing over the forecast window. A short set of scenarios is kept so the forecast remains repeatable and easy to explain on a call.
Data Validation & Update Cycle
Validation is done through multiple checks so the final number is not dependent on any single source. Model outputs are compared with independent signals such as crop production series, trade flows, and broad price trends, and then any large variance is reviewed commodity by commodity before sign-off.
Anomaly flags are raised when implied prices, yield jumps, or export shares look out of line with the recent history, and we recontact selected interviewees when those flags cannot be resolved from public data. Reports are refreshed annually, and interim updates are made when material events change crop economics or trade patterns in Egypt. Before delivery, a fresh review pass is completed so clients receive the most current view available.
Mordor Intelligence's Egypt Agriculture Market Size Measured Against Other Published Estimates
Published market values for Egypt agriculture do not always match, and the gaps usually come from how each source defines the market boundary and how it converts volumes into value. Differences also show up when one estimate is anchored to farm-gate crop output and another blends in adjacent activities or uses a different pricing year.
Export and import commodity flows, along with crop production volumes and farm-gate price checks, are the evidence that keeps Mordor Intelligence tied to a crop-only, farm-gate value pool, which is why the number can look smaller than estimates that include livestock, fisheries, or downstream processing.
Benchmark comparison
| Source | Market Size | Gaps in Research Methodology |
|---|---|---|
| Mordor Intelligence | USD 6.40 B (2025) | |
| Regional Consultancy A | USD 5.20 B (2024) | Uses a different base year and does not clearly separate farm-gate crop value from traded commodity value, which can compress the total when price updates lag and export crop realization is undercounted. |
| Trade Journal B | USD 4.01 B (2024) | Covers agriculture commodities through a trading lens with narrower included items and simplified value conversion, which can miss parts of domestic crop output that do not pass through tracked commodity channels. |
The table shows that the spread is largely explained by scope and valuation choices, not by a single data point. When farm-gate crop value is rebuilt from production, price, and trade signals and then cross-checked through interviews, the result becomes easier to trace and to update as new season outcomes and price shifts appear.


Key Questions Answered in the Report
What is the current value of the Egypt agriculture market and its growth outlook?
The Egypt agriculture market size stands at USD 6.72 billion in 2026 and is projected to reach USD 8.41 billion by 2031, reflecting a 4.59% CAGR.
Which commodity segment contributes the most revenue?
Fruits dominate with a 38.5% share in 2025, anchored by Egypt’s position as the top global orange exporter.
How are water-scarcity risks being managed?
A USD 500 million World Bank project and mandatory drip irrigation on new land aim to cut water use up to 40% and sustain yields.
What logistics challenges affect agricultural exports?
Red Sea security incidents in 2024 tripled freight costs and extended transit times, prompting investment in alternative overland routes and private cold-chain capacity.
How can farmers monetize regenerative practices?
Zero-tillage and cover cropping can generate USD 10 to USD 18 per feddan in carbon-credit revenue once Egypt’s planned national registry becomes operational.
Page last updated on:




