Water Soluble Fertilizer Market Size and Share
Market Overview
| Study Period | 2021 - 2031 |
|---|---|
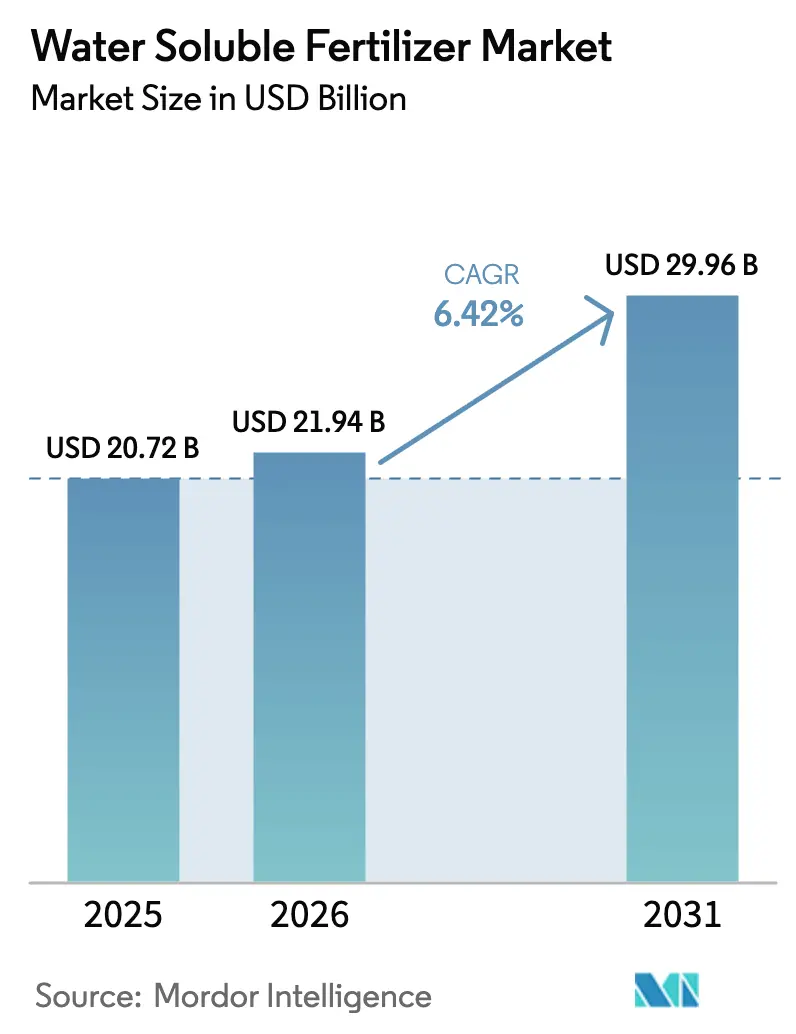
| Market Size (2026) | USD 21.94 Billion |
| Market Size (2031) | USD 29.96 Billion |
| Growth Rate (2026 - 2031) | 6.42% CAGR |
| Fastest Growing Market | Middle East |
| Largest Market | Asia-Pacific |
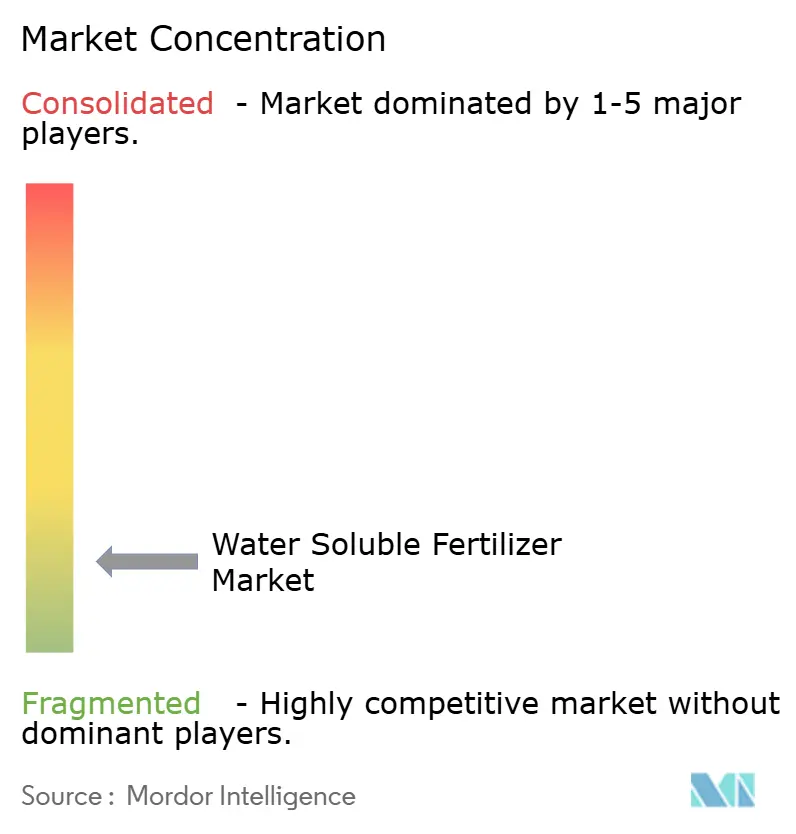
| Market Concentration | Low |
Major Players*Disclaimer: Major Players sorted in no particular order Image © Mordor Intelligence. Reuse requires attribution under CC BY 4.0. | |
Water Soluble Fertilizer Market Analysis by Mordor Intelligence
The water soluble fertilizer market size was valued at USD 20.72 billion in 2025 and estimated to grow from USD 21.94 billion in 2026 to reach USD 29.96 billion by 2031, at a CAGR of 6.42% during the forecast period (2026-2031). Demand escalates as growers search for ways to stretch limited irrigation supplies, offset high labor costs, and comply with stringent nutrient-efficiency rules. Straight grades dominate in open-field cereals because they slot easily into existing injectors and cost less per nutrient, while complex blends gain momentum in high-tech greenhouses that need chloride-free, pre-chelated recipes. Foliar sprays outpace drip delivery in percentage growth because they rapidly address in-season micronutrient stress, yet fertigation remains the backbone of base nutrition programs. Governments in India, China, and Turkey subsidize micro-irrigation hardware and soluble inputs, and carbon credit schemes in the United States and the European Union reward weekly nitrogen injections that trim nitrous oxide emissions. Suppliers with vertically integrated potash and phosphate assets defend margins despite raw-material volatility, positioning the water soluble fertilizer market for sustained expansion through 2031.
Key Report Takeaways
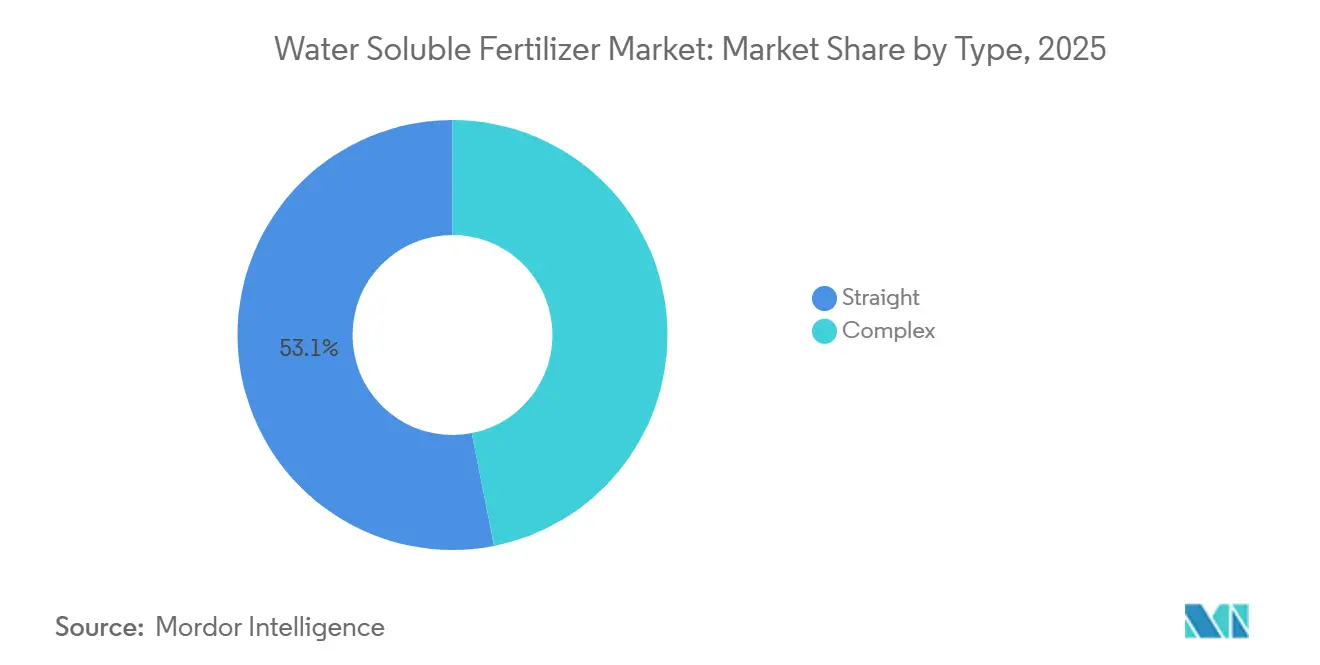
- By type, straight led with 53.1% of the water soluble fertilizer market share in 2025, while complex will be the fastest-growing segment will registering a 6.6% CAGR through 2031.
- By application mode, fertigation captured 54.0% of the water soluble fertilizer market size in 2025, whereas foliar will be the fastest-growing segment, forecast to grow at a 6.5% CAGR through 2031.
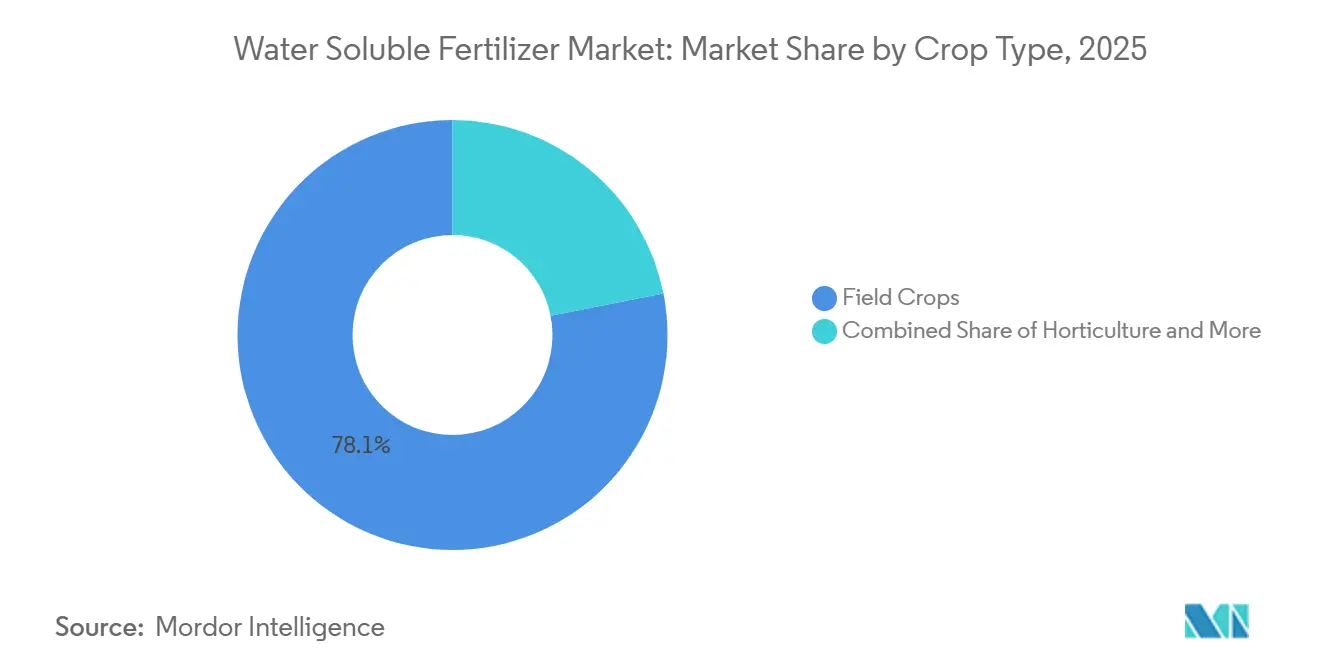
- By crop, field crops held a 78.1% share of the water soluble fertilizer market in 2025. Horticultural crops are projected to expand at a 7.6% CAGR through 2031.
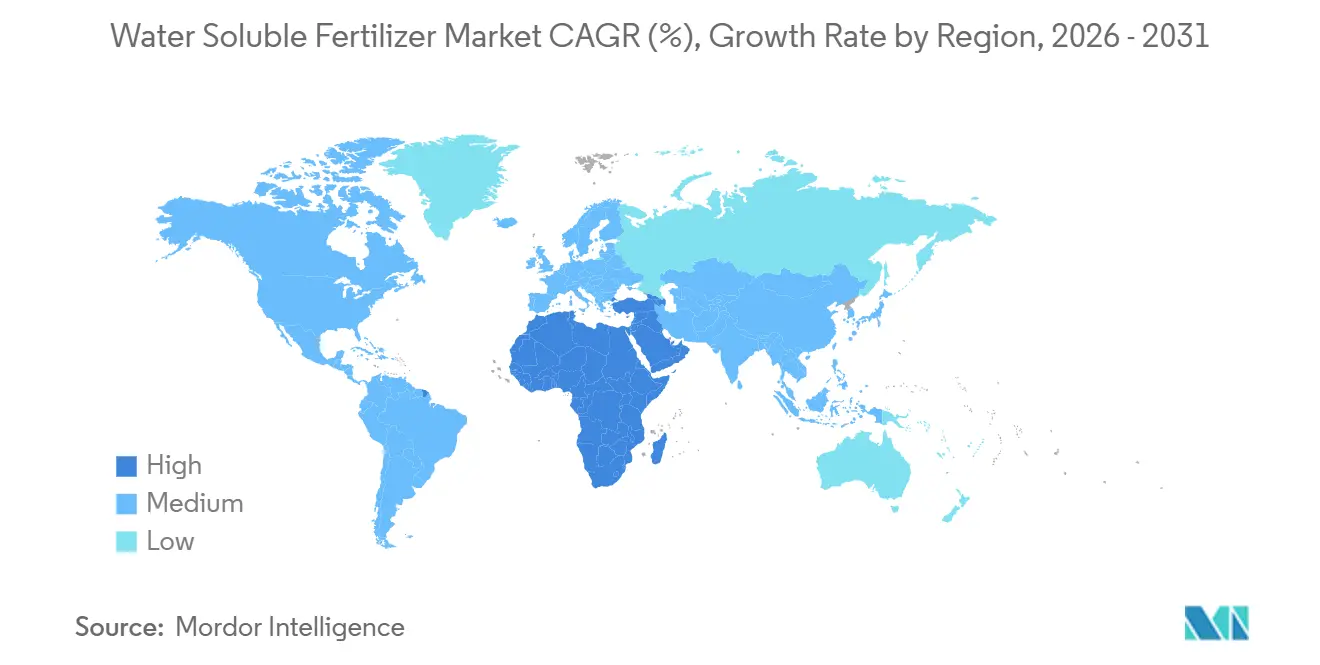
- By geography, the Asia-Pacific region is the largest, accounting for 41.3% water soluble fertilizer market in 2025; the Middle East region is projected to deliver the strongest 7.1% CAGR through 2031.
- The market remains highly fragmented, with the top five companies ICL Group Ltd, K+S Aktiengesellschaft, Sociedad Química y Minera de Chile SA, Yara International ASA, and Indian Farmers Fertiliser Cooperative Limited collectively representing only a modest portion of total global revenue in 2025.
Note: Market size and forecast figures in this report are generated using Mordor Intelligence’s proprietary estimation framework, updated with the latest available data and insights as of 2026.
Global Water Soluble Fertilizer Market Trends and Insights
Driver Impact Analysis*
| Driver | (~) % Impact on CAGR Forecast | Geographic Relevance | Impact Timeline |
|---|---|---|---|
| Rising adoption of fertigation systems in high-value crops | +1.8% | Asia-Pacific core, Middle East, and spill-over to South America | Medium term (2-4 years) |
| Need for precise nutrient management in greenhouse farming | +1.4% | Europe, Asia-Pacific, and North America | Short term (≤ 2 years) |
| Expansion of drip irrigation acreage worldwide | +1.6% | Middle East, Asia-Pacific, and Africa | Long term (≥ 4 years) |
| Government subsidies promoting water-efficient fertilizers | +1.2% | Asia-Pacific and the Middle East | Medium term (2-4 years) |
| Surge in soluble specialty blends for hydroponics | +0.9% | Global, with early gains in North America, Europe, and Singapore | Short term (≤ 2 years) |
| Carbon-credit-linked fertilizer programs | +0.7% | North America, and Europe | Long term (≥ 4 years) |
| Source: Mordor Intelligence | |||
Rising Adoption of Fertigation Systems in High-Value Crops
The increasing adoption of fertigation systems in high-value crops such as fruits, vegetables, and plantation crops is a primary structural driver of the water soluble fertilizer market. Fertigation enables precise nutrient dosing, reduces nutrient losses, and improves yield quality, making fully soluble fertilizers essential for drip and sprinkler irrigation systems. As growers prioritize productivity and input efficiency, especially in horticultural and export-oriented crops, the installed base of fertigation infrastructure continues to expand, generating recurring demand for water-soluble formulations.
Need for Precise Nutrient Management in Greenhouse Farming
Greenhouse acres expanded sharply in the Netherlands and northern China, where chloride-free fertilizers prevent salt build-up in coco coir and rockwool media [1]Source: Ministry of Finance, “Precision Fertilizer Adoption Support 2025,” mof.gov.cn. Automated controllers adjust Electrical Conductivity (EC) and pH every few minutes, forcing suppliers to guarantee complete dissolution and chelate stability. In Japan, the use of closed-loop hydroponic lettuce farms in urban warehouses highlights this trend. Operators like Spread Co., Ltd. procure customized NPK ratios to reduce wastewater discharge and meet local environmental regulations. Japanese urban lettuce farms are driving the push for ultra-pure grades that leave no deposits in recirculating lines, boosting demand for premium water soluble fertilizer products.
Expansion of Drip Irrigation Acreage Worldwide
The global drip area reached 21.9 million ha in 2025 and continues to grow as water agencies in Saudi Arabia, Turkey, and India subsidize conversion from flood irrigation. Every new hectare needs roughly 250 kg of soluble salts each season, translating into structural volume growth for the water soluble fertilizer market. Israel's Ministry of Agriculture and Rural Development offers grants covering up to 40% of the costs for fertigation equipment and soluble fertilizers for new farms in the Negev and Arava regions. Neighboring countries such as Jordan and Egypt are adapting similar models for their arid-zone agricultural programs. Repeat orders follow soon after installation, once farmers observe higher yields and lower pumping costs.
Government Subsidies Promoting Water-Efficient Fertilizers
Government initiatives in Asia-Pacific and the Middle East are accelerating the transition toward water-efficient farming practices by financially supporting micro-irrigation infrastructure and precision nutrient management. Subsidies and incentive programs reduce upfront investment barriers for drip systems and compatible soluble fertilizers, encouraging wider adoption among small and medium-scale farmers. By improving affordability and expanding irrigated acreage under precision systems, these policies indirectly strengthen demand for water-soluble fertilizers and support medium-term market growth.
Restraints Impact Analysis*
| Restraint | (~) % Impact on CAGR Forecast | Geographic Relevance | Impact Timeline |
|---|---|---|---|
| High initial cost versus conventional granular fertilizers | –0.9% | Global, acute in Africa, and South Asia | Short term (≤ 2 years) |
| Logistical challenges in the bulk handling of soluble salts | –0.6% | South Asia, Southeast Asia, and Sub-Saharan Africa | Medium term (2-4 years) |
| Ion-specific salinity build-up in closed irrigation loops | –0.4% | Middle East and North America greenhouse clusters | Long term (≥ 4 years) |
| Volatility in chelated micronutrient raw material supply | –0.5% | Global, acute exposure in Europe and North America | Medium term (2-4 years) |
| Source: Mordor Intelligence | |||
High Initial Cost Versus Conventional Granular Fertilizers
Soluble grades are priced 15-25% higher per unit of nutrient than urea or Diammonium Phosphate (DAP), which restricts their adoption among smallholders who lack access to credit. In Nigeria, voucher schemes experienced low redemption rates as retailers predominantly stocked bagged granules. In India, the sachet strategy has reduced this gap; however, repeat purchases depend on achieving noticeable yield improvements during the first season. Additionally, the lack of awareness about the benefits of soluble fertilizers further limits their adoption among farmers. Logistical challenges in distributing soluble fertilizers to remote areas contribute to their limited availability and higher costs.
Ion-Specific Salinity Build-Up in Closed Irrigation Loops
Sodium and chloride accumulate in recirculating greenhouses, forcing periodic dump-and-refill events that raise water bills or require membrane filtration. Dutch trials found that tomato nutrient solutions had to be replaced after 8 weeks when chloride exceeded 150 mg L⁻¹ [2]Source: Elieser Dahan, “Greenhouse Vegetable Production in the Netherlands,” Wageningen University and Research, wur.nl. Reverse-osmosis units curb the problem but lift capital outlays by USD 2,500 per ha. The energy costs associated with Reverse Osmosis (RO) operations remain a significant challenge for smaller operators. The accumulation of sodium and chloride also impacts plant health, potentially reducing crop yields over time. The disposal of brine generated during reverse osmosis poses environmental concerns, requiring proper management to prevent ecological damage.
*Our forecasts treat driver/restraint impacts as directional, not additive. The impact forecasts reflect baseline growth, mix effects, and variable interactions.
Segment Analysis
By Type: Straight Formulations Accounted for the Largest Share
Straight accounted for the largest segment by type, capturing 53.1% of the water soluble fertilizer market share in 2025, underscoring its fit with existing injector hardware and straightforward cost-per-nutrient advantage. Potassium nitrate, monoammonium phosphate, and calcium nitrate form the backbone of field and orchard programs because they fully dissolve, allow precise dosing, and can be mixed on site to match soil-test prescriptions. The straight segment benefits from flexible dosing, enabling growers to adjust individual nutrient levels based on real-time soil test results, a critical practice in the water soluble fertilizer market. Although pricing sensitivity remains a concern, consistent adoption in field crops helps maintain high volumes.
The complex segment will be the fastest-growing, registering a 6.6% CAGR through 2031, and will narrow the gap as greenhouse managers trade a small premium for convenience and reduced risk of calcium-phosphate precipitation. In Florida, using complex fertilizers reduces labor compared with multiple straight injections, even though nutrient efficiency remains the same. The water soluble fertilizer market size for complex products is on track, driven by turf managers who welcome eight-week feeding cycles and ornamental nurseries that buy chelated micros by default.


By Application Mode: Fertigation Dominates Precision Delivery
Fertigation application accounted for the largest segment, representing 54.0% of the water-soluble fertilizer market share in 2025, expanding faster than foliar sprays because drip-equipped hectares keep rising and labor remains scarce. Split application via injectors reduces nitrogen losses by up to 30%, a critical advantage where regulators cap per-acre nutrient discharge. Cloud-connected schedulers that pull soil moisture, weather, and crop growth data into daily recipes reduce human error and increase confidence among first-time users. In many regions, fertigation is now mandatory to secure water permits, reinforcing a lasting preference for water soluble fertilizers.
Foliar application mode will be the fastest-growing segment, forecast to grow at a 6.5% CAGR through 2031. YaraVita micronutrients have seen increased use in European cereals, while Brazilian soybean growers have adopted boron-molybdenum mixes to address hidden deficiencies. The ability to provide rapid correction under weather stress positions foliar programs as a flexible complement, supporting the growth trajectory of the water-soluble fertilizer market. Advancements in foliar application technologies have improved nutrient uptake efficiency, further driving adoption, while the increasing focus on sustainable agricultural practices is contributing to the growing preference for foliar fertilizers.
By Crop Type: Field Crops Dominated the Market
Field crops dominated the market in 2025, accounting for 78.1% of the water soluble fertilizer market share. Cereals, oilseeds, and cotton occupy the bulk of irrigated land. Governments in China and Australia promote soluble nitrogen and potassium in center-pivot and lateral-move systems to cut volatilization under high temperatures. Water rights in the Murray-Darling Basin tie allocations to yield per megaliter, so cotton farms migrated to fertigation with calcium nitrate to lift water productivity. The water soluble fertilizer market share for field crops will grow gradually as protected vegetables expand, yet absolute tonnage will still increase with rising irrigated acreage.
Horticultural crops will be the fastest-growing segment, posting the highest 7.6% CAGR through 2031. The establishment of new greenhouses in the United Arab Emirates, Saudi Arabia, and Mexico has increased demand for fully soluble, chloride-free NPK fertilizers to maintain electrical conductivity and comply with export residue standards. Exporters of berries and leafy greens, operating continuous-harvest models, require a consistent nutrient supply, creating opportunities for specialty fertilizer blends with higher profit margins. Turf and ornamental applications remain a high-value niche, with a preference for controlled-release coated solubles that extend application intervals and reduce labor costs on golf courses.
Geography Analysis
The Asia-Pacific region is the largest, accounting for 41.3% of water soluble fertilizer market in 2025. Japanese greenhouse clusters in Aichi and Shizuoka utilize closed-loop systems that require ultra-pure formulations, ensuring efficient nutrient delivery and minimal waste. In Southeast Asia, palm estates initiated soluble boron projects in 2025 to address yield declines; however, logistical challenges to remote estates a continue to limit market penetration. These projects aim to enhance productivity and sustainability in the region's agricultural practices. With rising water tariffs and decreasing availability of arable land, the Asia-Pacific region remains a key market for water-soluble fertilizers, driven by the need for innovative and efficient agricultural solutions.
Middle East region is projected to deliver the strongest 7.1% CAGR through 2031. Saudi Arabia upgraded 48,000 ha of date palms to drip fertigation over 2 years, with nutrient recipes tailored to fruit set and ripening. The United Arab Emirates commissioned 10 ha of high-tech glasshouses producing 900 metric tons of tomatoes annually, using fully soluble NPK fertilizers. Turkey subsidized 120,000 ha of drip for cherries and hazelnuts in 2025, creating recurring demand for calcium nitrate. Regional players partner with Israeli technology exporters to bundle hardware, software, and soluble formulations, smoothing adoption for first-time users [3]Source: General Directorate of Water Management, “Drip Irrigation Subsidy Programs,” Ministry of Agriculture and Forestry Turkey, tarimorman.gov.tr.
North America demonstrates strong growth, primarily driven by the adoption of precision agriculture. In California, nutrient management mandates, coupled with carbon offset programs, incentivize farmers to implement validated soluble fertilizer regimens. Canadian grain producers leverage variable-rate technologies to optimize fertilizer applications, while Mexico’s greenhouse vegetable exports boost demand for premium blends tailored for Dutch-style structures. Comprehensive extension services and digital advisory platforms further enhance advanced usage patterns in the water soluble fertilizer market.

Competitive Landscape
The competitive landscape remains fragmented, with the five largest players, ICL Group Ltd, K+S Aktiengesellschaft, Sociedad Quimica y Minera de Chile SA, Yara International ASA, and Indian Farmers Fertiliser Cooperative Limited, accounting for only a limited share of global revenue in 2025. This fragmentation restricts price leadership by any single firm and creates opportunities for differentiated service models. Multinational companies expand their reach through global manufacturing footprints, while local specialists gain market share by offering crop-specific advisory services. The adoption of digital agronomy tools that convert sensor data into nutrient prescriptions has become critical for customer retention. Suppliers that integrate product sales with farm management applications achieve incremental margins, as growers increasingly value comprehensive support systems.
Nutrien has aligned its portfolio with John Deere equipment, enabling operators to adjust soluble application rates directly from tractor cabs. These initiatives highlight a shift from traditional product sales to solution-based models that combine hardware, data, and post-sale agronomy services. Early adopters of these integrated solutions report reduced input waste and improved yields, fostering loyalty to branded nutrient programs.
Regional producers, such as Kingenta in China and Coromandel International in India, are expanding by tailoring fertilizer formulations to local soil conditions and subsidy frameworks. Joint ventures, such as Haifa Group’s collaboration with Tata Chemicals, facilitate rapid market entry while distributing regulatory and distribution costs. Sustainability credentials are becoming increasingly important, as demonstrated by K+S Aktiengesellschaft securing European approval for biodegradable chelates that reduce environmental risks. As carbon-credit programs evolve, suppliers that document emission reductions within their nutrient platforms are well-positioned to command premium pricing.
Water Soluble Fertilizer Industry Leaders
ICL Group Ltd
K+S Aktiengesellschaft
Sociedad Quimica y Minera de Chile SA
Yara International ASA
Indian Farmers Fertiliser Cooperative Limited
- *Disclaimer: Major Players sorted in no particular order

Recent Industry Developments
- September 2025: Yara International ASA reported that its Indian subsidiary expects specialty fertilizer imports to rise 25% in 2025, reaching 135,000 -140,000 metric tons as it diversifies sourcing from Norway and the Middle East to offset tighter Chinese export control.
- February 2025: Haifa Chemicals Ltd. North West Europe (NWE) introduced Haifa Soluble DUO, a water soluble fertilizer designed to help growers increase calcium input without adding extra nitrogen, chlorides, or sulfates, or to reduce nitrogen without affecting the supply of essential nutrients like potassium and calcium. This product is specifically developed for fertigation, providing growers with an efficient and sustainable solution to enhance their cultivation practices.
- June 2023: ICL Group Ltd. has introduced the launch of a new range of foliar and fertigation solutions in North America under its Nova brand of water soluble fertilizers. The key products in this line include Nova FINISH™, Nova PULSE™, Nova ELEVATE™, and Nova FLOW™.


Global Water Soluble Fertilizer Market Report Scope
Water soluble fertilizers dissolve completely in water and provide essential nutrients to plants in a readily available form for quick absorption. They are applied directly to plants via drip irrigation or foliar application.
The report analyzes the water soluble fertilizer market across multiple segments, including type (complex and straight), application mode (fertigation and foliar), and crop type (field crops, horticultural crops, and turf and ornamental). It also provides a regional assessment covering Asia-Pacific, Europe, the Middle East, Africa, North America, and South America. Market estimates and forecasts are presented in both value (USD) and volume (metric tons).
| Complex | ||
| Straight | By Nutrient | Micronutrients |
| Nitrogenous | ||
| Phosphatic | ||
| Potassic | ||
| Secondary Macronutrients | ||
| Fertigation |
| Foliar |
| Field Crops |
| Horticultural Crops |
| Turf and Ornamental |
| Asia-Pacific | Australia |
| Bangladesh | |
| China | |
| India | |
| Indonesia | |
| Japan | |
| Pakistan | |
| Philippines | |
| Thailand | |
| Vietnam | |
| Rest of Asia-Pacific | |
| Europe | France |
| Germany | |
| Italy | |
| Netherlands | |
| Russia | |
| Spain | |
| Ukraine | |
| United Kingdom | |
| Rest of Europe | |
| Africa | South Africa |
| Nigeria | |
| Rest of Africa | |
| Middle East | Saudi Arabia |
| Turkey | |
| Rest of Middle East | |
| North America | Canada |
| Mexico | |
| United States | |
| Rest of North America | |
| South America | Argentina |
| Brazil | |
| Rest of South America |
| By Type | Complex | ||
| Straight | By Nutrient | Micronutrients | |
| Nitrogenous | |||
| Phosphatic | |||
| Potassic | |||
| Secondary Macronutrients | |||
| By Application Mode | Fertigation | ||
| Foliar | |||
| By Crop Type | Field Crops | ||
| Horticultural Crops | |||
| Turf and Ornamental | |||
| By Geography | Asia-Pacific | Australia | |
| Bangladesh | |||
| China | |||
| India | |||
| Indonesia | |||
| Japan | |||
| Pakistan | |||
| Philippines | |||
| Thailand | |||
| Vietnam | |||
| Rest of Asia-Pacific | |||
| Europe | France | ||
| Germany | |||
| Italy | |||
| Netherlands | |||
| Russia | |||
| Spain | |||
| Ukraine | |||
| United Kingdom | |||
| Rest of Europe | |||
| Africa | South Africa | ||
| Nigeria | |||
| Rest of Africa | |||
| Middle East | Saudi Arabia | ||
| Turkey | |||
| Rest of Middle East | |||
| North America | Canada | ||
| Mexico | |||
| United States | |||
| Rest of North America | |||
| South America | Argentina | ||
| Brazil | |||
| Rest of South America | |||


Market Definition
- MARKET ESTIMATION LEVEL - Market Estimations for various types of fertilizers has been done at the product-level and not at the nutrient-level.
- NUTRIENT TYPES COVERED - Primary Nutrients: N, P and K, Secondary Macronutrients: Ca, Mg and S, Micronutients: Zn, Mn, Cu, Fe, Mo, B, and Others
- AVERAGE NUTRIENT APPLICATION RATE - This refers to the average volume of nutrient consumed per hectare of farmland in each country.
- CROP TYPES COVERED - Field Crops: Cereals, Pulses, Oilseeds, and Fiber Crops Horticulture: Fruits, Vegetables, Plantation Crops and Spices, Turf Grass and Ornamentals
| Keyword | Definition |
|---|---|
| Fertilizer | Chemical substance applied to crops to ensure nutritional requirements, available in various forms such as granules, powders, liquid, water soluble, etc. |
| Specialty Fertilizer | Used for enhanced efficiency and nutrient availability applied through soil, foliar, and fertigation. Includes CRF, SRF, liquid fertilizer, and water soluble fertilizers. |
| Controlled-Release Fertilizers (CRF) | Coated with materials such as polymer, polymer-sulfur, and other materials such as resins to ensure nutrient availability to the crop for its entire life cycle. |
| Slow-Release Fertilizers (SRF) | Coated with materials such as sulfur, neem, etc., to ensure nutrient availability to the crop for a longer period. |
| Foliar Fertilizers | Consist of both liquid and water soluble fertilizers applied through foliar application. |
| Water-Soluble Fertilizers | Available in various forms including liquid, powder, etc., used in foliar and fertigation mode of fertilizer application. |
| Fertigation | Fertilizers applied through different irrigation systems such as drip irrigation, micro irrigation, sprinkler irrigation, etc. |
| Anhydrous Ammonia | Used as fertilizer, directly injected into the soil, available in gaseous liquid form. |
| Single Super Phosphate (SSP) | Phosphorus fertilizer containing only phosphorus which has lesser than or equal to 35%. |
| Triple Super Phosphate (TSP) | Phosphorus fertilizer containing only phosphorus greater than 35%. |
| Enhanced Efficiency Fertilizers | Fertilizers coated or treated with additional layers of various ingredients to make it more efficient compared to other fertilizers. |
| Conventional Fertilizer | Fertilizers applied to crops through traditional methods including broadcasting, row placement, ploughing soil placement, etc. |
| Chelated Micronutrients | Micronutrient fertilizers coated with chelating agents such as EDTA, EDDHA, DTPA, HEDTA, etc. |
| Liquid Fertilizers | Available in liquid form, majorly used for application of fertilizers to crops through foliar and fertigation. |


Research Methodology
Mordor Intelligence follows a four-step methodology in all our reports.
- Step-1: IDENTIFY KEY VARIABLES: In order to build a robust forecasting methodology, the variables and factors identified in Step-1 are tested against available historical market numbers. Through an iterative process, the variables required for market forecast are set and the model is built on the basis of these variables.
- Step-2: Build a Market Model: Market-size estimations for the forecast years are in nominal terms. Inflation is not a part of the pricing, and the average selling price (ASP) is kept constant throughout the forecast period for each country.
- Step-3: Validate and Finalize: In this important step, all market numbers, variables and analyst calls are validated through an extensive network of primary research experts from the market studied. The respondents are selected across levels and functions to generate a holistic picture of the market studied.
- Step-4: Research Outputs: Syndicated Reports, Custom Consulting Assignments, Databases & Subscription Platforms


