Market Overview
| Study Period | 2020 - 2030 |
|---|---|
| Base Year For Estimation | 2024 |
| Forecast Data Period | 2025 - 2030 |
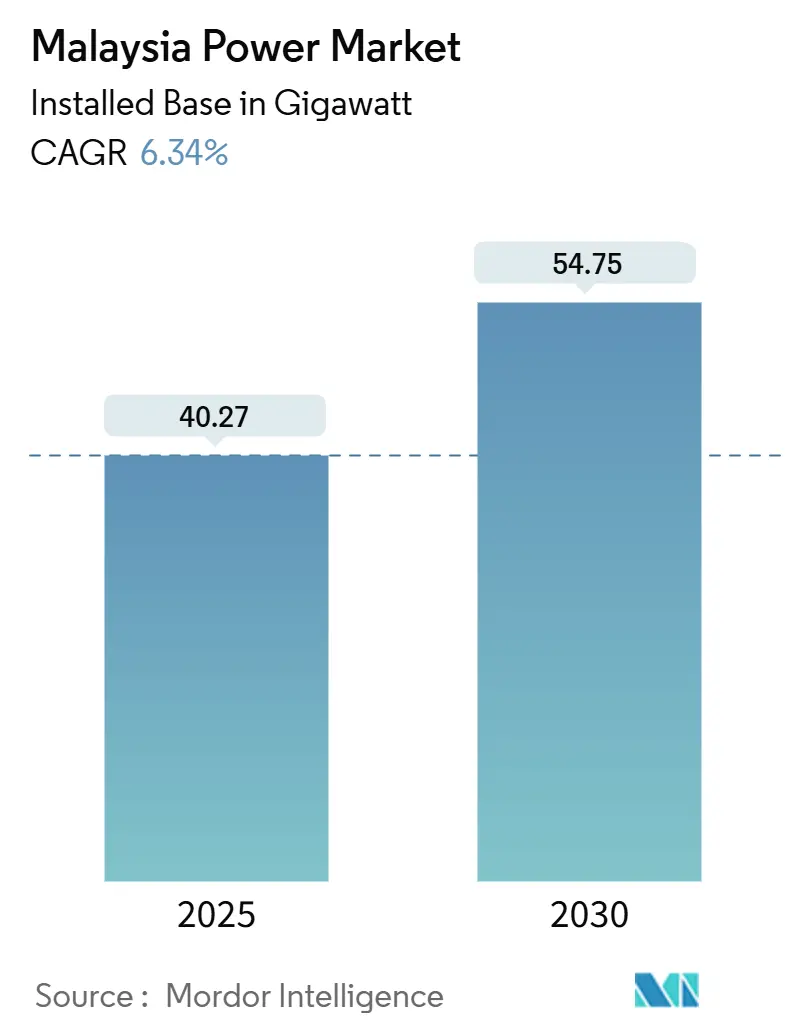
| Market Volume (2025) | 40.27 gigawatt |
| Market Volume (2030) | 54.75 gigawatt |
| Growth Rate (2025 - 2030) | 6.34% CAGR |
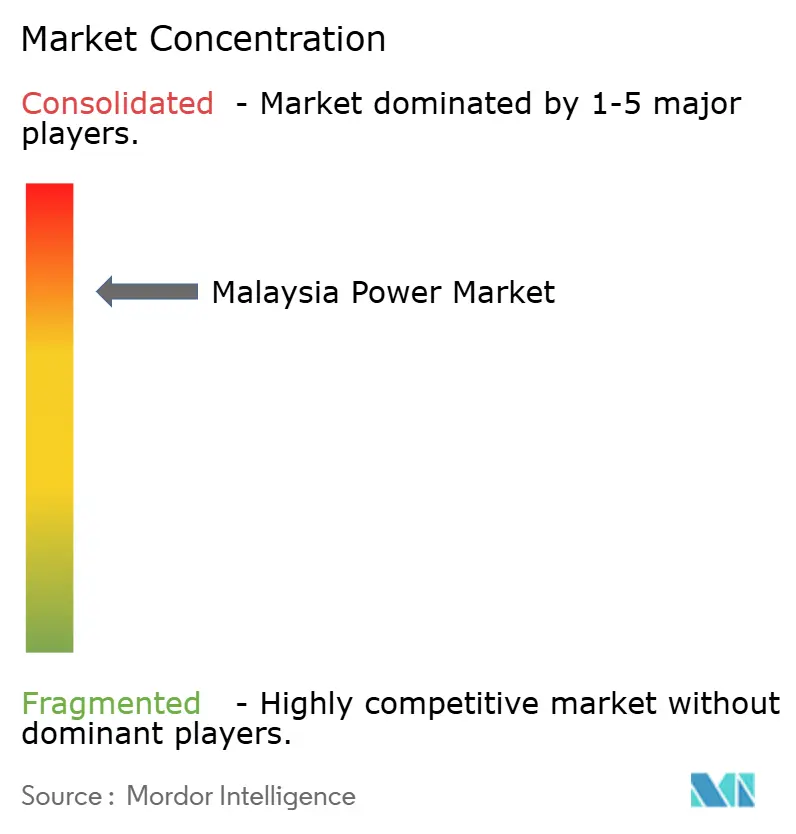
| Market Concentration | High |
Major Players
*Disclaimer: Major Players sorted in no particular order Image © Mordor Intelligence. Reuse requires attribution under CC BY 4.0. |
|
Malaysia Power Market Analysis by Mordor Intelligence
The Malaysia Power Market size in terms of installed base is expected to grow from 40.27 gigawatt in 2025 to 54.75 gigawatt by 2030, at a CAGR of 6.34% during the forecast period (2025-2030).
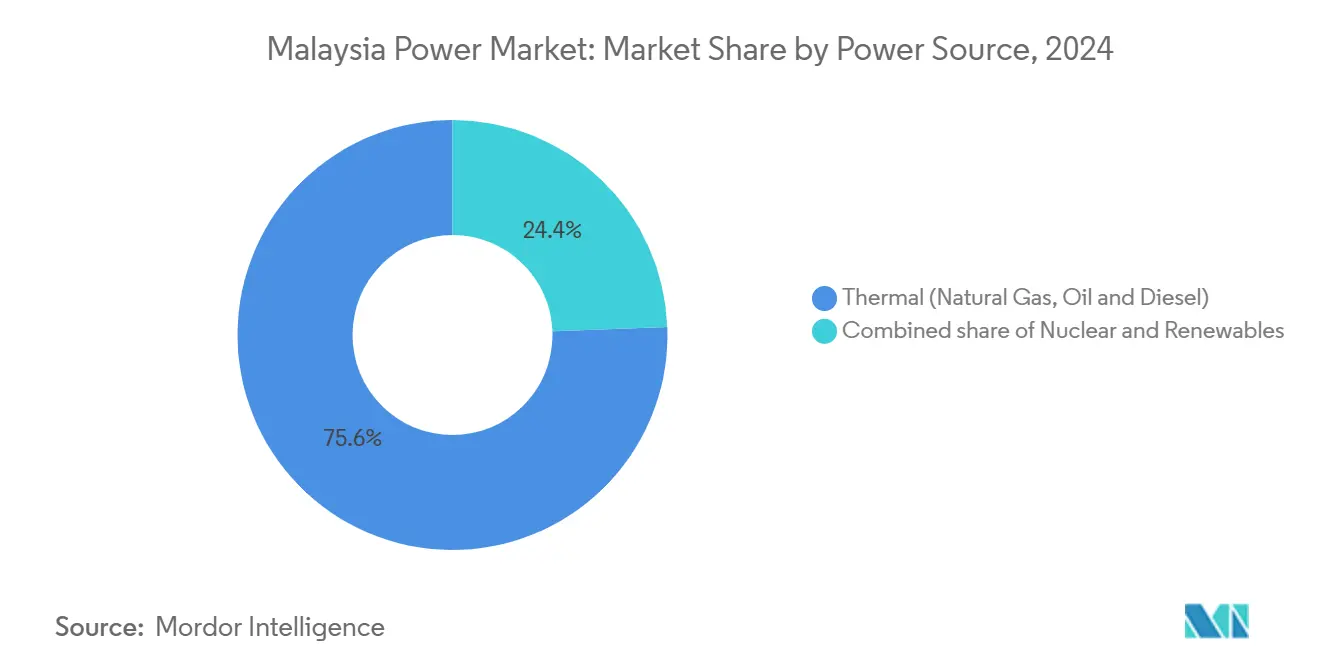
Hyperscale data-center clusters account for 11 GW of new load applications, a figure that has doubled in only two years and is forcing Tenaga Nasional Berhad (TNB) to accelerate generation and grid investments.(1)Tenaga Nasional Berhad, “Integrated Report 2024,” tnb.com.my While thermal technologies maintained 75.6% of the Malaysian power market in 2024, renewables are the fastest-growing through 2030 and will re-allocate capital toward solar, hydro, and battery projects at the expense of coal. Third-party access rules are shifting procurement power to corporate consumers, and tariff-subsidy reforms are aligning prices with cost recovery, which, in turn, improves the economics of distributed solar. Semiconductor fabrication and cloud infrastructure hubs in Penang, Selangor, and Johor underpin sustained industrial demand, yet natural-gas supply constraints and curtailment risk in weak East Malaysia grids serve as headline uncertainties.
Key Report Takeaways
- By power source, thermal generation held a 75.6% Malaysia power market share in 2024, while renewables are rising at a 23.8% CAGR through 2030.
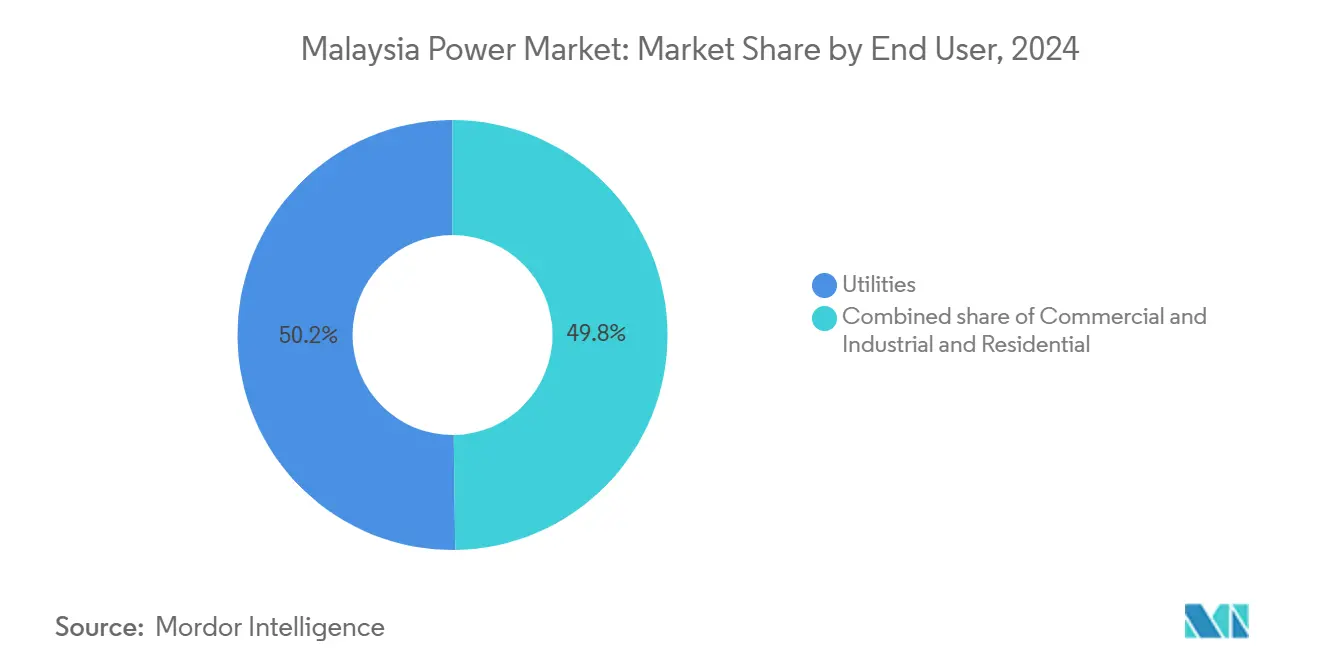
- By end user, utilities controlled 50.2% of installed capacity in 2024; the residential segment is projected to increase at a 17.5% CAGR through 2030.
Malaysia Power Market Trends and Insights
Drivers Impact Analysis
| Driver | (~) % Impact on CAGR Forecast | Geographic Relevance | Impact Timeline |
|---|---|---|---|
| Industrial electricity-demand surge | +1.80% | Peninsular Malaysia (Selangor, Penang, Johor industrial corridors); spillover to Iskandar Malaysia SEZ | Medium term (2-4 years) |
| Renewable-energy capacity targets (31% by 2025; 40% by 2035) | +2.10% | National, with concentration in Peninsular Malaysia LSS zones and Sarawak hydro expansion | Long term (≥ 4 years) |
| Aging coal-fleet retirements triggering replacement build-outs | +0.90% | Peninsular Malaysia (Kapar, Tanjung Bin, Jimah clusters); limited East Malaysia exposure | Medium term (2-4 years) |
| Grid-modernisation & T&D capex push | +0.70% | National, priority in Peninsular Malaysia urban load centers and East Malaysia inter-state links | Long term (≥ 4 years) |
| Corporate PPAs enabled by Third-Party Access rules | +1.20% | Peninsular Malaysia (data-center hubs in Johor, Selangor); early adoption in Penang free-trade zones | Short term (≤ 2 years) |
| Hyperscale data-centre clusters driving load pockets | +1.50% | Johor (Iskandar Malaysia), Selangor (Cyberjaya, Shah Alam), Penang (Bayan Lepas) | Short term (≤ 2 years) |
| Source: Mordor Intelligence | |||
Industrial Electricity-Demand Surge
Infineon’s EUR 2 billion silicon-carbide fab in Kulim exemplifies the structural shift from legacy petrochemicals toward precision manufacturing that now underpins the Malaysian power market.(2) Infineon Technologies, “Infineon Expands SiC Production in Kulim,” infineon.com TNB has confirmed that data-center applications alone total 11 GW, compelling the utility to reserve 30% of its RM 16.3 billion contingent capital expenditure for unanticipated load growth. Industrial demand is expected to maintain half of total consumption through 2030, but the composition tilts toward semiconductor and cloud workloads that require low-carbon electricity. Any lapse in generation or transmission build-out risks divesting these investments to regional competitors with more advanced renewable procurement frameworks. Consequently, local authorities are fast-tracking substation upgrades and incentivizing battery storage to keep reserve margins adequate.
Renewable-Energy Capacity Targets
The National Energy Transition Roadmap sets milestones of 31% renewable capacity by 2025 and 40% by 2035. Achieving these goals requires annual additions near 1.5 GW, notably faster than historical build-out rates.(3)Malaysian Investment Development Authority, “National Energy Transition Roadmap,” mida.gov.my Large-Scale Solar Round 5 allocated 2 GW in 2024 to Malaysian-controlled bidders, favoring domestic content capture but narrowing the developer field. TNB’s 2.5 GW floating-solar program across hydro reservoirs leverages existing transmission corridors and minimizes land-use conflicts, while Sarawak Energy’s 7,300 MW hydro fleet positions East Malaysia as a potential clean-power exporter once cross-border interconnections advance. The 70% renewable aspiration by 2050 implies near-zero coal, with hydrogen-ready combined-cycle gas turbines providing a bridge technology, albeit with fuel-supply uncertainties.
Aging Coal-Fleet Retirements Triggering Replacement Build-Outs
Malaysia plans to retire 9.1 GW of coal capacity between 2024 and 2030, eliminating all coal plants by 2044. Replacement projects favor natural-gas hybrids and floating solar rather than like-for-like builds, yet delays at Pulau Indah and Gurun underline schedule risk. Four combined-cycle units totaling 2.2 GW had already closed by 2023, and the 500 MW Miri gas plant is vital to offset closures once it enters service in 2027. The coal phase-out aligns with decarbonization targets yet heightens reliance on gas and hydrogen supply chains, placing risk on fuel price volatility and LNG import costs. Independent producers that commission gas or renewable capacity ahead of schedule can lock in favorable tariffs, whereas coal-centric operators face growing stranded-asset exposure.
Hyperscale Data-Center Clusters Driving Load Pockets
Bridge Data Centres contracted 150 MWp of renewable power through the Corporate Renewable Energy Supply Scheme, illustrating how hyperscalers bypass traditional utility agreements for direct green procurement. Johor’s Iskandar Malaysia and Selangor’s Cyberjaya have emerged as preferred locations due to proximity to Singapore and competitive land prices. The 24/7 uptime standard demands reliable generation, prompting TNB to bundle battery storage into new substations and upgrade transmission earlier than envisaged. Concentrated data-center demand may reach 20% of national installed capacity by 2035, generating both opportunity and stress for grid operators. Third-party access rules thereby fragment utility revenue streams but improve Malaysia’s standing against regional digital hubs.
Restraints Impact Analysis
| Restraint | (~) % Impact on CAGR Forecast | Geographic Relevance | Impact Timeline |
|---|---|---|---|
| Natural-gas supply constraints & price volatility | -1.10% | Peninsular Malaysia (gas-dependent generation clusters); indirect impact on East Malaysia via LNG imports | Medium term (2-4 years) |
| Electricity-tariff subsidy reforms | -0.60% | National, acute for commercial & industrial consumers in Peninsular Malaysia | Short term (≤ 2 years) |
| Land & permitting hurdles for utility-scale RE | -0.80% | Peninsular Malaysia (competing land use in Kedah, Perak agricultural zones); East Malaysia (indigenous land rights) | Long term (≥ 4 years) |
| Curtailment risk in East-Malaysia weak grids | -0.50% | Sarawak and Sabah (isolated grids with limited inter-state transmission) | Medium term (2-4 years) |
| Source: Mordor Intelligence | |||
Natural-Gas Supply Constraints and Price Volatility
Domestic gas production has plateaued, and Petronas prioritizes LNG exports, resulting in periodic fuel shortages that force generators to switch to costlier diesel back-up.(4)Petroliam Nasional Berhad, “LNG Outlook 2025,” petronas.comWhen global LNG prices spiked in 2022, Malaysia's tariff-pass-through mechanism lagged fuel costs, compressing IPP margins. Planned hydrogen-ready turbines assume green hydrogen will gradually displace gas, yet industrial-scale hydrogen infrastructure remains nascent. Unless coordinated storage, import, and pricing reforms materialize, gas exposure will weigh on Malaysia's power market expansion speed by suppressing investor appetite for flexible thermal assets.
Electricity-Tariff Subsidy Reforms
The government has started phasing out cross-subsidies, aligning tariffs with generation costs under the Incentive-Based Regulation framework. Industrial consumers now bear a larger share of fuel-price risk, which tightens manufacturing margins but bolsters the business case for onsite solar and storage. Although residential tariffs remain partially shielded, subsidy rationalization frees fiscal space for grid upgrades and renewable incentives. In the short term, however, higher bills may delay adoption of electric heating and mobility applications, tempering demand growth.
Segment Analysis
By Power Source: Renewables Reconfigure Thermal Dominance
The Malaysian power market size for renewables is projected to rise at a 23.8% CAGR, eating into thermal technology’s 75.6% Malaysia power market share in Malaysia in 2024. Solar leads the renewable surge, propelled by TNB’s 2.5 GW floating-solar roll-out and 2 GW of allocated capacity under Large-Scale Solar Round 5. Hydro remains pivotal in East Malaysia, yet expansion is bound by environmental assessment and community engagement. Coal will decline sharply, with 9.1 GW scheduled to retire by 2030, while hydrogen-ready gas turbines pick up reserve margins and prepare the grid for future fuel transitions. Battery storage adoption becomes a gating factor: adequate storage unlocks higher solar penetration, while shortfalls would keep mid-merit gas plants online longer.
Solar’s levelized cost fell below marginal gas generation in 2024, even before storage, encouraging IPPs to stack corporate PPAs on top of utility tenders. Hydro assets in Sarawak supply near-baseload output at low variable cost, positioning the state as a potential exporter pending interconnection. Wind and geothermal remain exploratory, and biomass expansion slows due to rising feedstock prices. The evolving mix will influence dispatch order, emissions intensity, and investment allocation across the Malaysia power market.
Note: Segment shares of all individual segments available upon report purchase
Get Detailed Market Forecasts at the Most Granular Levels
Download PDF
By End User: Residential Uptake Narrows Utility Lead
Utilities held 50.2% of capacity in 2024, yet residential installations under Net Energy Metering Rakyat grew at 17.5% CAGR and exhausted the 350 MW quota months ahead of schedule.(5)Sustainable Energy Development Authority, “NEM Statistics Update 2025,” seda.gov.my The Solar for Rakyat Incentive Scheme accelerates this trajectory by reimbursing up to MYR 4,000 per installation, pushing daily applications from 100 to 150. Commercial and industrial buyers increasingly procure energy directly from IPPs, leveraging Third-Party Access to secure cost and sustainability advantages. As more factories and data centers receive green power via private wires or wheeling arrangements, utility energy sales retreat, but network-service revenue rises.
Further residential gains hinge on low-interest financing and battery price declines, while industrial offtake depends on transparent wheeling fees and grid-connection timelines. Utilities respond by investing in advanced metering and distributed-energy management systems, which open data-driven service opportunities such as demand response. Altogether, shifting end-user behavior reallocates capital toward smaller, decentralized assets and hastens the transformation of the Malaysia power market size distribution across customer segments.
Note: Segment shares of all individual segments available upon report purchase
Get Detailed Market Forecasts at the Most Granular Levels
Download PDF
Geography Analysis
Peninsular Malaysia houses the most installed capacity, backed by an interconnected transmission grid that supports multi-state dispatch. TNB allocates over RM 42.9 billion to modernize lines in Selangor, Johor, and Penang, where semiconductor and cloud clusters generate concentrated load. The peninsula’s aggressive coal retirement schedule requires swift replacement by hydrogen-ready gas turbines and utility-scale solar, while floating solar leverages existing reservoirs to reduce land conflict. Industrial corridors in Iskandar Malaysia and Klang Valley draw foreign direct investment predicated on reliable, low-carbon electricity, prompting battery storage and advanced metering deployments ahead of previous plans.
East Malaysia operates two isolated grids. Sarawak’s hydro-dominant portfolio supplies low-carbon energy but faces export bottlenecks, though proposed interconnections with Brunei and Kalimantan could unlock new revenue once regulatory frameworks align. Sabah’s grid remains weaker, leading to curtailment risk that the 400 MWh battery project only partly addresses. New gas capacity at Kimanis improves resilience, yet solar and wind developers still struggle to obtain bankable PPAs due to uncertain offtake. Microgrids and distributed storage are emerging as cost-effective alternatives for remote communities.
Regional disparity shapes investment priorities. Peninsular Malaysia attracts most corporate procurement and utility-scale projects. East Malaysia’s hydro surplus creates potential export advantages but requires capital-intensive transmission. Policymakers weigh nationwide uniform tariff goals against the practicalities of differentiated regional strategies to maximize the Malaysia power market’s economic potential.
Competitive Landscape
The Malaysia power market features high concentration. TNB controls transmission and distribution in Peninsular Malaysia, yet IPPs such as Malakoff, YTL Power, and Edra Power compete vigorously for generation contracts. These incumbents pivot toward solar and storage as coal assets near retirement. New-entrant developers, including Solarvest and Cypark, win Large-Scale Solar Round 5 packages by meeting local-equity criteria and offering cost-competitive bids. Foreign suppliers, JinkoSolar, First Solar, Huawei, and Siemens, localize assembly to qualify for domestic content preferences embedded in tenders, mitigating supply-chain and tariff risks.
Strategic moves reflect a pivot toward flexibility. TNB’s 2.5 GW floating-solar and 400 MWh battery plans reposition the utility as a facilitator of renewable integration rather than solely a baseload provider. Solarvest secured multiple utility-scale contracts while partnering with battery integrators to bid hybrid plants that hedge intermittency. Petronas explores green-hydrogen pilots with TNB, leveraging its LNG portfolio to diversify future fuels. Competitive differentiation increasingly rests on technology adoption: firms that deploy predictive maintenance or curtailment-management software gain cost and availability advantages that translate into lower tariff bids.
White-space opportunity centers on storage integration, hydrogen-ready turbines, and floating-solar engineering. Early movers can lock in long-term service agreements that provide recurring revenue as the Malaysia power market migrates toward a flexibility-first dispatch paradigm. Market participants that cling to legacy thermal paradigms face escalating stranded-asset risk as policy momentum advances toward renewables and carbon reduction.
Malaysia Power Industry Leaders
-
Tenaga Nasional Berhad
-
Sarawak Energy Berhad
-
Sabah Electricity Sdn Bhd (SESB)
-
Edra Power Holdings
-
Malakoff Corporation Berhad
- *Disclaimer: Major Players sorted in no particular order
Need More Details on Market Players and Competitors?
Download PDF
Recent Industry Developments
- May 2025: Sarawak and Siemens are in the exploratory phase of a potential strategic partnership for large-scale green hydrogen production. This collaboration has not yet resulted in a finalized formal agreement. The Sarawak government, through Sarawak Energy Bhd and the Ministry of Utility and Telecommunication, is currently evaluating possible avenues for future cooperation with Siemens Energy.
- April 2025: Malaysia and the UK launched a collaboration on smart-grid deployment and digital-infrastructure modernisation.
- February 2025: Sarawak outlined plans to quadruple renewable capacity by 2035, adding floating solar and new hydro dams.
- January 2025: Acwa Power committed up to USD 10 billion to develop 12.5 GW of renewables, hydrogen, and desalination capacity by 2040 in partnership with TNB, Terengganu Inc, and UEM Lestra.
Malaysia Power Market Report Scope
Power generation is the production of electricity from sources such as fossil fuels, nuclear power plants, hydroelectric dams (except those with pumped storage), geothermal energy, solar energy, biofuels, wind energy, etc. It comprises the electricity generated in combined heat and power and electricity-only facilities.
The Malaysia power market report is segmented by Power Source, End User, and T&D Voltage Level (qualitative analysis only). By Power Source, the market is segmented into thermal, nuclear, and renewables. By end user, the market is segmented by utilities, commercial and industrial, and residential, and by T&D voltage level, the market is segmented by high-voltage transmission, sub-transmission, medium-voltage distribution, and Low-Voltage Distribution. The report also covers the market size and forecasts for Malaysia.
For each segment, the market sizing and forecasts have been done based on the installed capacity (GW).
By Power Source
| Thermal (Coal, Natural Gas, Oil and Diesel) |
| Nuclear |
| Renewables (Solar, Wind, Hydro, Geothermal, Biomass & Waste, Tidal) |
By End User
| Utilities |
| Commercial and Industrial |
| Residential |
By T&D Voltage Level (Qualitative Analysis only)
| High-Voltage Transmission (Above 230 kV) |
| Sub-Transmission (69 to 161 kV) |
| Medium-Voltage Distribution (13.2 to 34.5 kV) |
| Low-Voltage Distribution (Up to 1 kV) |
| By Power Source | Thermal (Coal, Natural Gas, Oil and Diesel) |
| Nuclear | |
| Renewables (Solar, Wind, Hydro, Geothermal, Biomass & Waste, Tidal) | |
| By End User | Utilities |
| Commercial and Industrial | |
| Residential | |
| By T&D Voltage Level (Qualitative Analysis only) | High-Voltage Transmission (Above 230 kV) |
| Sub-Transmission (69 to 161 kV) | |
| Medium-Voltage Distribution (13.2 to 34.5 kV) | |
| Low-Voltage Distribution (Up to 1 kV) |
Need A Different Region or Segment?
Customize Now
Key Questions Answered in the Report
What is the current installed capacity in the Malaysia power market?
Installed capacity reached 40.27 GW in 2025 and is forecast to grow to 54.75 GW by 2030.
How fast are renewables growing within Malaysia’s power mix?
Renewable capacity is expanding at a 23.8% CAGR through 2030, rapidly eroding coal’s share.
Which regions are attracting most new industrial electricity demand?
Penang, Selangor, and Johor host semiconductor and data-center hubs that drive incremental load.
How does Third-Party Access influence corporate electricity procurement?
It lets large users bypass utility contracts and secure long-term renewable PPAs with independent generators.
What role will hydrogen-ready gas turbines play in future generation?
They replace retiring coal plants while preparing for green-hydrogen blends once supply becomes viable.
How significant is battery storage to Malaysia’s grid reliability goals?
Utility projects totaling 400 MWh are underway, anchoring flexibility and enabling deeper solar penetration.
Page last updated on:


