Market Overview
| Study Period | 2020 - 2031 |
|---|---|
| Forecast Data Period | 2026 - 2031 |
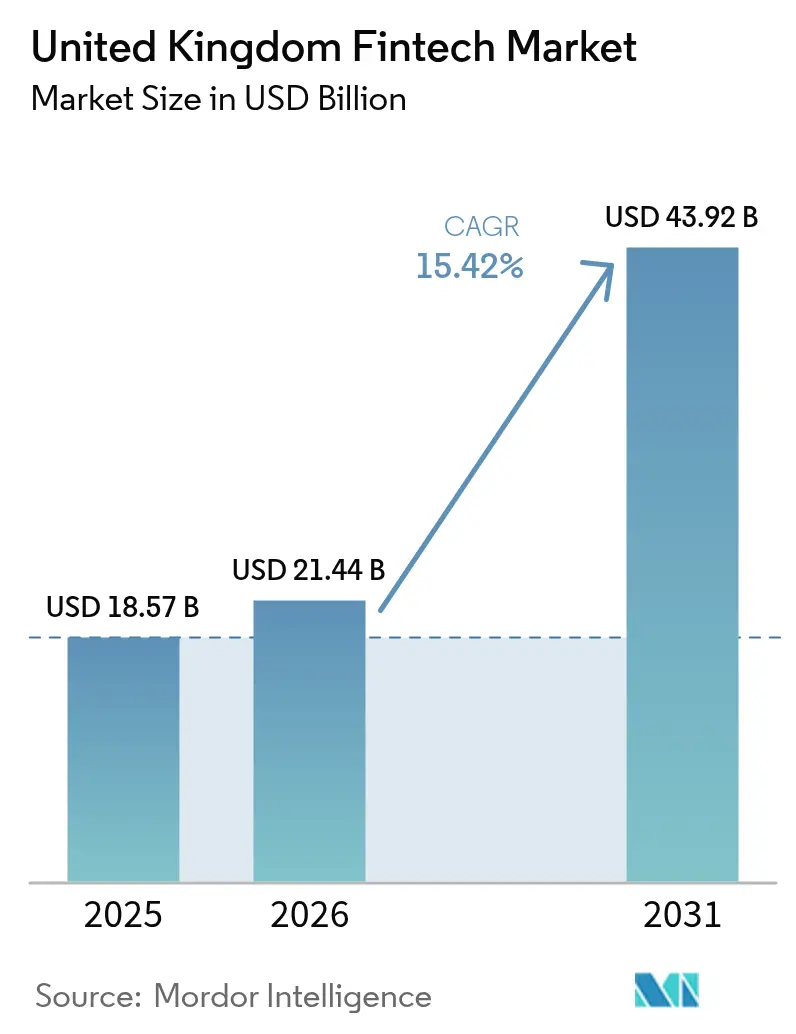
| Base Year Market Size (2025) | USD 18.57 Billion |
| Market Size (2026) | USD 21.44 Billion |
| Market Size (2031) | USD 43.92 Billion |
| Growth Rate (2026 - 2031) | 15.42% CAGR |
| Market Concentration | Medium |
Major Players *Disclaimer: Major Players sorted in no particular order Image © Mordor Intelligence. Reuse requires attribution under CC BY 4.0. | |
United Kingdom Fintech Market Analysis by Mordor Intelligence
United Kingdom fintech market size in 2026 is estimated at USD 21.44 billion, growing from 2025 value of USD 18.57 billion with 2031 projections showing USD 43.92 billion, growing at 15.42% CAGR over 2026-2031. Open banking adoption, real-time payments, and a supportive regulatory sandbox framework are expanding addressable demand even as macro-uncertainty reshapes funding patterns. London retains its magnetic pull for venture capital, yet regional hubs in Manchester and Edinburgh are capturing specialized niches. Neobanks move from growth to profitability, while embedded finance deepens retailer-fintech partnerships. Technology adoption, especially artificial intelligence, underpins cost-efficient scale-ups and positions the United Kingdom fintech market for sustained double-digit growth.
Key Report Takeaways
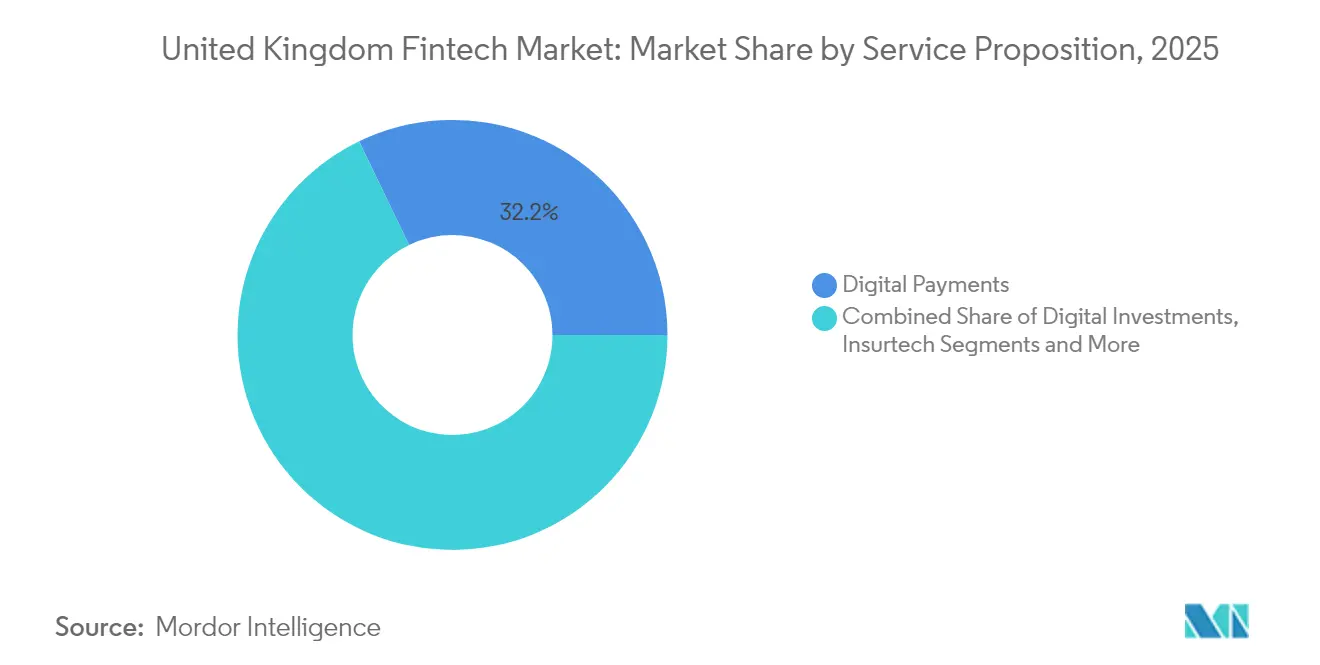
- By service proposition, digital payments held 32.15% of the United Kingdom fintech market share in 2025, whereas neobanking is projected to expand at a 19.18% CAGR through 2031.
- By end user, the business segment commanded 57.55% of the United Kingdom fintech market size in 2025 and is forecast to grow at 16.62% CAGR between 2026-2031.
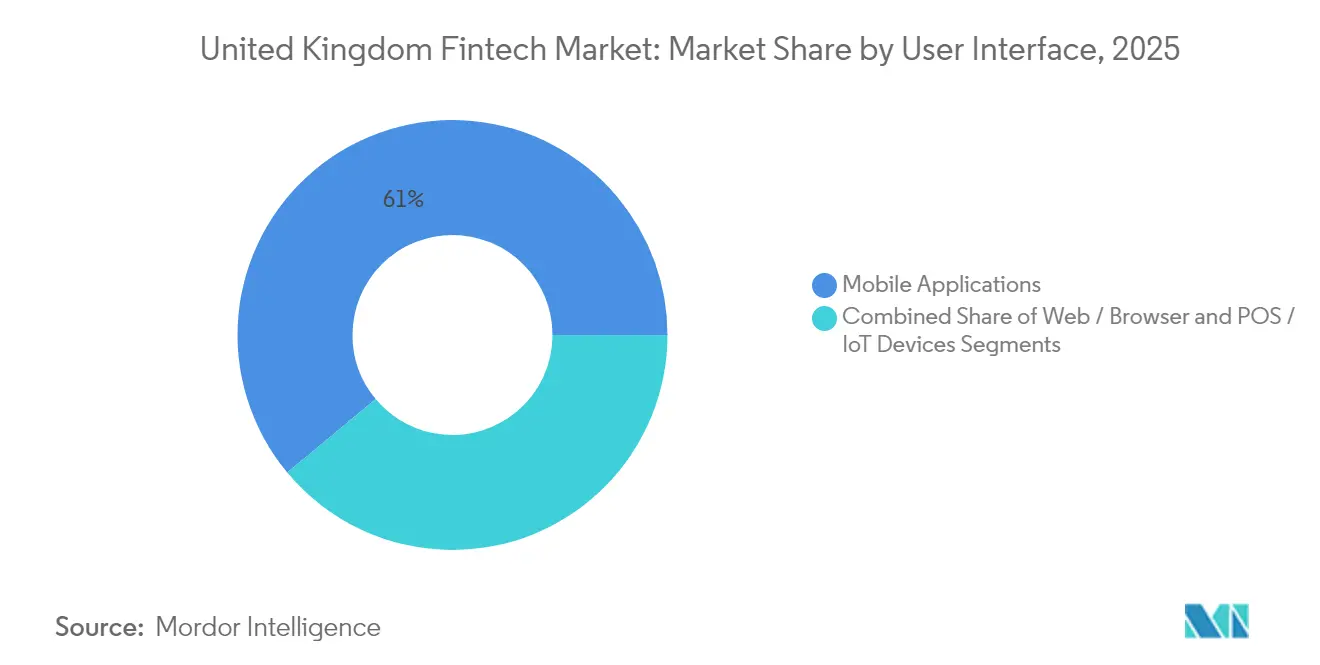
- By user interface, the mobile applications segment captured 61.05% of the United Kingdom fintech market share in 2025 and is anticipated to advance at an 18.55% CAGR to 2031.
Note: Market size and forecast figures in this report are generated using Mordor Intelligence’s proprietary estimation framework, updated with the latest available data and insights as of 2026.
United Kingdom Fintech Market Trends and Insights
Drivers Impact Analysis*
| Drivers | (~) % Impact on CAGR Forecast | Geographic Relevance | Impact Timeline |
|---|---|---|---|
| Open banking rollout | +3.2% | National | Medium term (2-4 years) |
| Post-Brexit regulatory sandboxes | +2.5% | National (London focus) | Medium term (2-4 years) |
| Faster payments infrastructure | +2.8% | National | Short term (≤ 2 years) |
| London talent & VC density | +3.8% | London; ripple to Manchester, Edinburgh | Long term (≥ 4 years) |
| SME demand for alternative lending | +2.1% | Regional markets | Medium term (2-4 years) |
| Embedded finance partnerships | +1.3% | National urban centres | Short term (≤ 2 years) |
| Source: Mordor Intelligence | |||
Open Banking Regulations Accelerate API-Based Payments
Seven million UK consumers actively used open-banking services in 2024, unlocking standardized API access for third-party providers. Mandatory data-sharing spurred a 30% rise in account-to-account transactions and enabled niche payment firms to bypass incumbent card networks. The regulatory design, championed by the Financial Conduct Authority (FCA), positions the United Kingdom fintech market as a benchmark for competition-led innovation. Payment providers now integrate real-time settlement and identity verification, lowering merchant fees and fuelling broader embedded-finance use cases. Elevated interoperability also reduces customer switching friction, intensifying competitive pressure on legacy processors.
Post-Brexit Regulatory Sandboxes Attract Global Entrants
Since 2016, the FCA sandbox has admitted 55 firms, and the Digital Securities Sandbox opened to 12 additional international participants in March 2025. Controlled testing cuts compliance costs and time-to-market, drawing firms from Singapore and the United States. A new AI-testing corridor, announced in January 2025, broadens the scope to algorithmic underwriting and autonomous trading. Cross-border memoranda between the FCA and Canadian, Australian, and Japanese regulators streamline passporting, thereby anchoring the United Kingdom fintech market as a launchpad for multi-jurisdictional scale-ups[1]Financial Conduct Authority, “Strengthening our Approach to Financial Promotions,” fca.org.uk.
Nationwide Faster Payments & RTP Infrastructure Boost Digital Wallet Uptake
Real-time payment rails settled 58% of domestic electronic transactions in 2024. The National Payments Vision, released in November 2024, reinforces innovation, competition, and security goals, setting 2025 deadlines for retail-payment upgrades. Digital wallets are now used by 42% of UK adults, with instant settlement reducing chargeback risk for merchants and enhancing liquidity for consumers. Fraud-prevention layers embedded in the Faster Payments architecture improve trust and underpin an expected 18.8% CAGR for mobile-application interfaces. These dynamics enlarge the United Kingdom fintech market size for account-to-account payment providers[2]Payment Systems Regulator, “National Payments Vision 2024,” psr.org.uk.
London Talent Pool and Venture Capital Density Catalyze Scale-Ups
London produced £19.7 million in gross value added from 22 fintech wins in Q3 2024/25, evidence of clustering benefits. The city led Europe with six new unicorns in 2024 and surpassed Silicon Valley on total exits. Average round size reached USD 71.4 million, underscoring capital depth. Government initiatives such as the Unicorn Council and the JAX Hub facilitate US market entry, while proximity to regulators shortens feedback loops. These factors enlarge the investable universe, sustaining the United Kingdom fintech market leadership even amid global funding volatility.
Restraints Impact Analysis*
| Restraints | (~) % Impact on CAGR Forecast | Geographic Relevance | Impact Timeline |
|---|---|---|---|
| FCA scrutiny of promotions | -1.8% | National | Short term (≤ 2 years) |
| Rising cloud-compliance costs | -1.2% | National | Medium term (2-4 years) |
| Digital fraud & APP-scam losses | -2.4% | National urban centres | Short term (≤ 2 years) |
| Late-stage funding contraction | -2.9% | London focus | Medium term (2-4 years) |
| Source: Mordor Intelligence | |||
Rising Cloud-Compliance Costs Under UK GDPR and Resilience Rules
Full implementation of operational-resilience mandates by March 2025 requires granular mapping of important business services and severe-but-plausible scenario tests. Fintechs leveraging hyperscale cloud providers must evidence end-to-end controls, increasing audit frequency, and vendor-management expense. The Digital Operational Resilience Act, effective January 2025, layers additional ICT-risk reporting on top of UK GDPR obligations. Smaller firms face trade-offs between feature development and compliance, changing cost curves across the United Kingdom fintech market.
Digital Fraud and APP-Scam Losses Dent Consumer Trust
Authorized push-payment fraud rose sharply in 2024, prompting mandatory reimbursement rules and heavier liability for payment providers. Neobanks with real-time onboarding are particularly exposed, necessitating larger fraud-prevention budgets. Consumer confidence dips with negative headlines, lengthening acquisition funnels, and elevating churn. Enhanced biometrics and machine-learning models mitigate losses yet inflate unit-economics during payback periods. Trust erosion, therefore, slows adoption momentum inside the United Kingdom fintech market[3]United Kingdom Finance, “Fraud the Facts 2025,” ukfinance.org.uk.
*Our updated forecasts treat driver/restraint impacts as directional, not additive. The revised impact forecasts reflect baseline growth, mix effects, and variable interactions.
Segment Analysis
By Service Proposition: Neobanking Recasts Transaction Economics
Digital Payments retained 32.15% of the United Kingdom fintech market size in 2025, yet Neobanking posted the fastest outlook with a 19.18% CAGR to 2031. Record profitability at Revolut and Starling demonstrates viable unit-economics once scale is reached. Revolut secured a UK banking licence in July 2024, expanding deposit-funded margins and improving product cross-sell. Digital Lending to SMEs accelerates as regional credit gaps broaden. Insurtech deploys data analytics to refine underwriting, while Digital Investments benefit from AI-led portfolio visualization. The Bank of England’s AI Consortium, launched in September 2024, catalyzes algorithmic innovation across propositions, adding depth to the United Kingdom fintech market.
Customer acquisition costs for neobanks fall as embedded-finance partners bundle accounts inside retail checkout journeys. Profitability inflection points align with higher interchange income and fee-based revenues, such as crypto trading. Alternative lenders leverage open-banking data for cash-flow underwriting, cutting decision times for SMEs. Wealth-tech providers democratize fractional investing, while Insurtech firms automate claims, raising user satisfaction. Collectively, these shifts underline the structural re-rating occurring in the United Kingdom fintech industry.
Note: Segment shares of all individual segments available upon report purchase
Get Detailed Market Forecasts at the Most Granular Levels
Download PDF
By End User: Businesses Drive Revenue Scale
The Business segment accounted for 57.55% of the United Kingdom fintech market share in 2025 and is set to advance at a 16.62% CAGR. SMEs embrace digital bookkeeping, invoice financing, and expense-management apps to offset reduced branch coverage by traditional lenders. Mobile-first business current accounts simplify treasury functions, while embedded credit at the point of sale shortens cash-conversion cycles. Equity funding remains stable, but debt facilities expand through securitized loan books backed by institutional investors.
Retail users, especially the 18-34 cohort, adopt multi-currency wallets, micro-investing, and BNPL, driving experiential differentiation. Embedded finance is forecast to supply 20-25% of retail banking sales by 2030 across Europe, reinforcing cross-industry partnerships. Fintech-retailer collaborations collect behavioral data, powering personalized offers that heighten lifetime value. Competitive intensity rises as incumbent banks re-platform and launch their own digital offshoots, broadening the United Kingdom fintech industry’s consumer reach.
By User Interface: Mobile Applications Command Loyalty
Mobile Applications held 61.05% of the United Kingdom fintech market size in 2025 and are projected to compound at 18.55% CAGR. Biometric login, personalized notifications, and AI chat assistants cement stickiness. SMEs manage payroll, invoicing, and tax compliance from smartphones, reducing back-office overhead. Browser-based interfaces remain vital for wealth-management dashboards requiring expansive data views. POS and IoT endpoints integrate inventory, loyalty, and payments, sharpening retailer analytics and elevating customer convenience.
Omnichannel continuity becomes a baseline expectation. Users start a loan application on mobile, refine terms on the web, and finalize agreements in-store. Voice interfaces and wearables emerge as adjunct channels, yet smartphones retain primacy. This platform hierarchy shapes design choices for market entrants and sustains innovation flywheels within the United Kingdom fintech market.
Note: Segment shares of all individual segments available upon report purchase
Get Detailed Market Forecasts at the Most Granular Levels
Download PDF
Geography Analysis
London produced £19.7 million in fintech gross value added from 22 competitive wins during Q3 2024/25, reflecting unrivalled density of capital, talent, and regulatory proximity. The city hosted 37 fintech unicorns and attracted USD 3.6 billion in investment in 2024, reinforcing its global stature. Access to policymakers enables iterative feedback on open-banking standards and digital-asset regimes, lowering policy-risk premiums for innovators. London’s multicultural workforce further supports international go-to-market strategies, anchoring the United Kingdom fintech market leadership.
Regional ecosystems in Manchester, Edinburgh, and Glasgow gain traction, underpinned by university research strength and targeted accelerator programs. The British Business Bank’s Community ENABLE Funding provides guarantee lines that unlock cheaper wholesale funding for regional lenders. Fintechs in Scotland tap wealth-management heritage to pilot robo-advice tools, while Northern England emphasizes data-analytics applications. The diversification eases geographic concentration risk and expands the United Kingdom fintech market size beyond the capital.
Internationally, the United Kingdom captures nearly half of EMEA fintech funding and shapes global standards through early adoption of open banking and proportionate regulation. Bilateral corridors such as the JAX Hub streamline US market expansion, while memoranda with Singapore and Australia foster regulatory equivalence. Such cooperation widens export possibilities for UK-based platforms, cementing the United Kingdom fintech market as a bridge between North America, Europe, and Asia-Pacific.
Competitive Landscape
Competition exhibits a barbell pattern: a handful of scaled champions share the top tier while numerous specialists occupy niches. Revolut leads neobanking with a USD 45 billion valuation, ahead of Monzo at USD 5.2 billion and Starling at USD 3.3 billion. Complaint volumes—3,397 for Revolut and 3,396 for Monzo in H2 2024—highlight operational challenges even for leaders. Payments concentrate around a few large processors, whereas lending remains more fragmented due to regional variations in credit demand.
Profitability over growth became the dominant theme in 2024. Larger fintechs monetize existing bases via subscription tiers and B2B services, while smaller firms consolidate or pivot to profitable niches. M&A remained healthy with 54 deals in 2024, many targeting compliance technology and AI capabilities. Traditional banks executed 80 fintech acquisitions worth USD 1.2 billion in 2023, accelerating digital transformation. AI differentiation intensifies as the Bank of England’s consortium standardizes ethical-use frameworks, compelling firms to invest in explainable models.
White-space opportunities lie in embedded finance for healthcare, education, and mobility. Strategic alliances with industry incumbents provide distribution scale, while interoperability standards lower integration friction. Network effects in data aggregation raise entry barriers over time, pointing toward gradual consolidation and rising capital thresholds within the United Kingdom fintech market.
United Kingdom Fintech Industry Leaders
Revolut Ltd
Monzo Bank Ltd
Wise plc
Starling Bank Ltd
Checkout.com
- *Disclaimer: Major Players sorted in no particular order
Need More Details on Market Players and Competitors?
Download PDF
Recent Industry Developments
- May 2025: Revolut launched a new suite of embedded-finance APIs for UK businesses, enabling seamless integration of financial services into third-party platforms and expanding its B2B reach.
- April 2025: Monzo completed a USD 501 million funding round led by Abu Dhabi Growth Fund, with participation from Accel and General Catalyst, to accelerate product expansion and international growth.
- March 2025: Starling Bank acquired specialist SME lender Funding Options for £85 million, strengthening its position in business lending.
- January 2025: Lloyds Banking Group established a fintech venture arm capitalized at £300 million to invest in AI, cybersecurity and embedded-finance start-ups.
Research Methodology Framework and Report Scope
Market Definitions and Key Coverage
Our study defines the United Kingdom fintech market as all technology-enabled financial products and services delivered by regulated or exempt entities that generate fee, interest, or interchange revenue within the UK. Covered propositions include digital payments, digital lending and financing, digital investments, insurtech, and purely digital banks accessed through mobile, web, or connected-device interfaces.
Scope exclusions include legacy on-premise core-banking software sold to incumbent banks and professional IT outsourcing, which are not counted.
Segmentation Overview
- By Service Proposition
- Digital Payments
- Digital Lending and Financing
- Digital Investments
- Insurtech
- Neobanking
- By End-User
- Retail
- Businesses
- By User Interface
- Mobile Applications
- Web / Browser
- POS / IoT Devices
Detailed Research Methodology and Data Validation
Primary Research
Mordor analysts interviewed founders of digital banks, payments processors, and alternative-lending platforms across England, Scotland, and Wales, and surveyed compliance heads at incumbent institutions to validate adoption constraints. Feedback on average fee take-rates, borrower default experience, and planned product roll-outs completed the evidence loop and corrected desk-research blind spots.
Desk Research
We began by extracting foundational inputs from public datasets such as Bank of England transaction volumes, UK Finance payment statistics, HM Treasury open-banking dashboards, and Company House filings, which reveal provider revenues and user counts. Sector-level funding flows from Innovate Finance and KPMG investment trackers helped us gauge capital availability, while consumer-adoption data from the FCA Financial Lives survey illustrated addressable demand. Trade association white papers, peer-reviewed journals on reg-tech efficacy, and parliamentary briefings on the Kalifa Review supplied additional regulatory and technology context.
Subscription databases were tapped selectively: D&B Hoovers for company financial splits, Dow Jones Factiva for deal flow, and Questel for patent trends that signal forthcoming product launches. Many further niche sources were consulted; the list above is illustrative, not exhaustive.
Market-Sizing & Forecasting
A top-down demand pool built from consumer and business payment values, unsecured lending balances, assets under management in robo-advisory accounts, gross written premium in insurtech, and active neobank accounts establishes the 2024 base. Select bottom-up checks, such as sampled average revenue per user times disclosed user numbers for the five largest providers, align the pool and expose under or overcounts. Key model drivers include: (1) card-to-cash substitution rate, (2) open-banking API call growth, (3) SME credit appetite, (4) venture-capital deal value, and (5) regulatory sandbox cohort size. A multivariate regression with these variables, supplemented by scenario analysis for funding shocks, projects market value through 2030. Gaps in provider data are bridged by benchmark ratios from analogous OECD markets and validated against expert interviews.
Data Validation & Update Cycle
Outputs pass a three-tier review: automated variance flags, peer analyst cross-checks, and senior analyst sign-off. Values are compared with macro indicators, funding databases, and payment system statistics; anomalies trigger re-contacts. We refresh every 12 months, issuing interim updates for material legislative or funding events.
Why Our United Kingdom Fintech Baseline Commands Reliability
Published estimates often diverge because firms pick different service mixes, valuation metrics, and refresh cadences.
Key gap drivers include counting only enterprise software (some publishers), using conservative fee assumptions that ignore interchange uplift, or translating figures at outdated exchange rates. Mordor reports the full regulated consumer and business fintech universe, applies provider-specific fee curves, and refreshes models annually, which narrows uncertainty.
Benchmark comparison
| Market Size | Anonymized source | Primary gap driver |
|---|---|---|
| USD 18.57 B (2025) | Mordor Intelligence | |
| USD 7.22 B (2024) | Regional Consultancy A | Excludes digital payments over card rails and neobanks |
| USD 10.32 B (2024) | Global Consultancy B | Uses single growth factor; limited primary validation |
| USD 13.98 B (2023) | Industry Association C | Counts on-premise banking software; older currency baseline |
In short, Mordor's disciplined scope setting, dual-track modelling, and continual validation supply decision-makers with a balanced, transparent view they can confidently build upon.
Need A Different Region or Segment?
Customize Now
Key Questions Answered in the Report
What is the current size of the United Kingdom fintech market?
The market is valued at USD 21.44 billion in 2026 and is projected to grow to USD 43.92 billion by 2031.
Which service proposition is growing the fastest?
Neobanking is expanding at a 19.18% CAGR, driven by regulatory support and rising customer adoption.
How significant is mobile banking adoption in the United Kingdom fintech market?
Mobile applications hold a 61.05% share and are forecast to advance at an 18.55% CAGR through 2031, underscoring their dominance.
Why are SMEs critical to fintech growth?
SMEs represent a considerable share of market revenue, with demand for alternative credit and expense-management tools expected to propel growth in the coming years.
How does open banking influence competition?
Standardized APIs grant third-party providers secure access to banking data, reducing entry barriers and adding an estimated +3.2% to market CAGR.
What regulatory challenges do UK fintech's face?
Heightened FCA scrutiny on promotions, operational-resilience rules, and rising cloud-compliance costs collectively subtract up to 1.2%-1.8% from forecast CAGR over the next two years.


