Credit Cards Market Size and Share
Market Overview
| Study Period | 2020 - 2031 |
|---|---|
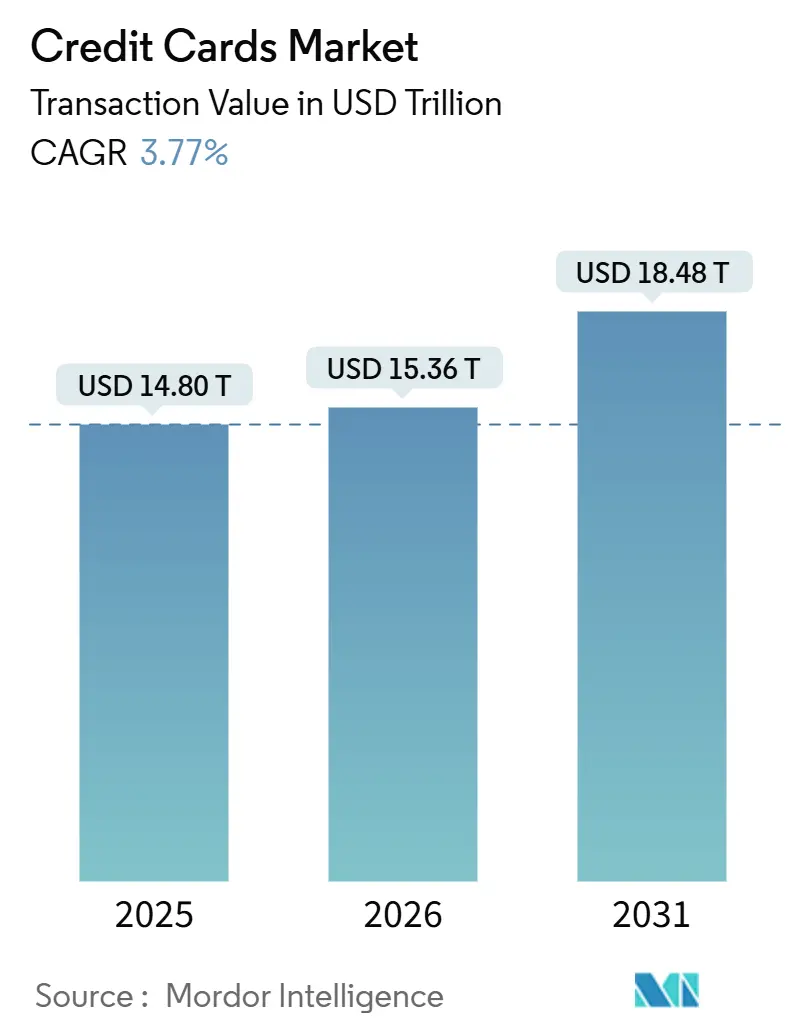
| Market Size (2026) | USD 15.36 Trillion |
| Market Size (2031) | USD 18.48 Trillion |
| Growth Rate (2026 - 2031) | 3.77% CAGR |
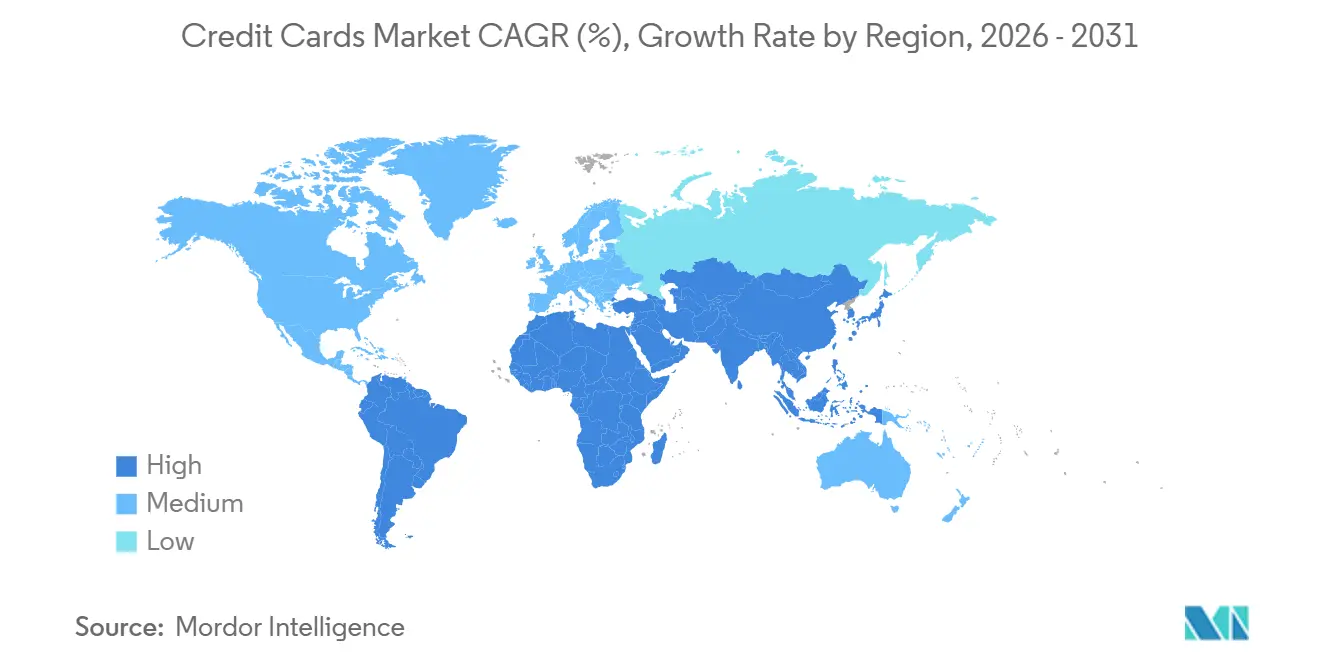
| Fastest Growing Market | Asia Pacific |
| Largest Market | North America |
| Market Concentration | Medium |
Major Players *Disclaimer: Major Players sorted in no particular order Image © Mordor Intelligence. Reuse requires attribution under CC BY 4.0. | |
Credit Cards Market Analysis by Mordor Intelligence
The Credit Cards Market size in terms of transaction value is expected to increase from USD 14.80 trillion in 2025 to USD 15.36 trillion in 2026 and reach USD 18.48 trillion by 2031, growing at a CAGR of 3.77% over 2026-2031.
Issuers are rebalancing economics toward fee-based and analytics-led services as regulation and credit normalization compress interchange yields, while networks scale tokenization and authentication to protect online approval rates and fraud outcomes. Contactless adoption has become mainstream in card-present commerce and continues to expand tap-enabled acceptance, which reinforces daily use cases in transit and small-ticket retail that underpin steady volume growth in the Global credit cards market. Competition from account-to-account rails is rising in bill pay and selected e-commerce use cases, which shifts the competitive focus toward card-on-file loyalty, dispute rights, and bundled benefits that A2A does not replicate at scale. Networks and issuers are also leaning into installments-on-card, SoftPOS acceptance, and AI-driven risk controls to expand addressable volume among long-tail merchants, defend yield, and stabilize approval performance across channels in the Global credit cards market.
Key Report Takeaways
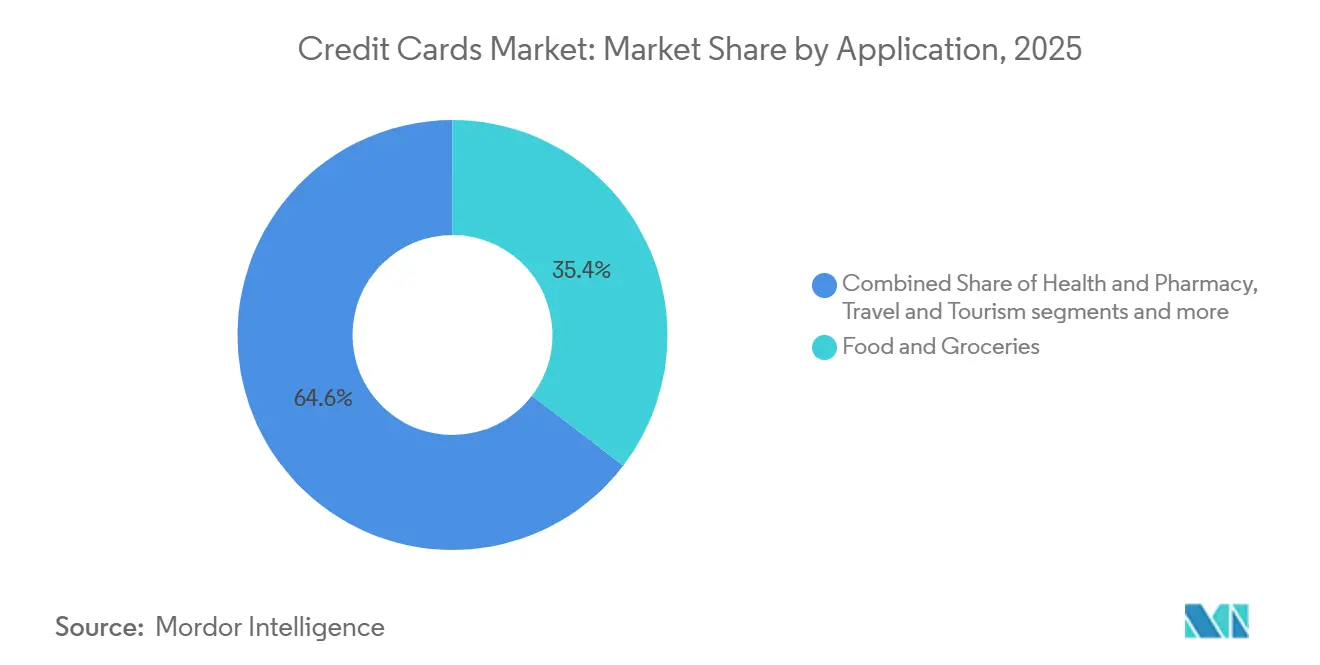
- By application, Food & Groceries led with 35.38% of the Global credit cards market share in 2025, while Travel & Tourism is projected to expand at a 6.12% CAGR through 2031.
- By card type, General-Purpose cards commanded 85.06% of the Global credit cards market share in 2025, while Specialty & Other cards are forecast to grow at a 4.33% CAGR through 2031.
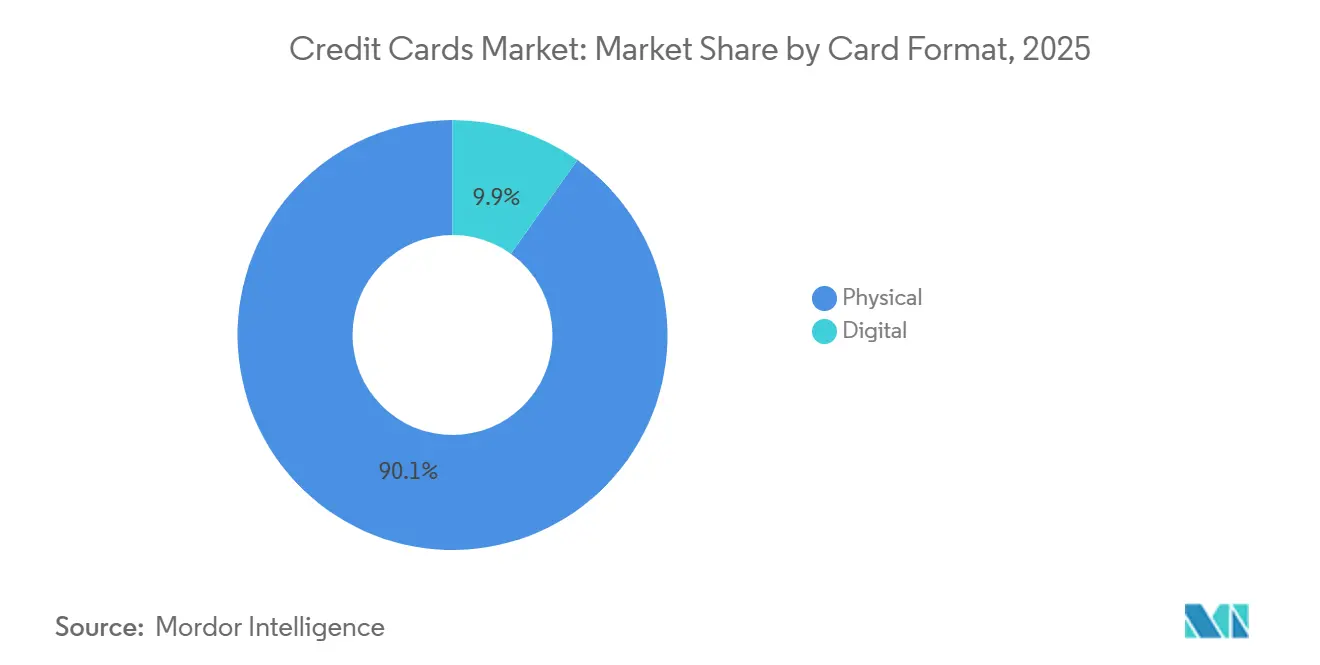
- By card format, Physical cards held 90.12% of the Global credit cards market share in 2025, while Digital or Virtual-only formats are expected to advance at a 6.78% CAGR through 2031.
- By provider, Visa held 52.22% of the Global credit cards market share in 2025, while the Other category, which includes American Express and China UnionPay, is projected to grow at a 5.02% CAGR through 2031.
- By geography, North America accounted for 45.72% of the Global credit cards market share in 2025, while Asia-Pacific is expected to register a 4.24% CAGR through 2031.
Note: Market size and forecast figures in this report are generated using Mordor Intelligence’s proprietary estimation framework, updated with the latest available data and insights as of January 2026.
Global Credit Cards Market Trends and Insights
Drivers Impact Analysis
| Driver | (~) % Impact on CAGR Forecast | Geographic Relevance | Impact Timeline |
|---|---|---|---|
| Contactless ubiquity lifts card-present spend | +1.2% | Global, including the United States and Europe, with strong tap-to-pay penetration | Medium term (2-4 years) |
| Network tokenization and passkeys raise approval rates, cut CNP fraud | +0.9% | Global programs with high issuer adoption across the United States, Europe, and Australia | Short term (≤ 2 years) |
| Card-funded wallets and subscriptions expand card-on-file volumes | +0.7% | Global wallet ecosystems and recurring commerce at scale | Medium term (2-4 years) |
| Cross-border e-commerce and travel recovery support high-yield transactions | +0.6% | Global corridors across travel and digital commerce | Medium term (2-4 years) |
| Installments-on-card recaptures pay-later volumes | +0.5% | United States anchor with spillover to Europe and Asia-Pacific | Short term (≤ 2 years) |
| SoftPOS and Tap to Pay on iPhone expand SMB acceptance | +0.4% | Global rollout across developed and emerging markets | Long term (≥ 4 years) |
| Source: Mordor Intelligence | |||
Contactless Ubiquity Lifts Card-Present Spend
Visa reported that 79% of face-to-face transactions were contactless as of September 2025, which marked an 8-point increase over fiscal 2024 and included 66% penetration in the United States. Mastercard data show that tap-to-pay has reached broad adoption across markets, which aligns with network investments in speed, convenience, and acceptance to lift card-present throughput. Visa’s Tap to Phone volume surpassed USD 33 billion in 2025, with more than 20 million active devices and with one-third of sellers new to the network, which indicates acceptance-led expansion into micro-merchant and cash-heavy verticals [1]Visa Inc., “Visa Fiscal 2025 Annual Report,” Visa Inc., visa.com. Open-loop transit is reinforcing daily tap behaviors and moving spend from closed-loop cards to general contactless credentials, which helps embed habit-forming use cases in urban mobility. These dynamics add incremental volume instead of merely shifting swipe or insert transactions, which sustains card-present relevance in the Global credit cards market as e-commerce grows.
Network Tokenization and Passkeys Raise Approval Rates, Cut CNP Fraud
Over half of Visa’s e-commerce transactions were tokenized as of September 2025, which delivered an authorization lift of nearly 5% for online sellers in 2024 and prevented more than USD 1.1 billion in fraud. Payment providers report higher approval rates and lower fraud when merchants process with network tokens rather than primary account numbers, which reflects token life cycle management and device-bound authentication. Issuer adoption has reached scale in major markets, which moves tokenization from optional to baseline and strengthens card-on-file stability. Apple’s ecosystem shows how tokenized credentials and biometric authentication at checkout translate into strong consumer uptake and merchant sales growth, which consolidates card-on-file volume within wallets. Passkeys and FIDO-aligned biometrics allow merchants to satisfy Strong Customer Authentication while minimizing friction, which helps protect conversion as SCA adoption expands across markets in the Global credit cards market.
Cross-Border E-Commerce and Travel Recovery Support High-Yield Transactions
Visa reported double-digit constant-currency growth in cross-border volume in fiscal 2025, which lifted high-yield international transactions that carry FX-related revenue and enhanced protections that customers value during travel. Policy and industry work on cross-border payment frictions aims to improve transparency and settlement speeds, which can help merchants and issuers sustain approval performance for international commerce flows. Global business travel spending is projected to reach USD 1.57 trillion in 2025, which supports premium card engagement and corporate card usage across air, lodging, and ground [2]Global Business Travel Association, “Global Business Travel Spending to Reach USD 1.57 Trillion in 2025,” GBTA, gbta.org. Co-branded airline and hotel products encourage loyalty-led payment preferences for international trips, which sustain stickier card usage across borders. With cross-border acceptance and travel benefits in place, these flows remain a durable revenue source within the Global credit cards market.
Installments-on-Card Recaptures Pay-Later Volumes
Networks and issuers are expanding installments-on-card within existing credit lines, which enables customers to split payments over time at checkout or post-purchase while keeping rewards and chargeback rights in place. Wallet providers support installment choices within the pay flow, which integrates pay-later features into card-led commerce without moving to third-party BNPL providers. Regulators are formalizing rules for standalone BNPL products, which raises compliance expectations and reduces structural advantages relative to issuer-embedded installments. Issuers are monitoring credit normalization and delinquency trends while using installments to keep payments predictable, which helps maintain engagement on existing card accounts. These steps recapture volumes that might otherwise migrate to non-card BNPL, which supports continuity in the Global credit cards market.
Restraints Impact Analysis
| Restraint | (~) % Impact on CAGR Forecast | Geographic Relevance | Impact Timeline |
|---|---|---|---|
| Interchange caps and network fee regulation compress issuer economics | -0.8% | Europe, Australia, and policy discussions in the United States | Medium term (2-4 years) |
| Rising delinquencies and charge-offs tighten underwriting and credit lines | -0.5% | The United States led, with broader watch across developed markets | Short term (≤ 2 years) |
| Authentication friction depresses e-commerce conversion in some markets | -0.3% | Europe with SCA mandates and select Asia markets post 3DS mandates | Short term (≤ 2 years) |
| A2A and pay-by-bank displace cards in bill pay and select verticals | -0.6% | Brazil, India, the United Kingdom, and Europe, where Open Banking is progressing | Long term (≥ 4 years) |
| Source: Mordor Intelligence | |||
Rising Delinquencies and Charge-Offs Tighten Underwriting and Credit Lines
Serious card delinquencies in the United States reached 7.13% in Q4 2025, while total credit card balances rose by USD 44 billion in the quarter to USD 1.28 trillion, which reflects normalization after years of atypical trends [3]Federal Reserve Bank of New York, “Household Debt and Credit Report Q4 2025,” Federal Reserve Bank of New York, newyorkfed.org. Analysis shows delinquency rates have risen not only in low-income areas but also in the highest-income ZIP codes since mid-2022, which signals broad-based stress across cohorts. Issuers are responding by tightening underwriting, managing lines, and adjusting pricing, which can slow new account growth and spend per account. Portfolios are also adopting earlier risk signals and outreach to reduce roll rates into late-stage delinquency, which aims to protect lifetime value. These steps help stabilize performance as credit normalizes while sustaining engagement in the Global credit cards market.
A2A and Pay-by-Bank Displace Cards in Bill Pay and Select Verticals
Brazil’s Pix became the most-used payment method for online shopping in 2025 and is projected to expand its share further, which demonstrates strong consumer and merchant appetite for instant, low-cost transfers. India’s UPI processes massive volumes and is influencing credit-on-UPI models that pair account-based rails with credit access, which broadens digital payment inclusion. In the United Kingdom and Europe, Open Banking initiatives are building toward variable recurring payments that could take a share in bill pay and subscriptions, which creates selective pressure on card rails. Networks are integrating pay-by-bank and account-based options into their platforms, which allows merchants to support multiple rails while retaining value-added services such as tokenization and fraud controls. This coexistence supports growth across rails while cards remain strong in travel, cross-border, revolving credit, and loyalty-laden everyday spend within the Global credit cards market.
Segment Analysis
By Application: Grocery Necessity Anchors Share, Travel Premiums Drive Growth
Food and Groceries captured 35.38% of the credit card market share in 2025, which reflects non-discretionary, recurring spend that sustains volumes across cycles. This category often presents thinner margins for issuers as payment tilts toward balance during periods of higher household expenses, which requires careful line management and pricing. Merchants are embedding tokenized card-on-file credentials in curbside pickup and delivery journeys, which raises repeat usage and reduces friction at checkout. Category bonuses at supermarkets help issuers lock top-of-wallet position for weekly baskets, which stabilize share despite pressure from alternative rails. This behavior anchors a steady base of high-frequency spend that underpins resilience in the Global credit cards market.
Travel and Tourism is projected to expand at a 6.12% CAGR through 2031, and the Global credit cards market size for Travel and Tourism benefits from higher average tickets, cross-border revenue, and bundled protections that customers value. Business travel spending is expected to reach USD 1.57 trillion in 2025, which supports strong corporate card engagement across air, lodging, and ground categories. Co-branded airline and hotel cards drive loyalty-led usage on international itineraries, which sustains card preference in a segment where dispute rights and insurance are material. Networks and issuers are tuning cross-border risk models and authentication to keep approval rates high on travel bookings, which aligns value-added services with revenue-rich transactions. This segment’s yield profile makes it a critical growth engine for the Global credit cards market.
Note: Segment shares of all individual segments available upon report purchase
By Card Type: General-Purpose Scale Anchors, Specialty Captures Niches
General-purpose credit cards held 85.06% in 2025, which reflects universal acceptance, established rewards ecosystems, and broad issuer portfolios that drive everyday usage in the Global credit cards market. Consumers often hold multiple cards and prioritize rewards and protections when deciding which credential to use, which sustains engagement across grocery, fuel, travel, and online categories. Issuers apply tokenization, fraud prevention, and analytics to improve approval rates and reduce attrition risk, which aligns with network investments in value-added services. As lifecycle management strengthens, general-purpose products remain the default credentials behind wallets and subscriptions, which consolidates recurring spend. These factors keep general-purpose portfolios central to share capture in the Global credit cards market.
Specialty and Other cards are expected to grow at a 4.33% CAGR through 2031, and the Global credit cards market size for Specialty and Other cards benefits from merchant-subsidized rewards and targeted benefits that deepen category engagement. Co-branded programs with retailers and travel providers continue to scale and now rely on instant issuance and tokenization for fast activation and card-on-file usage. Portfolio strategies combine a flagship general-purpose co-brand, which increases share-of-wallet and improves retention across consumer segments. Premium closed-loop propositions also compete for affluent spending with dining, hotel, and lounge benefits, which diversify competitive dynamics across issuer types. These models enable specialty portfolios to defend margins as interchange headwinds grow in the Global credit cards industry.
By Card Format: Digital Transformation Accelerates
Physical plastic still accounts for 90.12% of the credit card market size in 2025 because global point-of-sale infrastructure remains card-present oriented. Many consumers keep their physical card on hand even after provisioning it into a wallet. Yet, Digital-Only virtual cards are set to grow 6.78% annually through 2031. Corporations drive adoption for expense control, foreign-exchange optimization, and security.
Mastercard’s virtual commercial card now sits directly in Apple and Google wallets, offering biometric login and configurable spend caps. Visa’s crypto-linked virtual cards convert stablecoin to fiat instantly, supporting remote teams that face high FX spreads. These innovations shorten settlement cycles and cut fraud exposure by eliminating static card numbers, increasingly making them the default for cross-border procurement and online travel agencies.
Note: Segment shares of all individual segments available upon report purchase
By Provider: Visa–Mastercard Duopoly Holds, Challengers Target Niches
Visa held 52.22% of the credit cards market share in 2025, supported by USD 16.7 trillion in total network volume, USD 14.2 trillion in payments volume, 257.5 billion transactions, and 4.9 billion credentials. Scale across acceptance, compliance, tokenization, and fraud controls gives Visa resilience that underpins issuer and merchant performance in key spend categories. Mastercard is extending value beyond routing through AI-enabled products and services, including the launch of Agent Suite for agentic commerce in January 2026. The network also introduced Merchant Cloud to simplify multi-rail acceptance and deployed a threat intelligence solution that applies real-time cyber analytics to payment fraud at scale. These investments reinforce network-led enablement for issuers and merchants and help sustain approval rates, security, and engagement in the Global credit cards market.
The Other providers segment, which includes American Express and China UnionPay, is projected to expand as the credit card market size for other providers at a 5.02% CAGR through 2031, reflecting premium positioning and regional scale advantages. American Express is leaning into a closed-loop premium model with major 2025 updates to the United States Consumer and Business Platinum Cards that expanded lounge access, dining programs, and hotel partnerships. These enhancements strengthen loyalty-led travel and dining spend while supporting affluent customer engagement and spend-per-card. Networks more broadly are building value-added services in AI, cybersecurity, tokenization, and multi-rail orchestration that raise barriers and defend economics across providers and use cases. Taken together, a Visa and Mastercard duopoly in open-loop networks and premium or regional strategies by American Express and UnionPay create a stable competitive frame that continues to anchor growth in the Global credit cards market.
Geography Analysis
North America accounted for 45.72% in 2025, which reflects deep card penetration, high merchant acceptance, and a mature rewards ecosystem that incentivizes premium upgrades in the Global credit cards market. Canada maintains a high electronic payment penetration with significant contactless and online activity alongside rising real-time transfers for person-to-person and business transactions, which complements card-led commerce. United States credit conditions normalized through 2025 with rising balances and elevated delinquencies relative to pre-pandemic norms, which prompted issuers to tighten underwriting and manage lines. Policy debates on routing and fees are ongoing and influence merchant economics and issuer strategies, which encourages greater emphasis on value-added services to sustain approval and fraud performance. These factors support a bifurcation where premium segments deliver yield while mass-market users rely on wallets, debit, and installments for affordability in the Global credit cards market.
Europe's regulatory landscape, shaped by PSD3 and the Payment Services Regulation, emphasizes fraud prevention, Open Banking, and consumer protection. The EU's interchange framework limits issuer revenues, driving innovation in A2A payments and services-led differentiation. The United Kingdom addresses post-Brexit cross-border challenges and adopts outcome-based authentication, focusing on merchant costs and customer experience. Investments in tokenization, risk-based authentication, and fraud analytics align with network efforts to monetize security services, preserving value in the global credit card market.
Latin America and the Middle East & Africa experience rapid digitization through instant payments and mobile money. Premium card usage grows in developed banking sectors, supported by biometric and risk-based authentication to enhance security and approval rates. Networks and issuers invest in tokenization and acceptance infrastructure, ensuring cards remain relevant in high-value and cross-border transactions. These trends position cards as essential complements to account-based rails in evolving digital ecosystems.
Asia-Pacific is expected to grow at a 4.24% CAGR through 2031, which reflects expanding middle-class populations, digitization, and stronger wallet and contactless adoption that raise spend per card. Mastercard highlights that Asia-Pacific will host an outsized share of the global middle class by 2035, which expands the addressable base for payments and financial services. India’s rapid adoption of UPI and credit-on-UPI models is reshaping domestic digital payments while preserving room for cards in travel, cross-border, and premium categories. Japan’s 2025 3DS mandate achieved strong conversion by routing most traffic through frictionless pathways, which proves that well-tuned authentication can protect online growth without excessive checkout friction. As issuer partnerships and co-brands scale with e-commerce, airlines, and telecoms, the region’s payment mix supports sustained growth in the Global credit cards market.
Competitive Landscape
The Global credit cards market is anchored by a Visa–Mastercard duopoly on open-loop networks, while issuer competition is fragmented across banks, fintechs, and co-branded programs, which creates intense rivalry at the portfolio level. Visa reported USD 16.7 trillion in total volume, 4.9 billion credentials, and USD 40 billion in net revenue in fiscal 2025, which underscores scale in acceptance, compliance, and security infrastructure. Mastercard is expanding beyond routing with AI-enabled orchestration tools, cybersecurity, and multi-rail settlement capabilities, which deepen value-added services for issuers and merchants. American Express advances a premium closed-loop strategy with large investments in travel and dining ecosystems, which compete for affluent spend and loyalty. These positions reinforce a market where service depth and trust are decisive differentiators alongside acceptance reach in the Global credit cards market.
Strategic moves show a platform pivot across the value chain as networks monetize security, analytics, and AI-driven commerce orchestration. Mastercard launched Agent Suite to enable AI agents to transact under enterprise guardrails and partnered with Cloudflare to extend cyber defense for payments infrastructure, which demonstrates how network data and intelligence translate into merchant and issuer services. Stablecoin settlement pilots and payout programs are moving from test to production for specific corridors, which introduces new back-end options while front-end card experiences remain consistent. Retail co-brands continue to refresh with instant issuance, tokenization, and embedded wallets, which help accelerate activation and card-on-file usage across omnichannel journeys.
Acceptance expansion is a visible battleground as SoftPOS and Tap to Pay on iPhone remove hardware requirements and onboard millions of long-tail merchants, which increases total points of acceptance for cards and wallets. American Express delivered major Platinum updates that added lounges and dining access, which strengthened premium positioning where affluent users demand service quality and travel benefits. Networks launched threat intelligence and merchant cloud solutions that bundle tokenization, risk, orchestration, and multi-rail capabilities, which favor scaled players in compliance and security-sensitive categories. With approval and fraud outcomes central to merchant economics, value-added services across routing, data, and security are the decisive levers to defend and expand share in the Global credit cards market.
Credit Cards Industry Leaders
Wells Fargo & Co.
JPMorgan Chase
Citigroup
American Express
Bank of America
- *Disclaimer: Major Players sorted in no particular order
Recent Industry Developments
- March 2026: Mastercard and SoFi integrated SoFiUSD stablecoin settlement across Mastercard’s network to connect crypto and fiat commerce and streamline cross-border settlement. The initiative brings a regulated stablecoin option into selected settlement workflows while keeping consumer checkout unchanged. It reflects a multi-rail approach to enterprise money movement and treasury optimization.
- February 2026: Visa announced that it has agreed to acquire Prisma Medios de Pago and Newpay in Argentina, enhancing its technological capabilities to accelerate innovative payment solutions, improve issuer services, and ensure secure, agnostic processing for diverse payment methods.
- January 2026: Mastercard launched Agent Suite to prepare enterprises for agentic commerce and AI-driven transactions under enterprise guardrails. The suite integrates identity, authentication, authorization, and settlement logic to limit risk from autonomous flows. It positions the network as an enabler of AI-native commerce beyond routing.
- September 2025: American Express announced major updates to United States Consumer and Business Platinum Cards with new lounges and dining benefits. The refresh expands travel access and strengthens premium value for frequent travelers and diners. It demonstrates continued investment in loyalty and experience at the high end of the market.
Research Methodology Framework and Report Scope
Market Definitions and Key Coverage
Our study defines the global credit cards market as the total annual purchase value settled through open-loop consumer and commercial credit cards, be they traditional embossed plastics, tokenized mobile credentials, or single-use virtual numbers, issued by banks, credit unions, and fintechs and processed on any network worldwide.
Scope Exclusion: Private-label store cards and charge cards that do not carry a revolving credit facility are excluded.
Segmentation Overview
- By Application
- Food & Groceries
- Health & Pharmacy
- Restaurants & Bars
- Consumer Electronics
- Media & Entertainment
- Travel & Tourism
- Other Applications
- By Card Type
- General Purpose Credit Cards
- Specialty & Other Credit Cards
- By Card Format
- Physical
- Digital
- By Provider
- Visa
- Mastercard
- Other Providers
- By Geography
- North America
- United States
- Canada
- Mexico
- South America
- Brazil
- Peru
- Chile
- Argentina
- Rest of South America
- Europe
- United Kingdom
- Germany
- France
- Spain
- Italy
- BENELUX
- NORDICS
- Rest of Europe
- Asia-Pacific
- India
- China
- Japan
- Australia
- South Korea
- South-East Asia
- Rest of Asia-Pacific
- Middle East and Africa
- United Arab Emirates
- Saudi Arabia
- South Africa
- Nigeria
- Rest of Middle East and Africa
- North America
Detailed Research Methodology and Data Validation
Primary Research
Mordor analysts interviewed issuing-bank executives, regional payment-switch operators, merchant-acquirer product heads, and consumer-finance regulators across North America, Europe, Asia-Pacific, Latin America, and the Middle East and Africa. These conversations clarified wallet-level penetration, virtual-card adoption, fee compression trends, and forecast assumptions that were only partially visible in secondary material.
Desk Research
We extracted base indicators from high-visibility public sources such as the Bank for International Settlements' red books, World Bank Findex, IMF International Financial Statistics, UNCTAD e-commerce indices, and payments studies from the Federal Reserve and the European Central Bank. Disclosures in issuer 10-Ks, network investor decks, and BIS Quarterly Reports supplied purchase volume splits, fee yields, and delinquency ratios. Subscription databases that Mordor analysts access, D&B Hoovers for issuer financials and Dow Jones Factiva for real-time news, helped validate corporate activity and regulatory changes. The sources listed are illustrative; many additional public datasets and industry releases informed the desk research.
Market-Sizing and Forecasting
A top-down construct starts with network-reported purchase values, then reconciles them with BIS and customs data to capture cross-border spend, which are subsequently adjusted for double counting. Selected bottom-up checks, issuer roll-ups and sampled average-ticket-size multiplied by transaction counts, test the totals. Key variables include active credit cards in circulation, nominal GDP, e-commerce share of retail, average transaction fee, charge-off rates, and contactless usage penetration. Five-year forecasts deploy multivariate regression tied to those drivers, with scenario analysis around interest-rate and fraud-loss shocks. Data gaps in emerging markets are bridged by penetration-rate proxies aligned to mobile-wallet adoption curves.
Data Validation and Update Cycle
Outputs pass a three-layer analyst review, variance checks against parallel payment metrics, and anomaly re-contacts with key experts before sign-off. We refresh the model annually and trigger interim updates for material regulatory or macro events; a fresh validation occurs prior to every client delivery.
Why Mordor's Credit Cards Baseline Is Dependable
Published estimates often diverge because firms track different money flows, base years, or geographic granularity.
Mordor's disciplined focus on purchase value across all regions and networks, its yearly refresh cadence, and its dual-check modelling keep our figures balanced and transparent.
Benchmark comparison
| Market Size | Anonymized source | Primary gap driver |
|---|---|---|
| USD 14.83 trillion (2025) | Mordor Intelligence | - |
| USD 530.2 billion (2023) | Global Consultancy A | Tracks issuer revenue pools, excludes transaction value and several regions |
| USD 622.76 billion (2024) | Trade Journal B | Counts fee income only, omits corporate card volumes |
| USD 1.84 trillion (2024) | Regional Consultancy C | Uses outstanding balances rather than spend; limited network coverage |
These comparisons show that results vary mainly with scope definitions and data depth; Mordor's purchase-value measure, comprehensive geography, and rigorous annual updates provide a reliable baseline for decision-makers.
Key Questions Answered in the Report
What is the Global credit cards market growth outlook to 2031?
The Global credit cards market size is projected to reach USD 18.48 trillion by 2031 at a 3.77% CAGR over 2026-2031, supported by contactless ubiquity, tokenization, and authentication that protect approval and fraud outcomes.
Which applications are leading and growing fastest within cards?
Food and Groceries are the largest in 2025 at 35.38% while Travel and Tourism is the fastest growing at 6.12% CAGR through 2031, reflecting sticky necessity spend and premium cross-border travel flows.
How are issuers defending economics amid fee caps?
Issuers emphasize premium cards, annual-fee propositions, installments-on-card, and value-added services such as fraud prevention and tokenization to offset regulated interchange and preserve approval rates.
Where will regional growth be strongest to 2031?
Asia-Pacific is expected to grow the fastest at a 4.24% CAGR, driven by middle-class expansion, wallet adoption, and upgraded acceptance and authentication infrastructure across major markets.
What technologies most improve online approvals and security?
Network tokenization, passkeys, and biometric authentication are lifting e-commerce authorization rates and reducing fraud while helping merchants comply with SCA in regulated markets.
How is SoftPOS changing acceptance for small businesses?
SoftPOS and Tap to Pay on iPhone are onboard long-tail merchants without hardware, which expands acceptance points and adds incremental card-present volume in cash-heavy niches.


